Notes on:
Trade in AI-Related Products
Federal Reserve Bank of Minneapolis Quarterly Review 46(1), June 2026; Minneapolis Fed Staff Report 684 and NBER Working Paper 35053
2026
AI · international trade · trade policy · tariffs · LLM classification · trade deficit
Paper · doi · PDF
Made with AI: Haiku 4.5 (research), Opus 5 (reading, figures and writing)
Michael E. Waugh (Federal Reserve Bank of Minneapolis and nber), “Trade in ai-Related Products.” Read in the April 2026 version — Minneapolis Fed Staff Report 684, also circulated as nber Working Paper 35053 — which has since been published in the Minneapolis Fed Quarterly Review 46(1), June 2026. There is no talk video, so this is written from the paper. Code at github.com/tradewartracker/ai-trade-index.
Suppose you want to know how much of what America buys from abroad is now the ai data center buildout. This ought to be a lookup. The U.S. Census Bureau records every imported good at the ten-digit Harmonized System level, which is the finest product detail American trade data has — 18,364 distinct codes turned up in 2024 — and it will tell you, to the dollar, how much of each one crossed the border in which month from which country paying how much duty. What it will not tell you is which of them are ai.
What it tells you instead is 8471500150: PROC UNT IN HOUS W/ EITHER STOR, IN&OUTPUT,W/O CRT. That is the single largest ai-related U.S. import of 2025 — $163.55 billion, 5.67 percent of all trade, up 343 percent since 2023 — and nothing in the string says so. Somewhere below that line are transformers and chillers and busbars and structural steel, each with its own compressed shout of a description, and the honest answer to “how much of this is data centers” is that somebody has to read all eighteen thousand of them and decide.
So Waugh has somebody read all eighteen thousand of them. Footnote 1, and this is the entire disclosure: “I employ Claude (Anthropic) as my main classification model, using the tool-calling api to obtain structured responses.” A Federal Reserve Bank staff report about the ai investment boom, measured by asking an ai. The paper does not make the joke, and I will make it only once.
The mechanism. For each code the model gets two things. It gets the HS10 code and the Census long description — the full one, not the abbreviated shout printed in the tables. And it gets the associated six-digit naics code or codes, with descriptions, from the Census concordance. The naics input is the clever part and Waugh is explicit about why: naics is production-oriented, so it says how a thing is typically made and who uses it, which is exactly the information a physical description leaves out. A pump described as a pump is uninformative. A pump attached to an industry code is a pump you can place.
The model is asked to sort each code into three bins, and the definitions are worth reading literally. High is “products directly used in data center construction or operation, with clear application to compute, cooling, power, networking, or facility infrastructure.” Medium is “plausible data center applications but also significant non-data-center uses.” Low is “no apparent connection to data center construction.” The baseline uses High only; Medium exists as a robustness check that the paper runs and never reports. Petroleum, precious metals, and the art-and-antiques chapters are dropped before any of this starts.
Then the output is nailed down. For each code with description , the model returns
where relevance is an enumerated type, confidence is an integer from 0 to 100, category is one of a fixed list, and reasoning is a sentence of English. The tool the model is made to call is named, with no ceremony at all, classify_hs10_code. Waugh’s defence of the design is that the enum is doing real work: “The model cannot return ‘Medium-High’ or ‘Moderate’, etc.” This is a small and correct point about measurement. The thing that makes an llm label usable as data is not that the model is smart, it is that the model is prevented from being expressive.
The prompt casts the model as “an expert in ai data center construction, operations, and supply chains” and then spends its last lines on edge cases, which is where you can see the author anticipating his own referee: “‘Diesel engines’ could be for generators (relevant) or vehicles (not relevant).” “‘Pumps’ could be for cooling systems (relevant) or unrelated industrial use.” “‘Copper wire’ is relevant for electrical systems.” “Food, textiles, furniture, and consumer goods are generally NOT relevant.”
Now force the jargon to say what it means. “High relevance” does not mean this good went into a data center. It means this good plausibly could have. Waugh’s own framing is careful about it — the measurement question is “which traded goods plausibly enter ai data-center construction, equipping, and operations” — and the distinction is load-bearing for everything downstream. Nothing in customs data observes a destination rack. The classification is a statement about product categories, not about shipments, and the entire paper is that statement crossed with the trade file.
What comes out. 645 codes are High, out of 18,364. In 2023 those codes were $379.0 billion of imports; in 2025 they were $654.0 billion, up 72.6 percent. The 15,915 Low codes grew 2.5 percent.
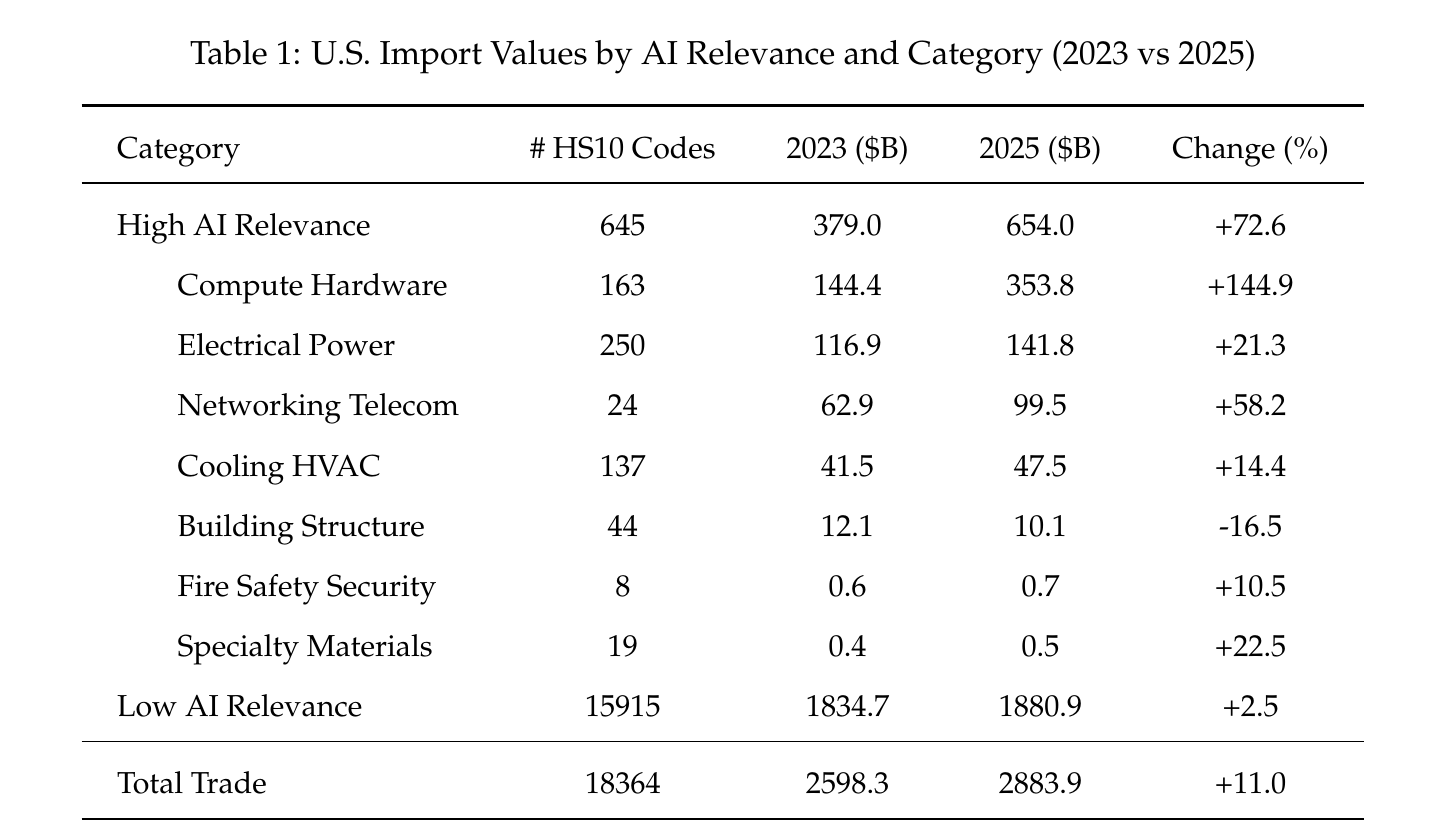
The seven substantive categories are the interesting texture. Compute Hardware is 163 codes and grew 144.9 percent, to $353.8 billion — about half of the whole ai aggregate. Electrical Power is 250 codes and $141.8 billion, up 21.3 percent. Networking Telecom is only 24 codes but $99.5 billion, up 58.2 percent. Cooling hvac grew 14.4 percent. Building Structure fell 16.5 percent, which is the only negative in the table and, as we will see, a useful piece of evidence about the classifier. Four categories are nearly 95 percent of everything labelled High. (A pedantic note the paper invites: the prose says the model picks among eight categories, the appendix schema enumerates nine, and Table 1 reports seven. Seven is the right number for anything about results; the extras are “Not dc Related” and an unused “Maintenance Operations.” Also, High and Low do not add to Total — roughly $349 billion of 2025 imports sit in the Medium bin, which is reported nowhere. That subtraction is mine.)
Then the picture the paper is really about.
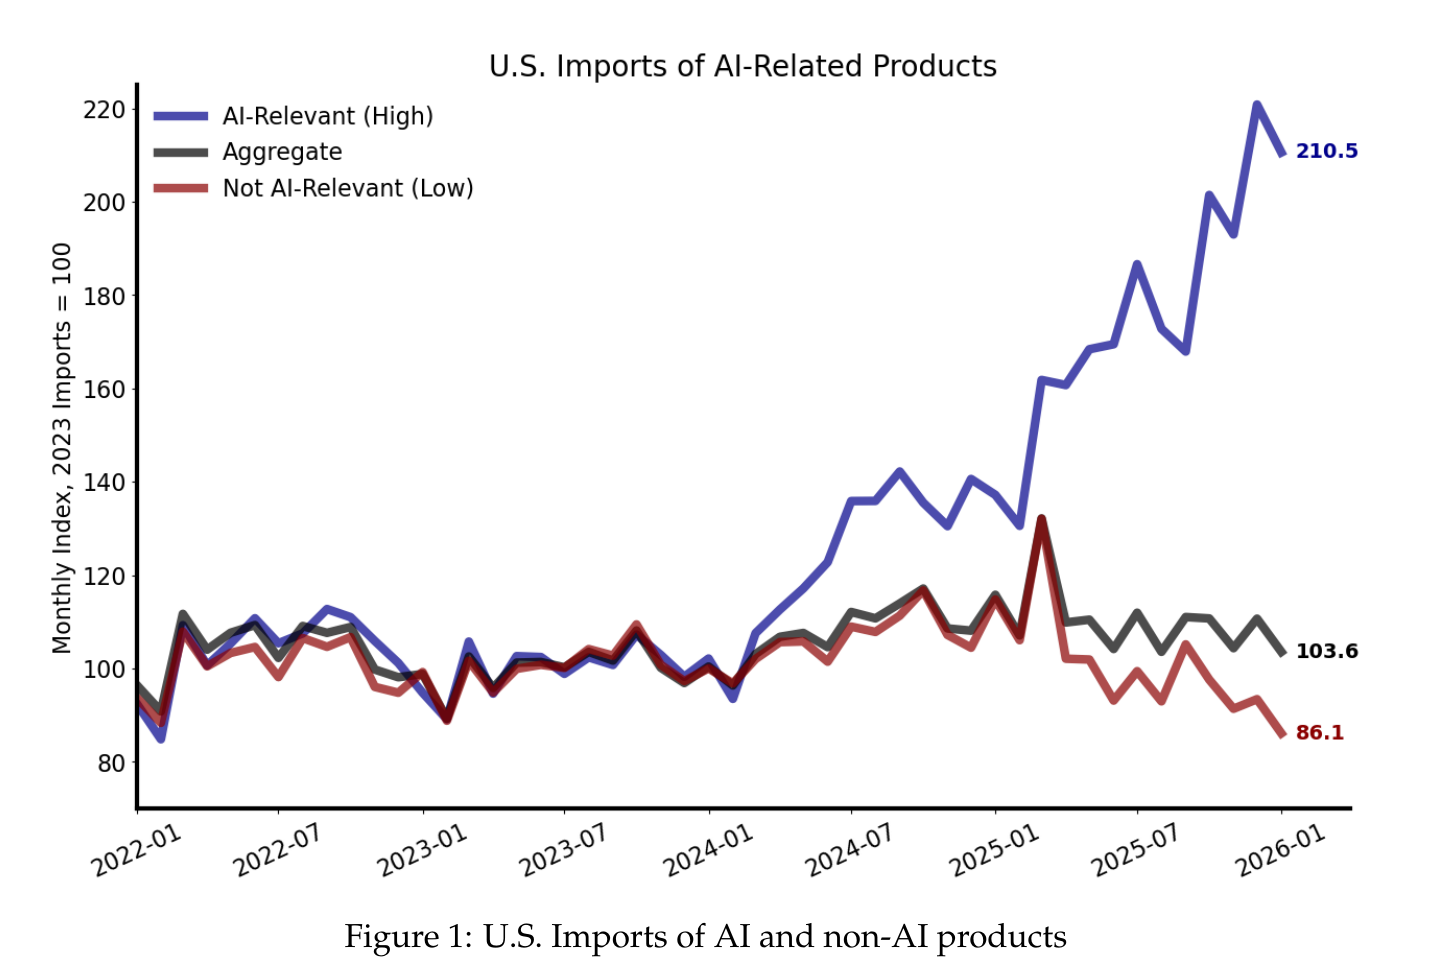
From 2022 to early 2024 there is no differential trend at all; the ai line and the everything-else line are the same line. “Then something changed in early 2024.” By January 2026 the ai index is 211 — imports running 111 percent above the typical 2023 month — and Waugh matches the break date to the wave of large-scale data center announcements that began in early 2024. It is a persuasive coincidence and he presents it as one; there is no break test and no event study, and the paper does not pretend otherwise.
Two things about that chart deserve more attention than the headline. First, ai-related products are 23 percent of all U.S. imports in 2025, up from 15 percent in 2023, and even if you throw out Compute Hardware entirely the remainder still grew 40 percent. That is Waugh’s defence of casting the net wide, and it is the number a narrow semiconductor list could never have produced.
Second — and this is the fact I would put on the front page — the red line ends at 86. Non-ai imports in January 2026 are 14 percent below the typical 2023 month. Headline U.S. imports grew 11 percent over a period in which average tariffs rose by more than ten percentage points, which looked like a puzzle about tariff pass-through and turns out to be a composition effect. The trade contraction the tariffs were supposed to cause is there. It has been hiding behind the trade expansion the ai boom caused. Waugh’s phrasing is characteristically flat: “This aggregate growth is surprisingly strong given that U.S. tariffs increased by more than ten percentage points in 2025. However, this aggregate growth is driven by the spectacular growth in ai-relevant products.”
The surprise is Mexico.
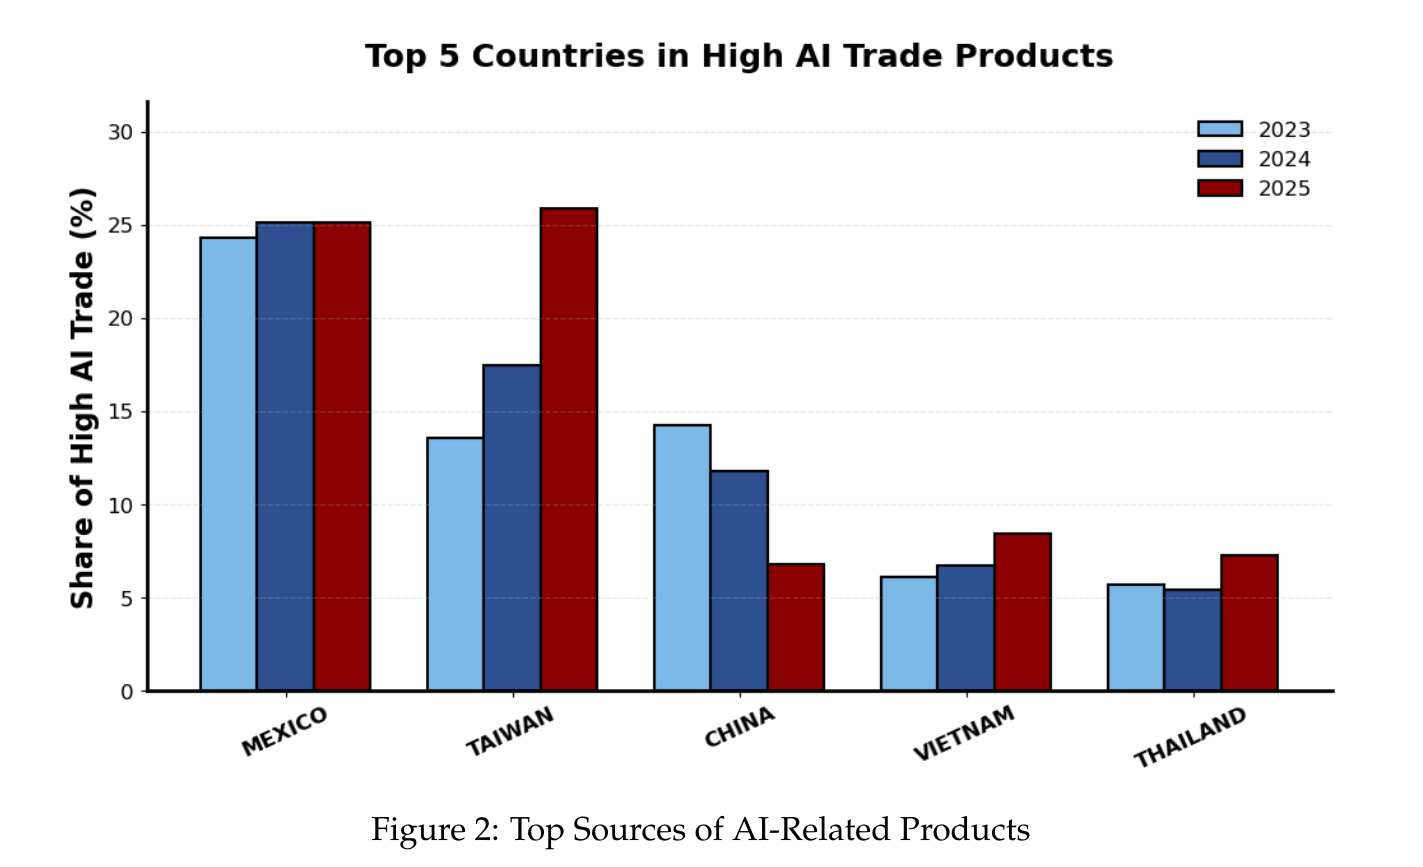
Everyone’s mental model of ai trade is a chip story: Taiwan, tsmc, the Strait, export controls. Taiwan does behave accordingly — 13.6 percent of ai-related imports in 2023, 25.9 percent in 2025, “increasingly dominant.” China does the opposite, falling from 14.3 percent to 6.8 percent, its share now comparable to Vietnam’s and Thailand’s, and Waugh gives the mechanism cleanly: ai goods were broadly exempted from the April 2025 tariffs, but China also carried a separate 20 percent charge under the “fentanyl tariffs,” and the product-level exemptions do not reach those. So the exemptions that spared everyone else’s ai goods did not spare China’s. China was, as he puts it, “uniquely penalized.”
And sitting flat across all three years at about a quarter of everything is Mexico. “Mexico’s dominance is perhaps the most surprising feature of Figure 2.” It is not surprising that Mexico is a big trading partner; it is the biggest. What is surprising is the breadth: Mexico leads Cooling hvac at 34.6 percent and Electrical Power at 23.6 percent, is second in Compute Hardware at 26.4 percent and Networking Telecom at 17.8 percent, and is simultaneously the destination for about 32 percent of American ai-related exports, leading three of the four big categories there too. It is on both sides of the trade in nearly every category at once.
This is the fact that justifies the whole measurement exercise, because it is a fact that cannot exist without it. “A narrow focus on chips alone would suggest that ai trade is primarily a U.S.–Taiwan story. Figure 3 shows it is much broader.” And it pays a debt somewhere else, which is what separates a striking number from a finding: Canada and Mexico had essentially identical tariff treatment through 2025, yet U.S. imports from Canada fell 8.3 percent while imports from Mexico rose 6.4 percent. A lot of that gap is the 40.7 percent growth in Mexican ai-related exports to the United States. An unrelated usmca puzzle dissolves when you sort the goods by whether a language model thought they belonged in a data center.
Waugh then undercuts his own best result, four pages later, and this is the most interesting paragraph in the paper. Exports of ai goods grew 34.5 percent since 2023, led by Compute Hardware at 62.1 percent, which is odd on its face — a domestic demand boom of this size should have pulled goods away from export markets, the mirror image of the “venting out” in Almunia, Antràs, Lopez-Rodriguez and Morales (2021). Instead exports rose alongside imports, with a third of them going to Mexico. One reading is that the U.S. sits in the middle of ai global value chains. The other reading is his: the pattern “is also consistent with the U.S. being an entrepôt. That is ai-related materials coming into the U.S., exported to Mexico for assembly or processing, and then shipped back to the U.S. And if so, little value is actually being added domestically.” Gross trade data cannot tell the two apart. You would need trade in value added. So the paper’s headline surprise arrives with its own reason for doubt attached, from the same author, which is more than most papers manage.
Trade policy has treated all of this very gently.
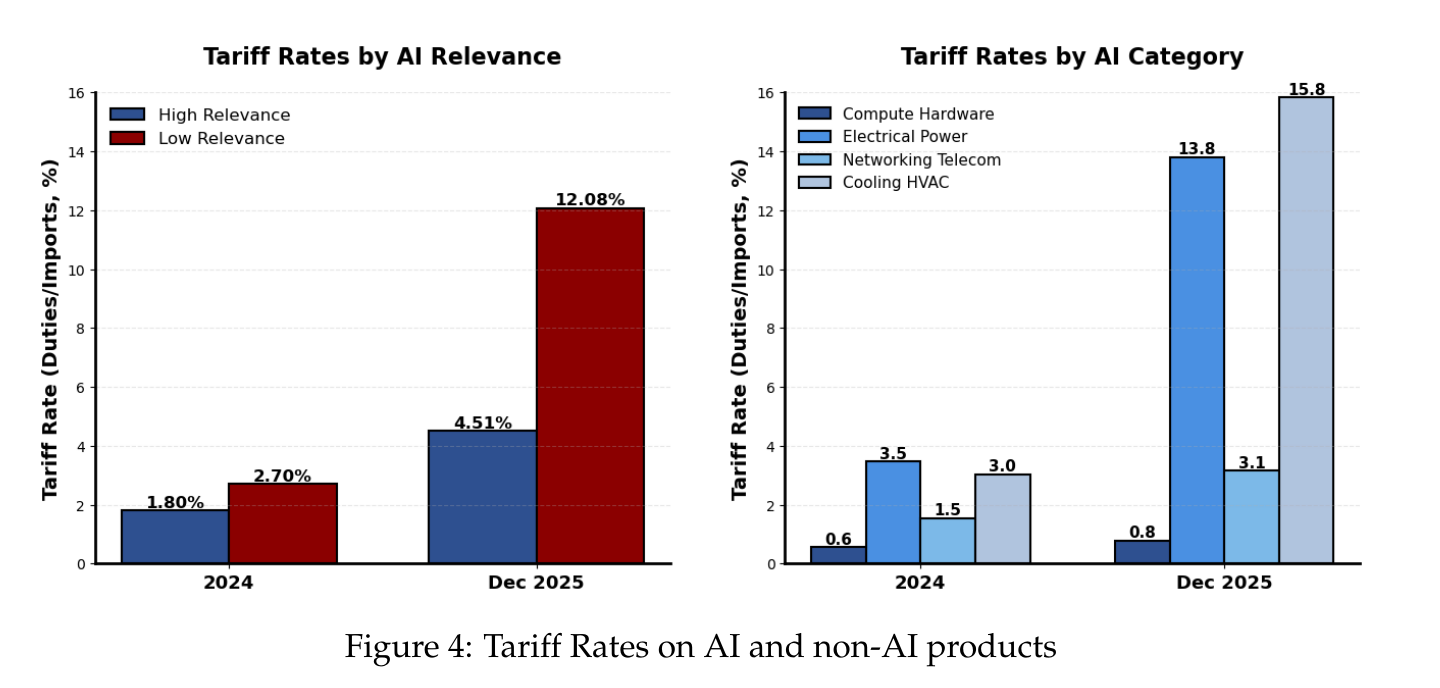
In 2024 the effective rate on ai goods was 1.8 percent against 2.7 percent for everything else, a gap you would not write home about. By the end of 2025 it was 4.5 versus 12.1. Both rose; one rose much less. Within the ai aggregate the shielding is wildly uneven — Compute Hardware pays 0.8 percent, Networking Telecom 3.1 percent, while Electrical Power pays 13.8 percent and Cooling hvac 15.8 percent, both above the non-ai average. The gpus walk in free and the chillers pay full freight.
The mechanism is three exemption lists: the Consumer Electronics amendment to Executive Order 14257 of April 11, 2025, the Annex II list from the same order, and the Section 122 surcharge exemptions of February 2026, which were written after the earlier tariffs and their exemptions had been removed. Note that sequence. The carve-outs were repealed and then reinstated within weeks.
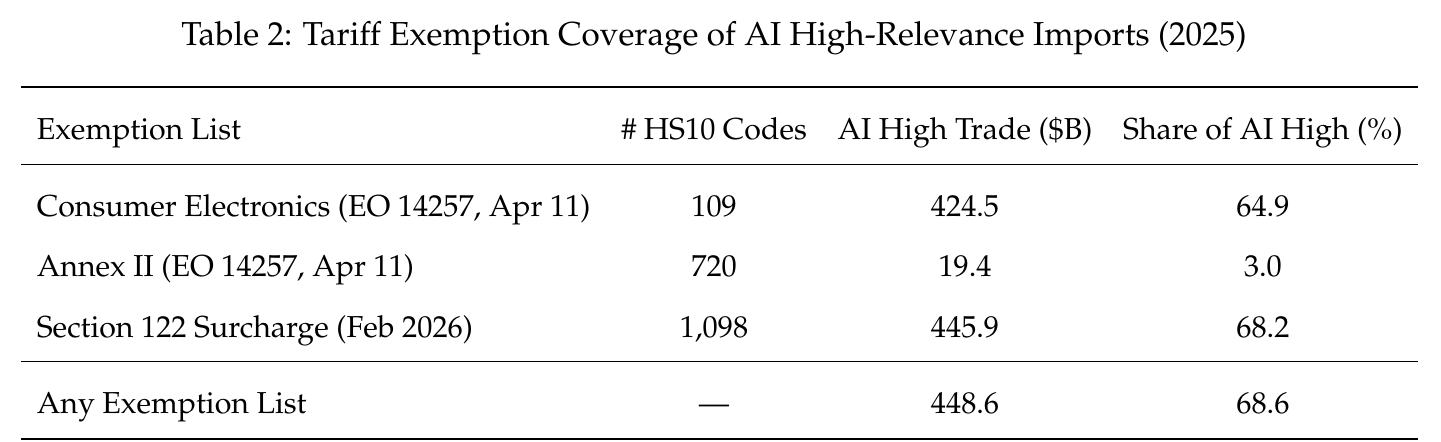
The asymmetry in that table is the whole political economy in two rows. Annex II reaches 720 codes and $19.4 billion. Consumer Electronics reaches 109 codes and $424.5 billion. One list is broad and cheap; the other is narrow and covers two-thirds of the value, because the value is concentrated in a handful of compute codes. Across all three lists, 68.6 percent of ai-related imports land on at least one. At the category level, 97.3 percent of Compute Hardware’s $354 billion is exempt, against 13.5 percent of Electrical Power, 0.4 percent of Cooling hvac, and 0.0 percent of Building Structure.
Waugh treats these exemptions as policy that happened to fall kindly on ai goods. I am not sure that is the right tense. They were written in April 2025, well into the buildout, and the Substack piece he cites for them is titled “The Tariff Exemption Behind the ai Boom” (Politano 2025). The more natural reading is that the buildout was large enough and loud enough to obtain its own tariff relief, which makes the exemptions an outcome of the boom rather than a lucky background condition. Nothing in the paper turns on this. But “ai products were exempted” and “ai products got themselves exempted” are different sentences, and only one of them treats trade policy as a thing that responds to money.
And then the number everyone will quote.
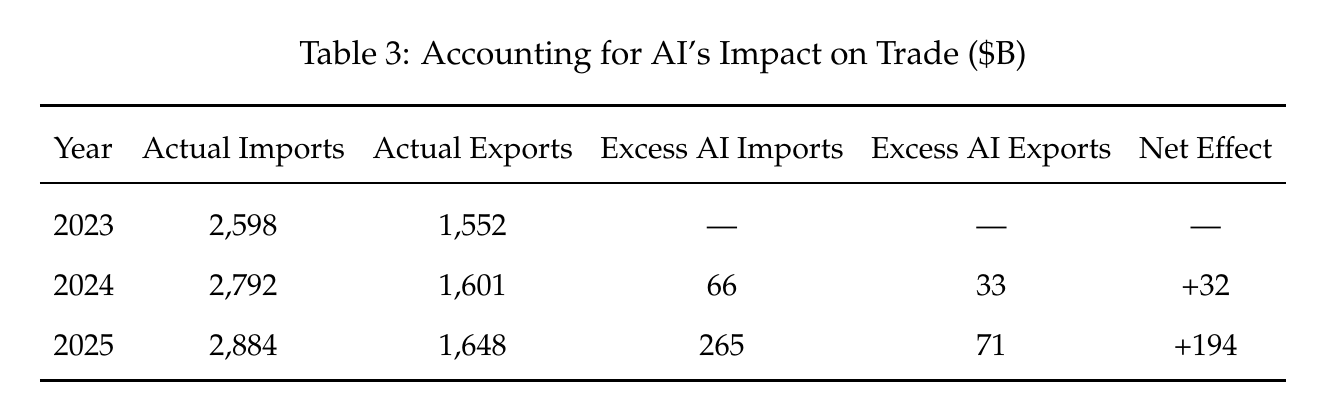
The exercise is arithmetic and Waugh says so. Take the growth rate of the non-ai import and export indices — literally the red lines. Apply them to 2023 ai levels. Call the gap between actual and counterfactual “excess ai trade.” For 2025 that is $265 billion of excess imports and $71 billion of excess exports, netting to $194 billion. The actual 2025 goods deficit was $1,235 billion; without the ai boom, $1,041 billion, or nearly 16 percent smaller. In 2024 the same calculation gave $32 billion, so the effect sextupled in a year. He labels it honestly: “this exercise is merely an accounting exercise,” with the structural version deferred to work in progress with Ferrante, Prestipino and Raffo (2026) under the excellent title “The Missing Trade Collapse.”
Here is where I would push. The counterfactual asks what ai goods would have done had they grown like non-ai goods. But non-ai goods over this window were not a neutral benchmark — they were a treatment group. Non-ai imports fell 14 percent below their 2023 monthly average, by Waugh’s own measurement, largely because they were being tariffed at 12.1 percent while ai goods were tariffed at 4.5 percent. So “grew like non-ai goods” quietly means “grew like goods facing a seven-and-a-half point higher effective tariff.” Whatever share of the ai–non-ai growth gap is really the tariff gap gets attributed to the ai boom, and the $194 billion absorbs both channels without distinguishing them.
Which makes one sentence the load-bearing overreach of an otherwise scrupulous paper: trade in ai-related products “might be even more important than dramatic changes in U.S. trade policy in 2025.” Maybe. But the exercise that produces the $194 billion is constructed out of the differential effect of trade policy. It cannot rank the two forces, because it has already mixed them. The number is a good upper-ish bound on the ai channel and a bad decomposition.
The other objections are the ones a referee gets paid for. Everything here is nominal, so some unknown fraction of that 144.9 percent in Compute Hardware is gpu prices rather than gpu units, and “ai trade” is partly “ai inflation” — Waugh flags unit values as future work, and given 2023–2025 this is not a small caveat. Refined copper cathodes at $16.6 billion and lithium-ion batteries at $16.5 billion are labelled High, though copper goes into housing and the grid and lithium-ion goes overwhelmingly into cars, which is exactly what the Medium bin was built for; the 40 percent ex-compute growth number is the one most exposed to that. In the classifier’s defence, Building Structure fell 16.5 percent and Cooling hvac grew only 14.4 percent, so it is plainly not just labelling whatever went up. Three processor codes in the top twenty report growth of exactly +0.0 percent, which across two years is almost certainly an hs reclassification rather than a fact about the world; they are about $21 billion combined and threaten nothing, but nobody remarks on them. And the Medium bin — roughly $349 billion, the exact margin where the model’s judgement is doing the most work — is run and never reported.
To his credit, the sharpest caveat is Waugh’s own, stated plainly and repeated in the conclusion: “I do not yet have a ground-truth benchmark for validating the product-level labels. The classification should therefore be understood as a systematic but imperfect measurement exercise.” What he offers instead is auditability. Multiple runs were broadly stable. An earlier keyword-matching version, much coarser, delivered similar trends. The full list of 645 High codes is published in the repository. And the tables at the back print the model’s own reasoning sentence for each of the top twenty codes, which is the paper showing its work — you can read that refined copper cathodes were classified High because they are “the primary raw material used to manufacture electrical wiring, cables, busbars, and other conductive components essential for data center power distribution systems,” and decide for yourself whether you buy it.
That is a genuinely reasonable sentence, is the thing. It is the sentence a competent research assistant would have written after an afternoon with the copper. There were 18,364 codes to get through, and the assistant is also, at some remove, what all the copper is for.