Notes on:
Export Sanctions: Rerouting, Disruption, and the Reach of Economic Warfare
CEPR Discussion Paper 20601
2026
geoeconomics · sanctions · Russia · rerouting
PDF · Transcript
Made with AI: Fable 5.1 (reading and writing)
Konstantin Egorov, Vasily Korovkin, Alexey Makarin and Dzhamilya Nigmatulina. Presented at nber si International Economics and Geopolitics, July 10, 2025 (discussant: Stephen Redding); no recording exists. Video used here: Korovkin’s presentation at the Kiel-cepr Conference on Geoeconomics in Berlin, October 18, 2024, discussed by Julian Hinz — an earlier version of the paper, with different headline numbers. Paper: the July 2026 draft, retitled, from Makarin’s site, and every number below is that draft’s. The version circulating as cepr Discussion Paper 20601, still called “Trade Sanctions”, is the 2025 vintage; its abstract reports a 62 percent direct decline and a 27 percent fall in total sanctioned-product imports through 2023, and none of those figures are used here.
Two things sanctions can be for
A trade sanction can be a threat — change your behavior or we stop selling to you — or it can be a weapon: we stop selling to you so that you cannot build the things we do not want you to build. The first is coercion and is nearly impossible to evaluate, because concessions take years and depend on everything. The second is economic warfare, and it has a measurable target: the target’s output. Export sanctions, restrictions on what you may sell to the target, are the instrument for the second purpose, and the eu said so in as many words in 2022 — weaken Russia’s economic base, deprive it of critical technologies, curtail its ability to wage war. The policy question, then, is not whether Russia changed its mind but whether its factories got the chips. The skeptics’ case, put by two U.S. senators in 2024, is that Russia’s imports of critical battlefield goods have “nearly recovered” to pre-invasion levels and that the export-control regime is “lethally ineffective.” The skeptics’ evidence is trade flows. The paper’s contribution is to have Russia’s own data — customs records, two million firms’ balance sheets, railway shipments, procurement contracts — and to show that trade flows are the wrong place to look.
The rerouting half
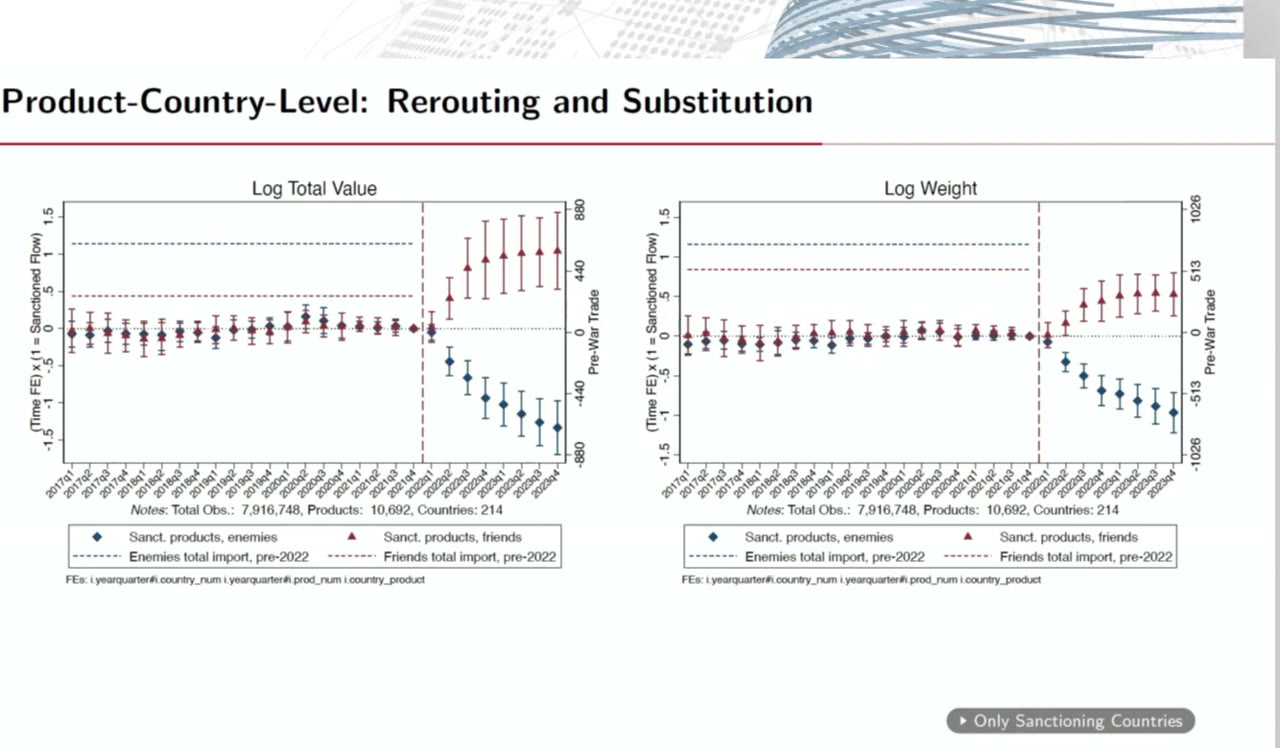
The sanctions covered 36 percent of Russia’s prewar import value, imposed by many countries on different dates on products defined down to ten digits — the authors hand-assembled a dataset of roughly 72,000 sanctioned country-product varieties with 50 distinct imposition dates. That variation, plus product-by-time and country-by-time fixed effects, is what lets them separate the sanction from the war. Directly sanctioned country-product flows collapsed: among flows that stayed positive, imports were nearly 60 percent lower by end-2023, and the probability of any positive quarterly import fell about ten points. Imports of the same sanctioned products from friendly countries — China, Turkey, the Central Asian neighbors — roughly doubled. So far this is what the senators see.
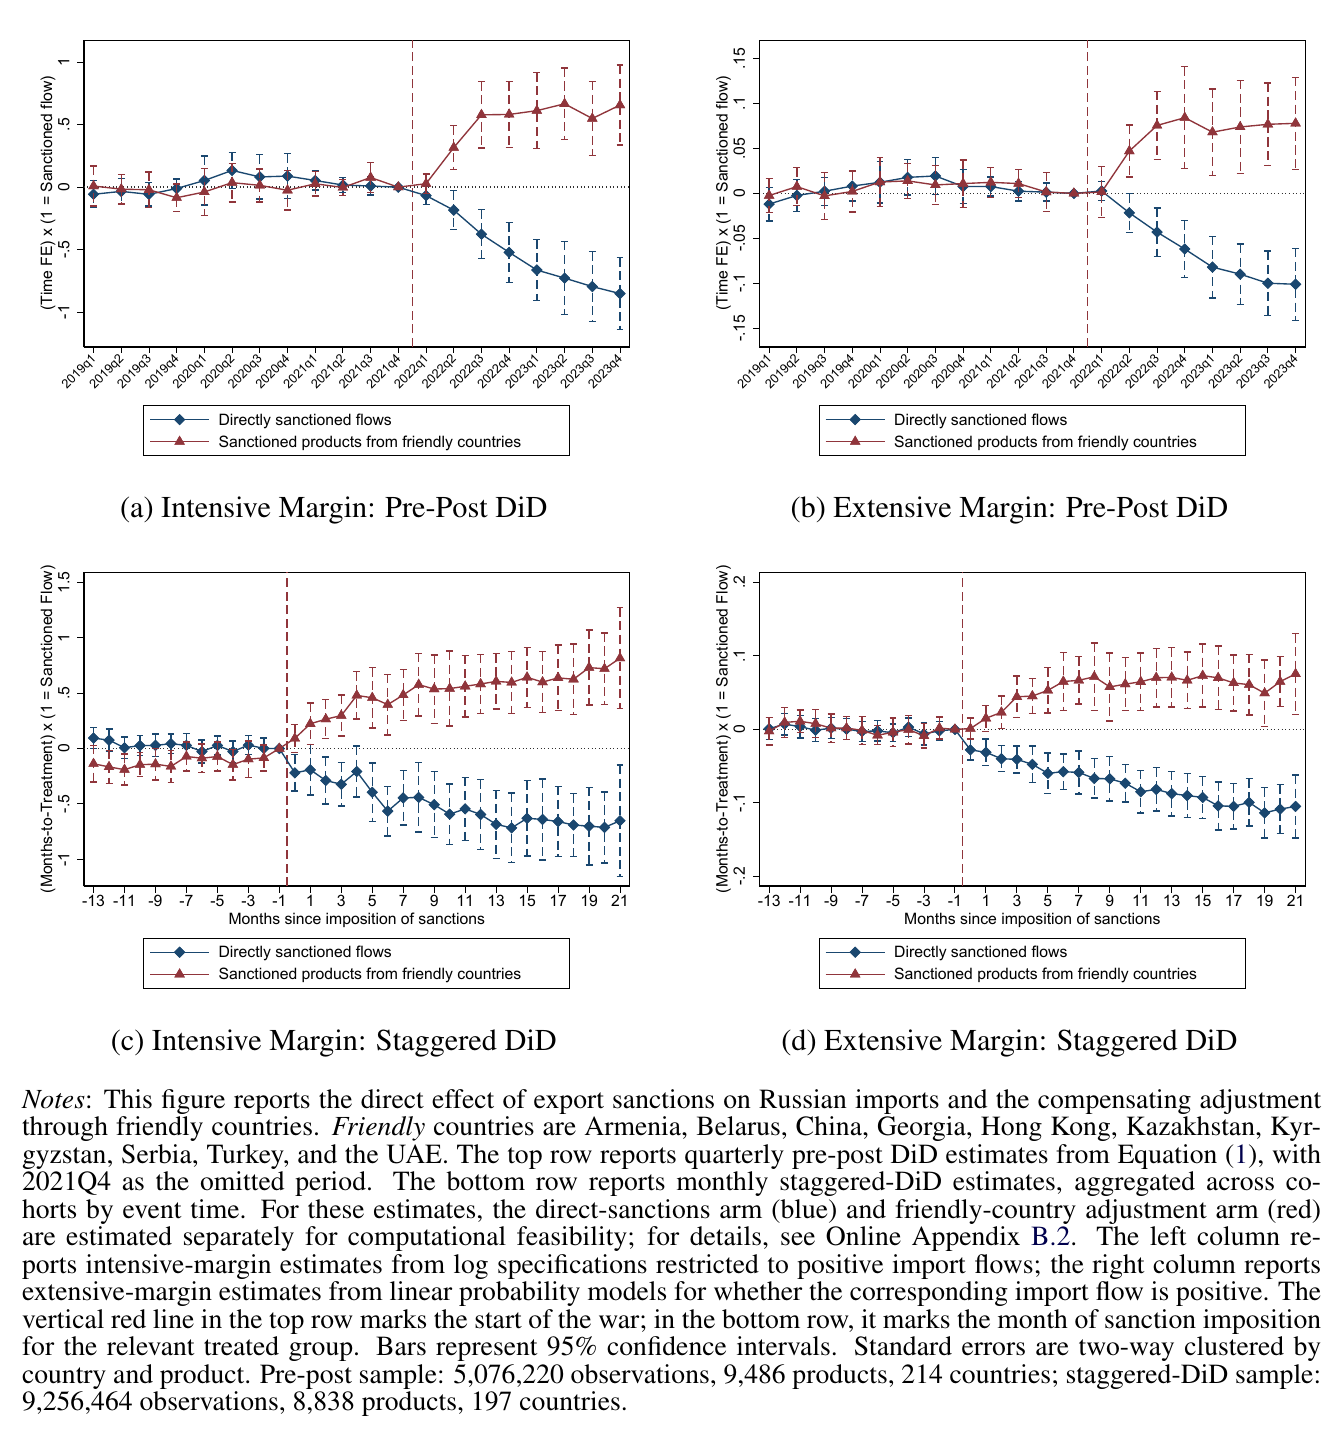
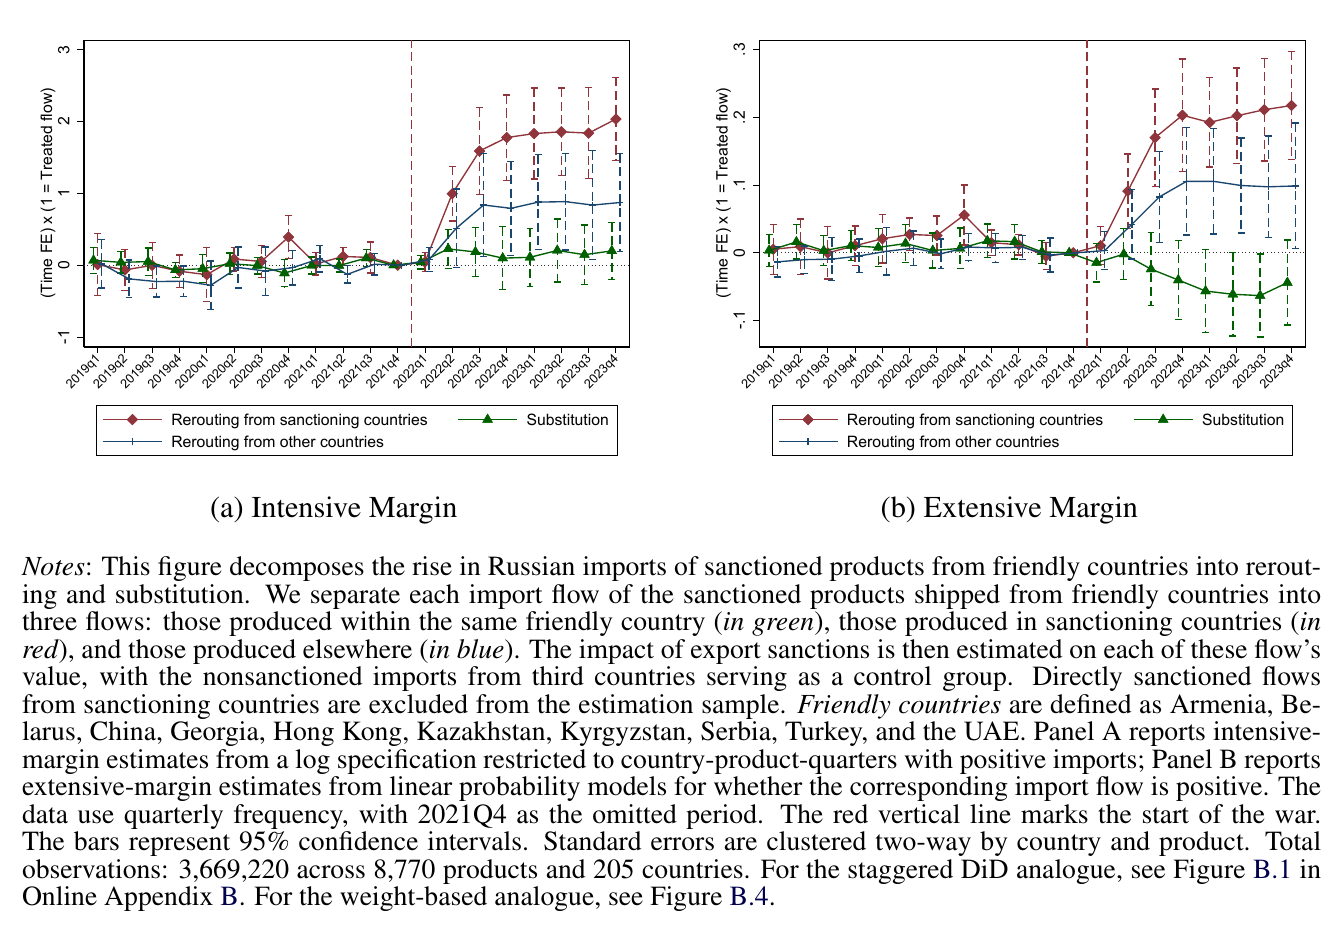
Here is what they do not see. Russian customs records list, for every transaction, both the country of shipment and the country of production. Using that, the surge from friendly countries turns out to be almost entirely rerouted goods, and more than two-thirds of it is goods produced in sanctioning countries and shipped through an intermediary — which is to say, Western products arriving in Russia in probable violation of Western export controls. Genuine substitution toward things friendly countries make themselves is muted. (Since the customs form asks the importer where the goods were made, and the importer has every reason to answer “Turkey” rather than “Germany”, the authors read the sanctioning-origin share as a floor.)
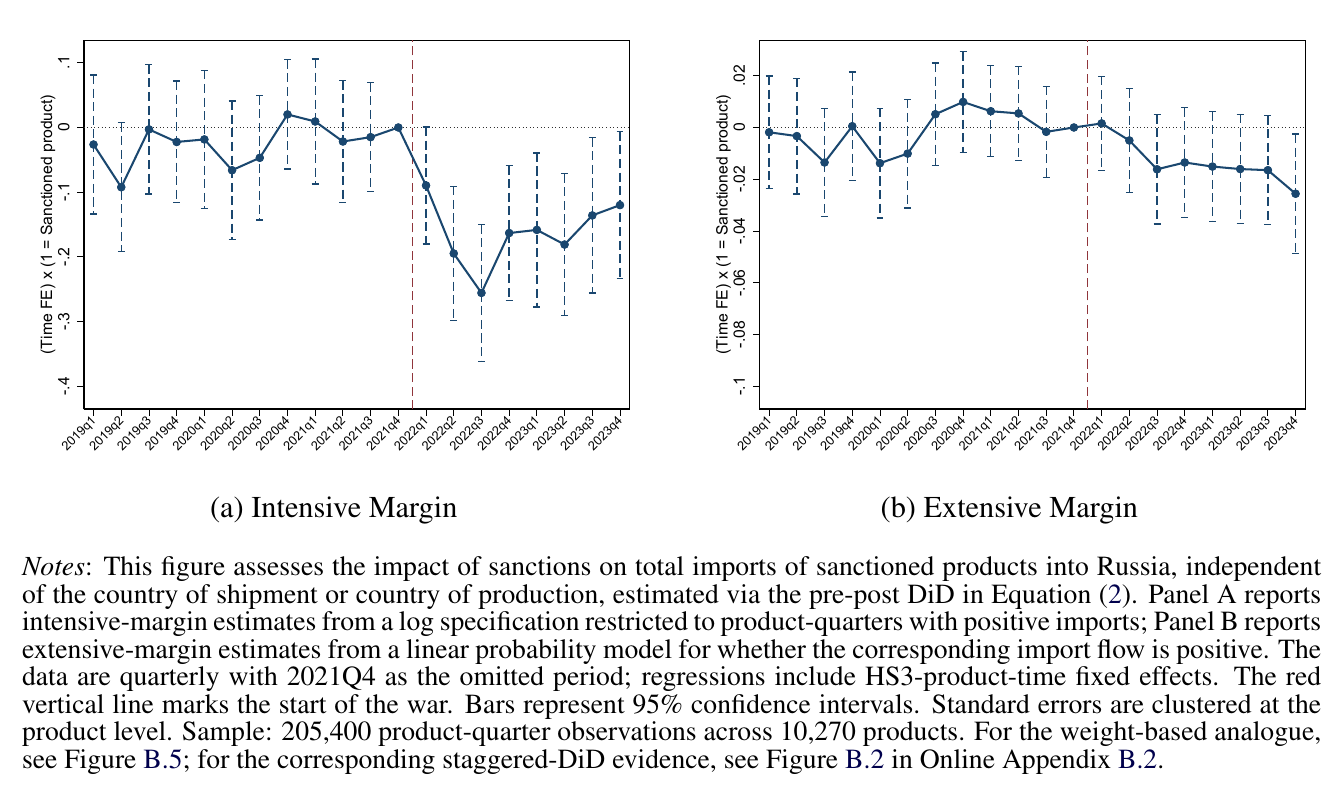
And the rerouting is not complete. Aggregate over every country of shipment and production, so that all you are asking is whether Russia got the product from anywhere, and imports of sanctioned products still fell relative to non-sanctioned ones in the same three-digit category, with no pre-trend. The picture is not a flat line, though. On the intensive margin the decline reaches 0.2 to 0.3 log points in 2022 and then partly rebounds, to about 0.12 by the end of 2023 — 12.9 percent on the pooled estimate — while the extensive margin, whether a sanctioned product shows up at all, keeps widening, to one or two percentage points by the end of the sample. Rerouting caught up on the goods that kept flowing and never caught up on the goods that stopped. The same decline appears in mirror data from un Comtrade at the six-digit level, which addresses — the paper’s word, and the right one — the worry that Russian customs files have gaps or that goods were relabeled across ten-digit codes inside a six-digit one. The back-of-the-envelope accounting is that friendly-country shipments offset about two-thirds of the direct decline: 135 billion dollars of a 208 billion dollar shortfall over 2022 and 2023. The remaining 72 billion is a real loss, worth roughly half a percent of real income a year by the Arkolakis–Costinot–Rodríguez-Clare (2012) formula (1.4 percent had there been no rerouting at all) — sizable against a full-import-autarky benchmark of 3.6 percent.
The disruption half, which is the point
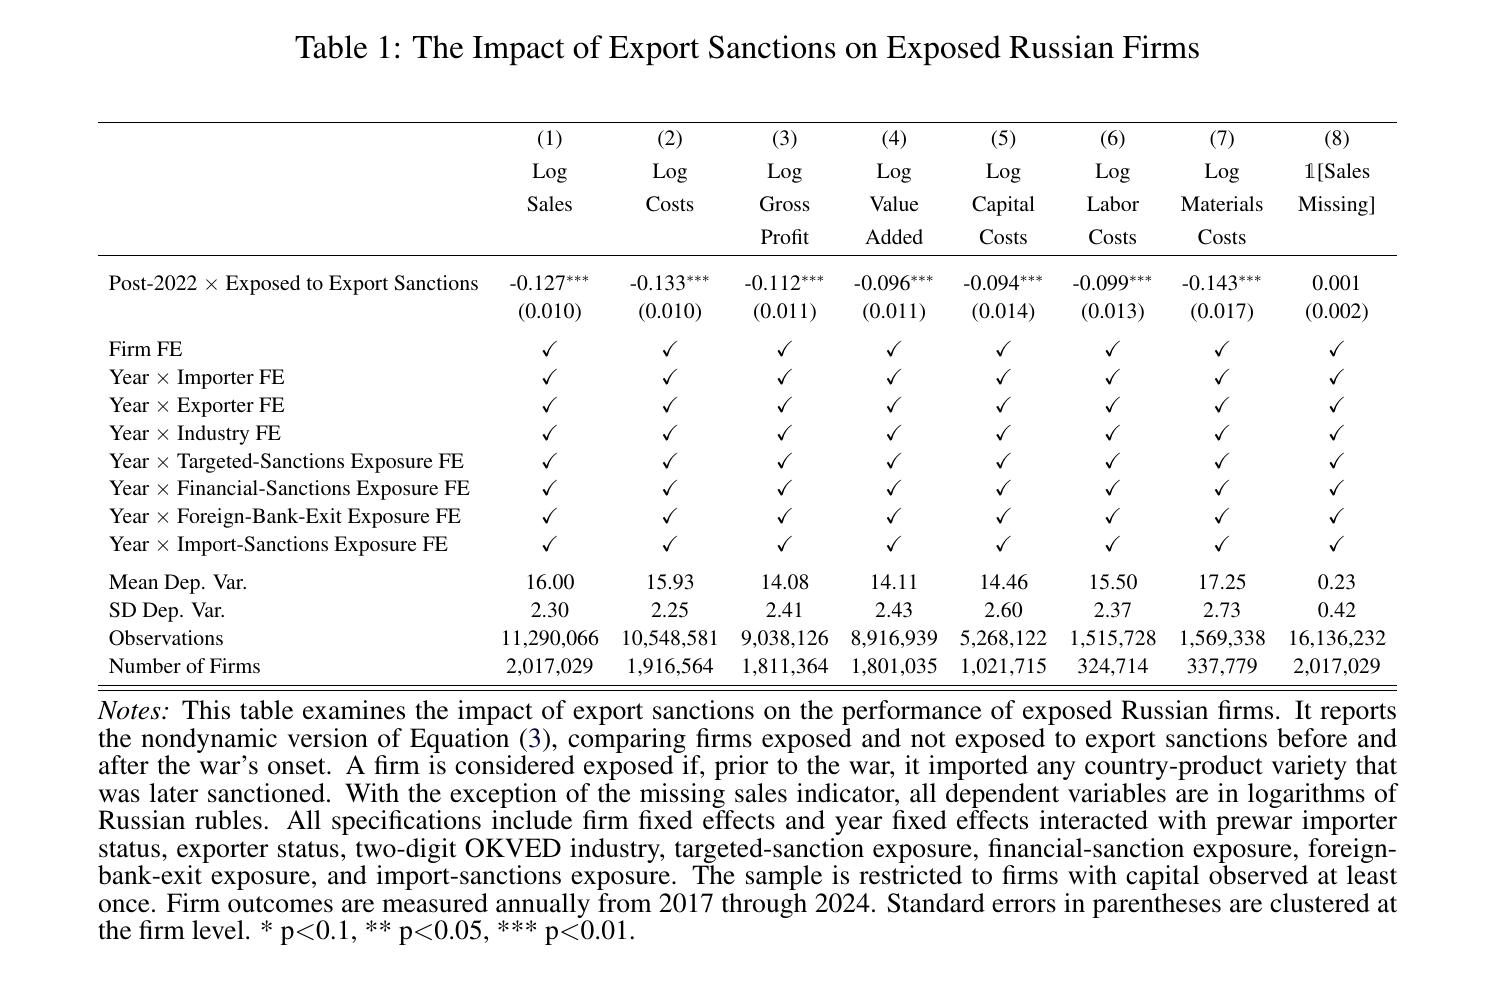
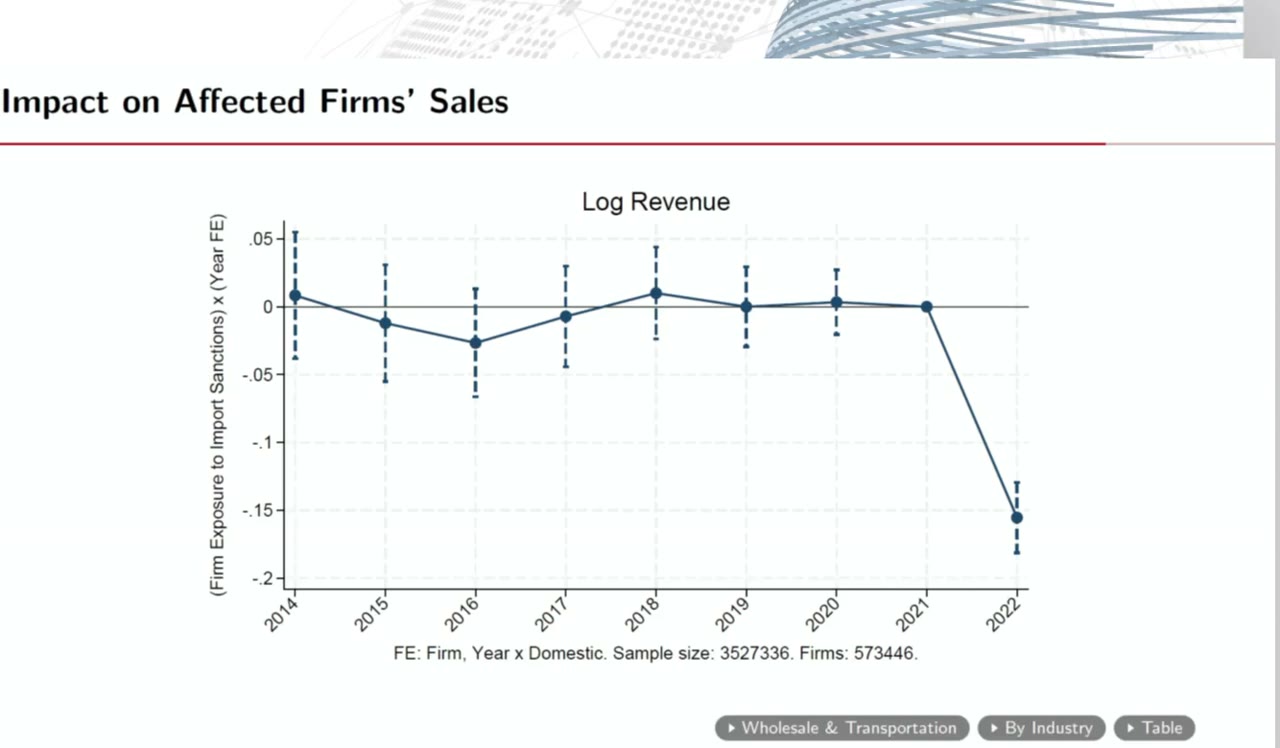
A third of the imports not arriving would not matter if Russian firms could substitute domestic inputs, draw on inventories, get state support, or obtain the goods through channels the customs data do not see. The firm data say they could not. Firms that had imported soon-to-be-sanctioned varieties saw sales fall 11.9 percent after the invasion relative to firms that had not, controlling for firm fixed effects and for year-specific paths by prewar importer and exporter status, two-digit industry, exposure to targeted firm sanctions, import bans on Russian goods, financial sanctions and the exit of foreign banks. And it does not fade: the year-by-year sales coefficient is about −0.13 in 2022, −0.155 in 2023 and −0.175 in 2024, which the paper reads as 13 to 18 percent — no recovery, and if anything a gap still widening two years in. (The 11.9 is the pooled estimate from Table 1.) Costs of goods sold, gross profit, value added, capital, labor and materials all fall by similar amounts, so it is a contraction in production and not an accounting artifact, and it holds in a balanced panel. The authors treat this as independent confirmation of the trade result: you cannot have persistent double-digit output losses at exposed firms if the inputs were quietly arriving at scale through some channel the customs data miss. Competitors and entrants did not pick up the slack. The losses reach manufacturing and technology firms, firms on the military supply chain, firms exposed only indirectly through their trading partners, and — a neat touch — firms that lost government procurement sales. Aggregated, the firm-side estimates imply cumulative value-added losses of 2.8 percent of counterfactual firm value added, about 1.3 percent of cumulative Russian gdp. Two different data sets and aggregation strategies, one conclusion: the micro disruptions were macro-sized.
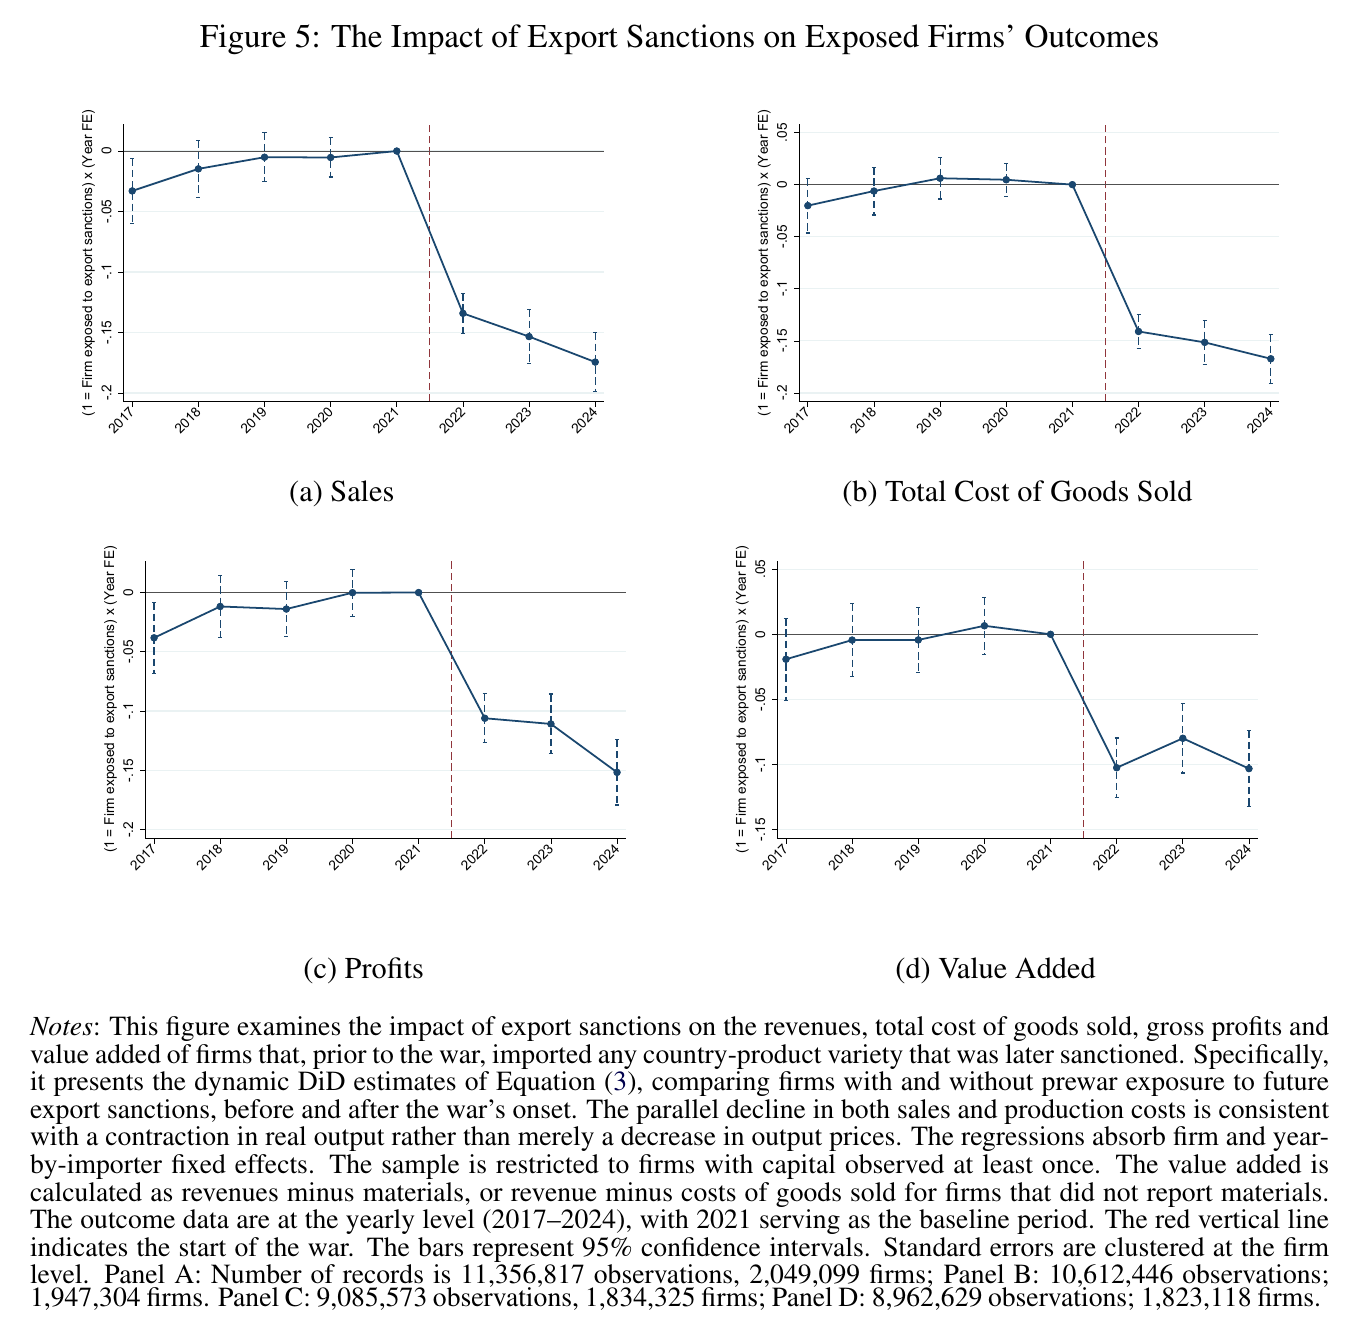
So the senators are right about the thing they measured and wrong about the thing they care about. Imports of sanctioned goods recovered substantially, largely through Western goods laundered through third countries; and the firms that depended on those goods are nonetheless a tenth or more smaller than they would have been, with the gap not closing in three years of data.
What the Kiel room said, a version and a half ago
Hinz’s discussion was that of a trade economist who had seen the paper four times and liked it: the contribution is simply having the inside-Russia data that everyone else proxies with mirror flows, exchange rates and headlines, and the result is “partial” rerouting that “should be emphasized” as partial. His complaints were technical and have mostly been absorbed. Trade sanctions were not the only sanctions: there are lists of named firms that Western companies may not deal with at all, and if those firms sit in the control group that is a problem (the current draft gives them their own year-by-exposure fixed effects). Do not add one to zeros and run ols — he credited Baldwin and Taglioni’s (2006) catalogue of “medal mistakes” for the point, and recommended Poisson pseudo-maximum likelihood without naming its authors on tape, though his slides do cite Santos Silva and Tenreyro (2006) — because in an embargo the zeros are the informative observations and should be allowed to be zero rather than one dollar. Control for what is happening at the origin-product-time level, which requires bringing in Comtrade for other destinations and turns the whole thing into a gravity equation with the right fixed effects. (Midway through he noticed the rerouting dummy was already sitting in that same equation, said “I misunderstood this,” and moved on.) And why aggregate to the country when the firm identifiers exist — are big firms, China-connected firms or state-connected firms better at rerouting? The current draft’s answer is Table C.4, and it is a better answer than “yes.” Large firms lose 8.0 percent against 17.7 for smaller ones; state ownership, the strategic-firms list and system-forming status make no measurable difference; and the firms that actually rerouted through friendly countries, before or during the war, lost the most. The paper’s reading is that rerouting was what the most input-dependent firms did, not what saved them. (The firm-product import regression with firm-quarter fixed effects in Appendix B.6 is the other half of the bridge: the decline in sanctioned imports shows up within importing firms over time, so it is not a story about which firms happened to be importers.) The paper still runs logs on positive flows with a separate linear-probability extensive margin, not ppml, and has no origin-product-time effects; those two points stand.
The concession that mattered came from the floor, and not from the presenter. Asked whether they observed flows inside the Eurasian Customs Union, a coauthor jumped in — “because I’m dealing with that in our group” — to say they did not, that Kazakh outgoing customs data had been purchased, and that “right now we don’t separate the two”: “whatever comes from a friendly country” was one bucket, a rerouted American product or something a friendly country made itself. The country-of-production decomposition is the single biggest thing that changed between that talk and the paper. The tape does not say which coauthor. Korovkin’s opening names only Nigmatulina as in the room, the same speaker later mentions having “another paper using financial statements”, which describes her earlier work on sanctions and misallocation, and Hinz addresses her by name about that work — so probably her, but the recording does not settle it and neither will I. The rest of the audience asked about conscription as a confounding labor shock (absorbed by industry-time effects, on the view that it does not hit exposed firms differentially), about whether the firm losses come from import or export sanctions (they control for export status; the focus is imports — “Germany forbids microchips”), about services (not in customs data; but “you can’t disguise a chip as a service”), and, from someone who had tried to read Russian energy companies’ post-2022 statements, about whether the financials are reliable. Korovkin said the disaggregated firm data are reliable as far as they can tell, with more checks to come; the same coauthor’s addition was the right answer: ask which direction any manipulation would run. A state firm has no reason to understate revenue, and overstatement works against the result.
The title change tells the story of the revision. “Trade Sanctions” was a paper about flows. “Export Sanctions: Rerouting, Disruption, and the Reach of Economic Warfare” is a paper that concedes the rerouting, two-thirds of it, and then shows that the reach of the weapon is measured downstream, on the factory floor, where a third of the inputs missing turns out to be enough.