Notes on:
Trade in the Shadow of War: A Quantitative Toolkit for Geoeconomics
Handbook of the Economics of Conflict, vol. 1, pp. 325--380
2024
geoeconomics · trade and conflict · gravity · quantitative trade
Paper · doi · PDF
Made with AI: Opus 5 (reading and writing)
Mathias Thoenig (Department of Economics, University of Lausanne, and cepr). Chapter 8 of the Handbook of the Economics of Conflict, vol. 1 (Elsevier, 2024), pp. 325–380. The published chapter is the version of record used here; it supersedes the 24 September 2024 draft, which it reproduces section for section and number for number under Elsevier’s volume-absolute pagination. No talk recording exists; pdf-only digest. The tables and figures below are cropped from the published chapter, four of the tables rotated because Elsevier sets them sideways on the page. Dedicated to Philippe Martin.
A handbook chapter that is really a method
Quantitative trade models evaluate policies as if the world were at peace. Thoenig’s chapter asks what changes if you drop that assumption: if tariffs, trade agreements and de-risking alter who depends on whom, they alter the cost of war, and so the probability that a dispute escalates, and a policy evaluation that stops at real consumption is missing a term. The chapter delivers that term. It takes the bargaining-under-private-information game of Martin–Mayer–Thoenig (2008), shows that its result holds across the whole class of structural gravity models rather than the Dixit–Stiglitz special case, attaches it to exact hat algebra, and computes for real country pairs a set of “geoeconomic factors” with names the reader should expect to see again.
The factors
Each country’s utility is log real consumption plus a geopolitical valence (an intrinsic taste for peace or for war, in consumption units) plus, for the leader only, a privately observed war shock. The opportunity cost of war is the log change in real consumption between peace and war (eq. 5, chapter p. 336),
computed by running a war counterfactual through the gravity model: belligerents lose productivity (, calibrated at 8 percent from Chupilkin–Kóczán 2022), lose population, and face higher trade costs bilaterally () and with the rest of the world (), with both trade-disruption numbers taken from Glick and Taylor’s (2010) gravity estimates for the two world wars and from nothing else — an 85 percent collapse in trade between belligerents and a 12 percent one with neutrals (chapter p. 349). Negotiation is Nash bargaining over a transfer of valence; because war shocks are private, negotiations fail with a probability that falls with the joint opportunity cost. Around that object the chapter defines the rest: the peace-keeping cost, what the country with the lower ocw must concede to keep the other at the table; the war-intensity mitigation, how much diplomacy raises wartime consumption relative to no diplomacy at all; the conditional probability of de-escalation ; and the pivotal valence of peace, the intrinsic taste for peace needed to make de-escalation certain. For symmetric high-intensity war the de-escalation probability reduces to eq. 28, chapter p. 347,
in which bilateral import shares raise the chance of peace and multilateral import shares lower it — the 2008 result, now a property of any structural gravity model with a ces import demand, and with , the dispersion of the war shock, as the fog of war.
The numbers for eight pairs
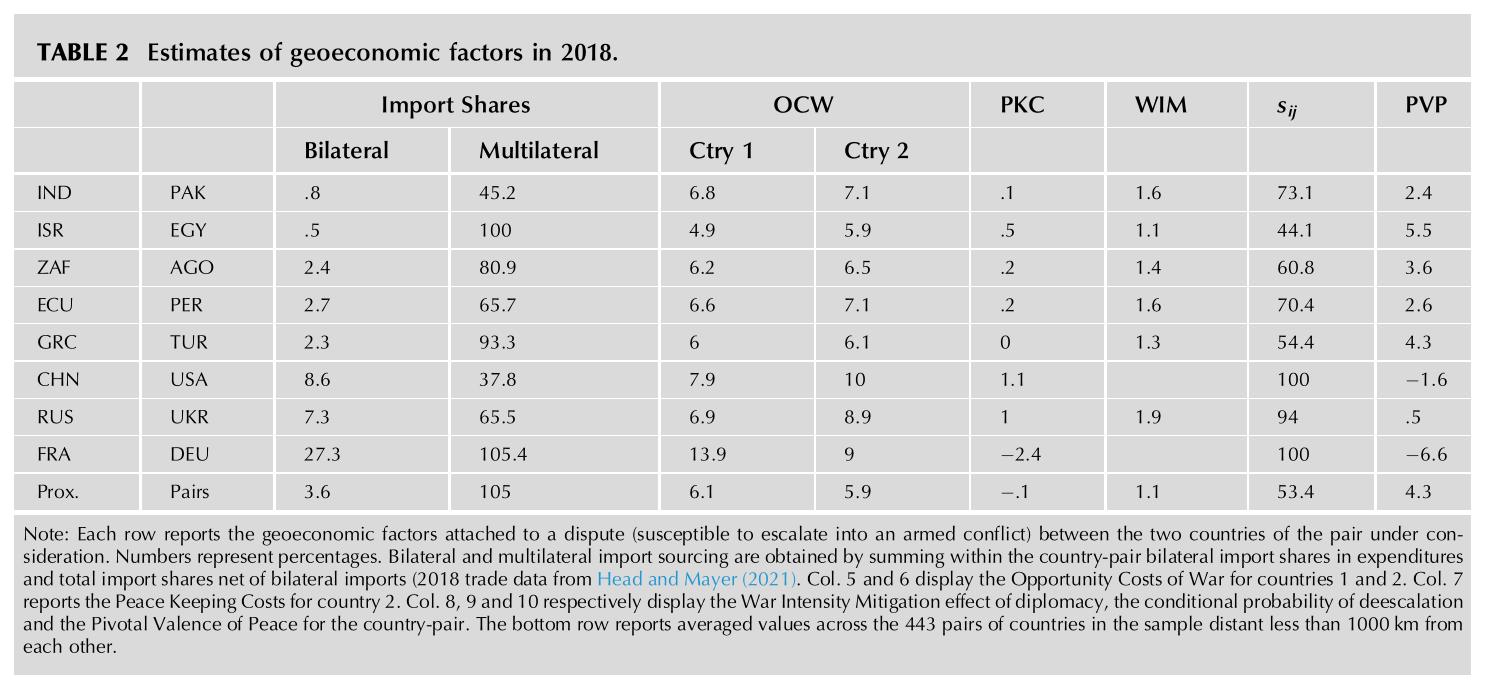
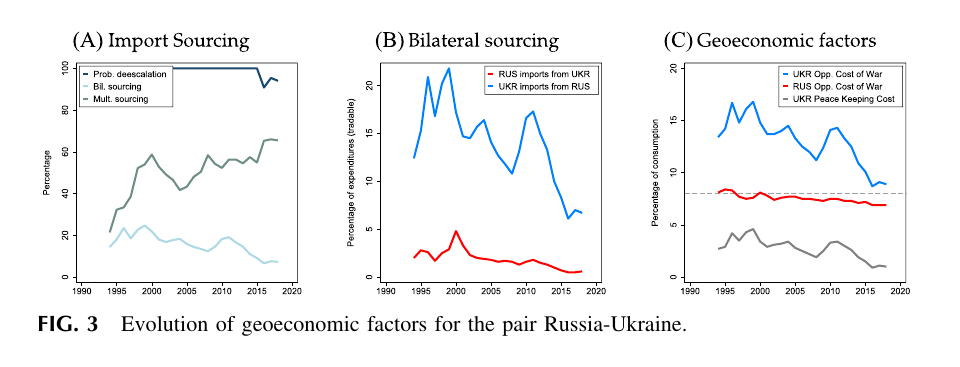
Opportunity costs of war run at 6 percent of real consumption for the average proximate pair, in the range of theory-free estimates of war-induced gdp losses, and at 14 percent for France vis-à-vis Germany, where bilateral sourcing is 27 percent of joint expenditure. France–Germany and China–usa settle every dispute in the model () and have negative pivotal valence — they would need an intrinsic taste for war of 6.6 and 1.6 percent of consumption respectively before fighting became possible. Greece–Turkey, Israel–Egypt and India–Pakistan, which trade little with each other and a great deal with everyone else, sit at de-escalation probabilities of 44 to 73 percent and need a positive taste for peace of 2.4 to 5.5 percent to be safe. Ukraine’s peace-keeping cost with Russia in 2018 was 1 percent of consumption: the concession implied by being the more dependent party. The time series for Russia–Ukraine (Figure 3) show that dependence, and with it the de-escalation probability, falling through the 2010s.
China and the United States, in Figure 4 on chapter p. 354, are the mirror image: bilateral dependence rose sharply after China’s wto accession in 2001, de-escalation has been certain ever since, and the us peace-keeping cost, negative until 2000, turned positive that year and has climbed since — peace, but on Chinese terms.
Policy in the shadow of war
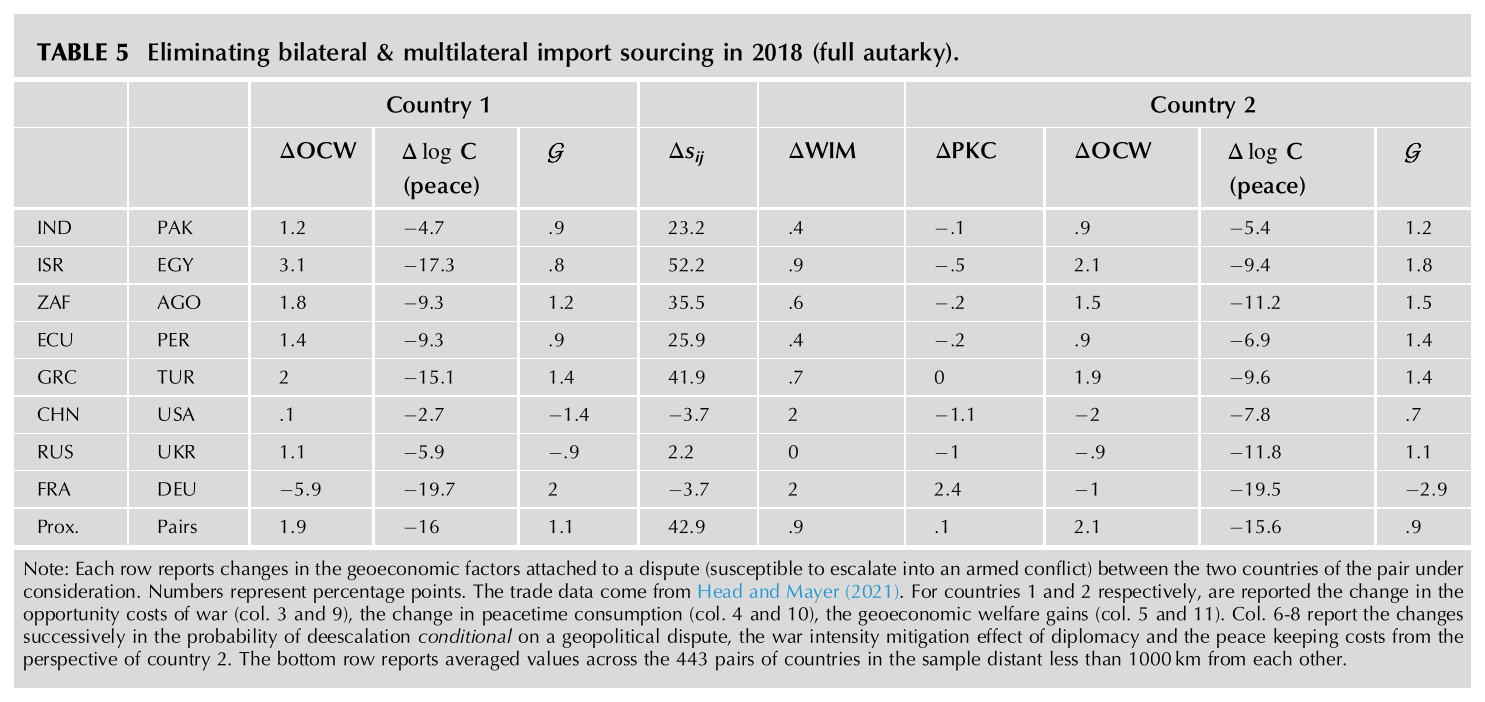
Section 5 is the part the list is here for. The welfare effect of a trade policy becomes (eq. 33, chapter p. 364) the usual peacetime gain plus a geoeconomic term (eq. 34, same page) that collects how the policy moves each country’s ocw, its peace-keeping cost, and the de-escalation probability, weighted by how likely war was to begin with. Three illustrations. Full autarky for the disputing pairs costs the average proximate pair 15.8 percent of consumption but raises its de-escalation probability by 42.9 points, because multilateral sourcing collapses more than bilateral sourcing; the geoeconomic gain of about 1 percent is real but small next to the trade loss, and for France–Germany and China–usa even the sign flips.
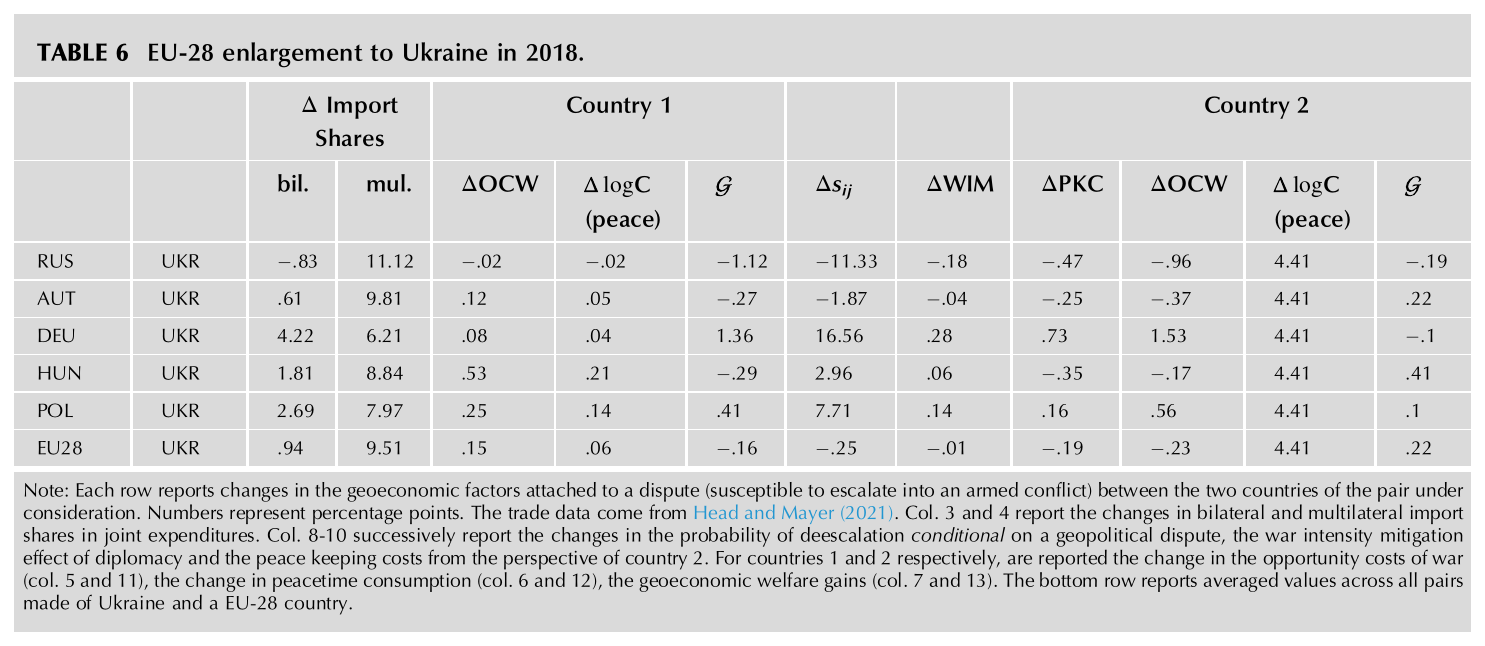
Ukrainian accession to the single market in 2018 would have raised Ukraine’s consumption by 4.4 percent and cut its dependence on Russia, which lowers its opportunity cost of war with Russia by about a point, cuts the concession it must make, and lowers the de-escalation probability by 11 points — a geoeconomic loss of about a fifth of a point, swamped by the consumption gain but not zero. With Germany and Poland the integration effect runs the other way.
The third illustration, Section 5.5 on chapter pp. 371–373, is the one worth carrying away. Suppose every country other than Russia commits, credibly and in advance, to raising trade barriers against Russia in the event of a war, at the same severity the war itself would have imposed. The de-escalation probability then goes to 100 percent for every pair involving Russia — Ukraine up from a factual 94.05, Poland from 73.4, Germany from 70.89, the United States from 69.99, with China already there. Nobody’s own opportunity cost of war moves at all, because the threat points elsewhere; what moves is Russia’s, up by 9 to 11 points, and that is the thing buying the peace. Russia also pays for it, taking a geoeconomic welfare loss of 4.4 to 6.1 points while each country on the other side gains 4.4 to 5.5. This is the chapter’s central asymmetry at its sharpest: the same rise in the opportunity cost of war that makes war unlikely is the rise that weakens you at the bargaining table, and here the whole of it is loaded onto one country. Thoenig writes that credible and pervasive sanctions could have fully prevented the risk of a high-intensity war involving Russia, and then, without pausing, gives the two reasons not to believe it — commitments of that kind are rarely credible, and participation is never universal.
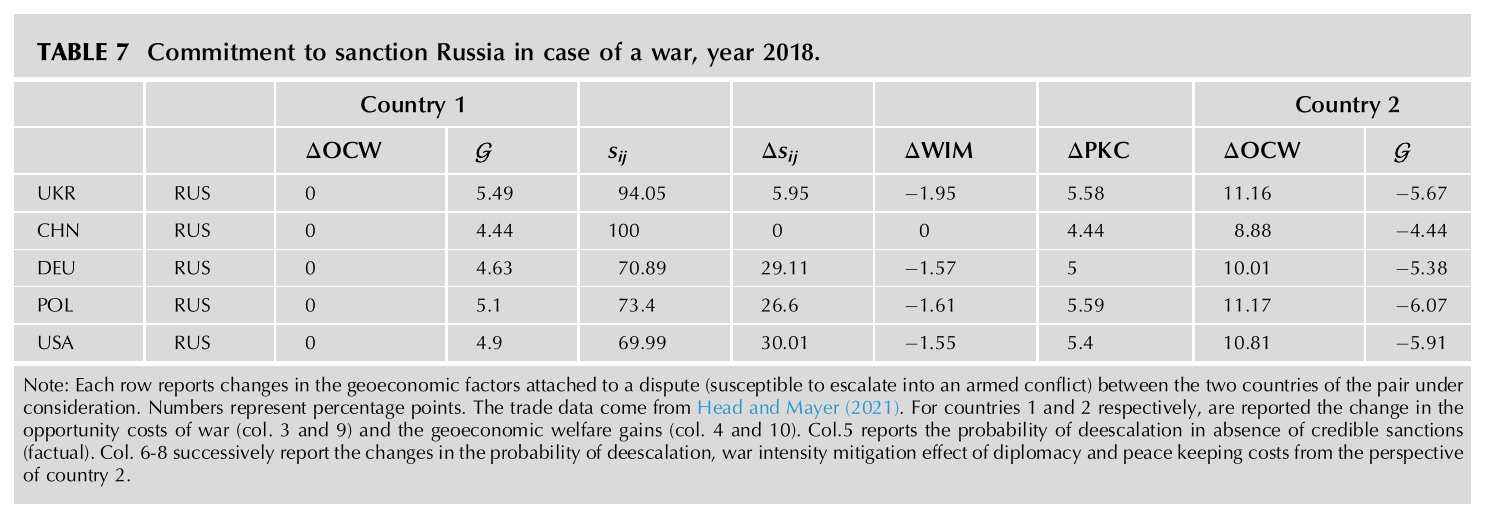
Thoenig presents all of this as a demonstration of method rather than a policy result, and lists what the approximation omits: wage changes in war, intermediates, sectoral heterogeneity and the critical inputs that make some sectors’ elasticities low. The companion paper that does it properly is Mayer–Méjean–Thoenig’s (2025) Fragmentation Paradox.
The survey half
Section 4 organizes the empirical literature since 2008 around the same objects: how the geographic structure of imports (the chapter’s acronym gis) predicts militarized disputes, the endogeneity of trade and war that separates the first generation of these regressions from the second, the cost of conflict containment, and firm-level evidence on trade during hostilities. Section 5.4 turns to the reverse question, trade agreements as security policy — Schuman’s “materially impossible” war — and to the political-acceptability constraint that keeps former enemies from trading.
Where it sits
Context in 2.5, and the bridge the sub-block needed: a trade economist who runs Caliendo–Parro (2015) counterfactuals can read Sections 3 and 5 and know exactly where the conflict stage goes and what parameters it needs. It is also the chapter that turns Martin–Mayer–Thoenig’s sign result into a general-equilibrium quantity with a name, which is what the Fragmentation Paradox (1.3), Kooi’s (2025) resilience model and Becko–O’Connor’s (2025) peacetime trade policy each reuse in their own notation. It stays context rather than presented because it is a handbook chapter whose original results are illustrative by the author’s own account; the presentation slot belongs to the companion paper that carries them through.