Notes on:
Working with AI: Measuring the Applicability of Generative AI to Occupations
arXiv:2507.07935
7 May 2026
generative AI · labour markets · occupations · measurement
Talk · Paper · doi · PDF · Transcript
Made with AI: Opus 5 (reading and writing)
Part of AI and Economic Measurement, Spring 2026
Kiran Tomlinson, Sonia Jaffe, Will Wang, Scott Counts and Siddharth Suri (Microsoft Research), “Working with ai: Measuring the Applicability of Generative ai to Occupations.” Presented at the nber conference on ai and Economic Measurement, Stanford, 7 May 2026; discussant Kristina McElheran (University of Toronto), who took all three papers in the session together. Written from the arXiv draft, most recently revised 22 December 2025.
Here is a conversation. A user pastes a command-line error message into Bing Copilot. Copilot replies with instructions for editing a configuration file. Now: what job was just done?
The honest answer is that two jobs were done, by two different parties, and they are not the same job. The user was resolving a computer problem. That is an activity that, in the U.S. Department of Labor’s occupational taxonomy, belongs to programmers and system administrators. The ai was advising others on the use of technologies and explaining technical details of products — which belongs to it and technical support workers. One conversation, two occupations, and neither of them is “the user’s job.”
This is the load-bearing idea in the paper, and it is the sort of thing that seems obvious once stated and then quietly wrecks a decade of measurement. Every prior estimate of ai exposure asks a single question — could a model do this job? — and answers it with a prediction. Frey and Osborne (2017) asked machine-learning researchers. Felten, Raj, and Seamans (2018) aligned benchmark progress to occupational abilities. Eloundou and coauthors (2024) used human raters. Tomlinson and his coauthors instead asked what people are already doing, and got two answers per conversation instead of one. As the speaker put it, the literature’s proxies were “alignments between ai benchmarks and occupational tasks or patents,” and “our thinking was to use our observations of what people are using ai for to get more real-world-grounded ai exposure metrics.”
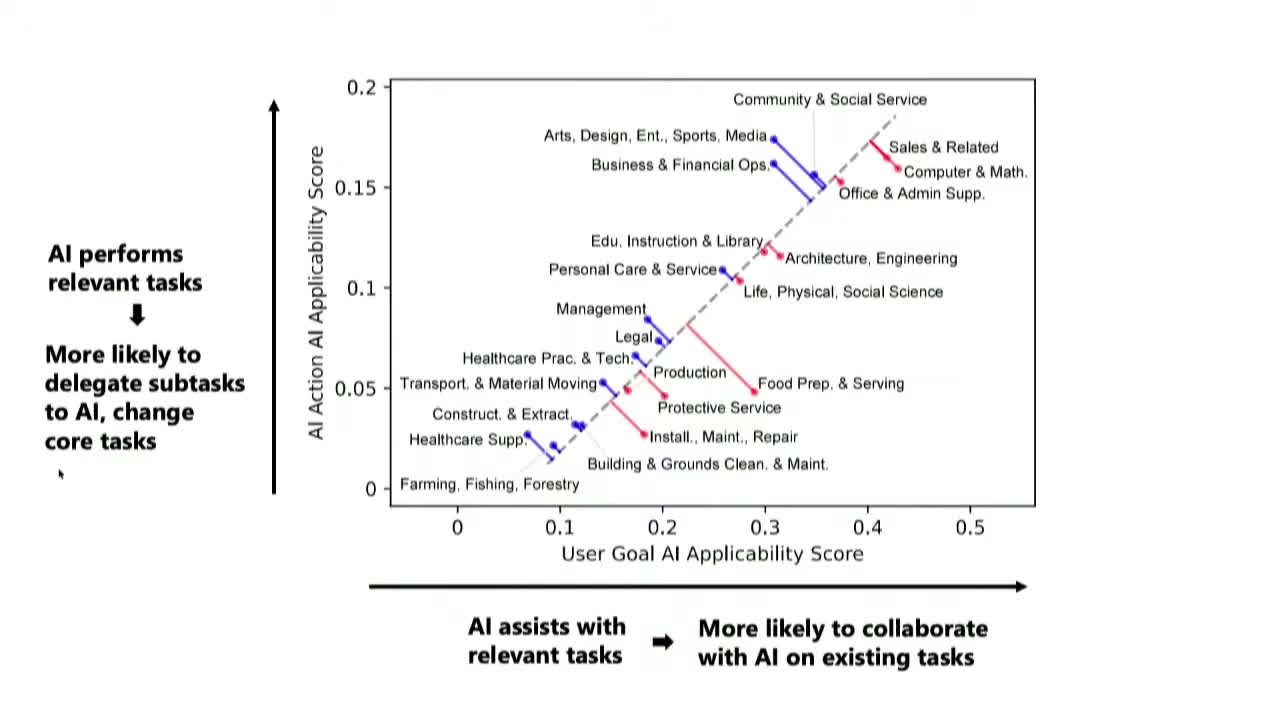
So the two-sided split gives you a cleaner economic object than the usual “exposure.” The user-goal side measures the work ai assists with: you are still doing your job, with a machine at your elbow. The ai-action side measures the work ai performs: the work of some third party you would otherwise have gone to. The helpdesk. The tutor. The copywriter. That is not a metaphor; it is what the classifier is literally scoring.
The machinery. About 200,000 anonymized, privacy-scrubbed U.S. Bing Copilot conversations from 1 January to 30 September 2024 — roughly 100,000 drawn uniformly, plus 100,000 drawn only from conversations that got a thumbs up or down. Each conversation is mapped, on both sides, into o*net’s 332 intermediate work activities, which are deliberately cross-occupational: “Edit written materials or documents” is done by editors and lawyers and marketers alike. (The competing Anthropic study of Claude conversations (Handa et al. 2025) assigns each one to a single occupation-specific task, which forecloses exactly this inference. The paper says so, politely.) A gpt-4o pipeline summarizes each side in o*net’s house style, embeds it, ranks all 332 activities by similarity, and then does binary match/no-match on every one of them. The average conversation comes out with 2.88 user-goal activities and 6.63 ai-action activities.
Then three success measures: real thumbs feedback, an llm judgement of whether the task was completed, and — the clever one — scope, a six-point rating of what fraction of all the work in that activity, across all occupations, the model could do given only the capability it just demonstrated. Scope is what stops one limerick from certifying the model as a novelist.
Roll it up and you get, for each occupation, equation (1) in the paper:
where is occupation ’s user-goal applicability score, the indicator switches on only if activity makes up at least 0.05% of Copilot activity, is the completion rate, the share of conversations at moderate-or-better scope, and the o*net importance-and-relevance weight of that activity within that job. In English: an occupation’s score is the share of its work — weighted by how much that work matters to the job — that people are demonstrably already bringing to a chatbot, getting finished, and getting finished across a decent chunk of what the activity actually involves. The ai-action score is defined the same way, except its weights exclude tasks a classifier labelled as requiring touching or moving people or objects.
What comes out. Information work, everywhere. The activities that succeed are communicating, teaching, explaining, writing; the ones that fail are image generation and data analysis. Scope correlates with log activity share at 0.64 on the user side and 0.54 on the ai side, which the authors read as users having already found the activities where the model’s reach is broadest. And ai-action success sits consistently below user-goal success: the model can help with a broader slice of your work than it can do outright.
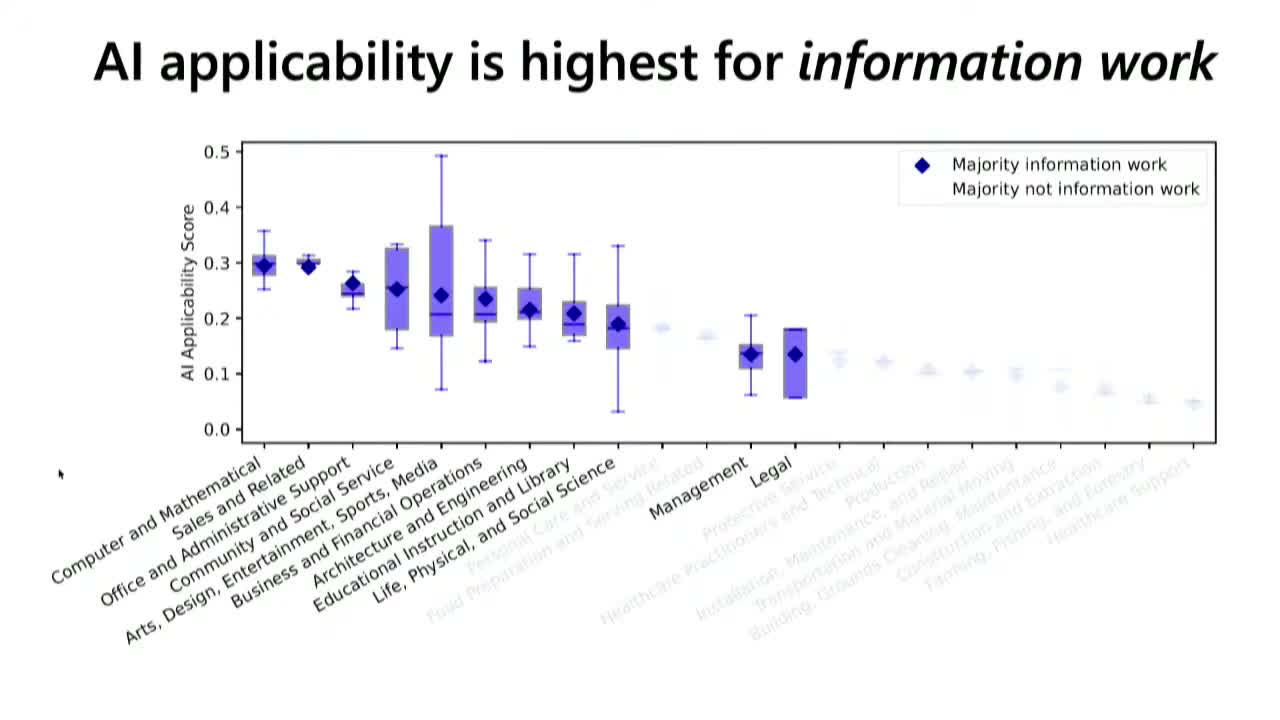
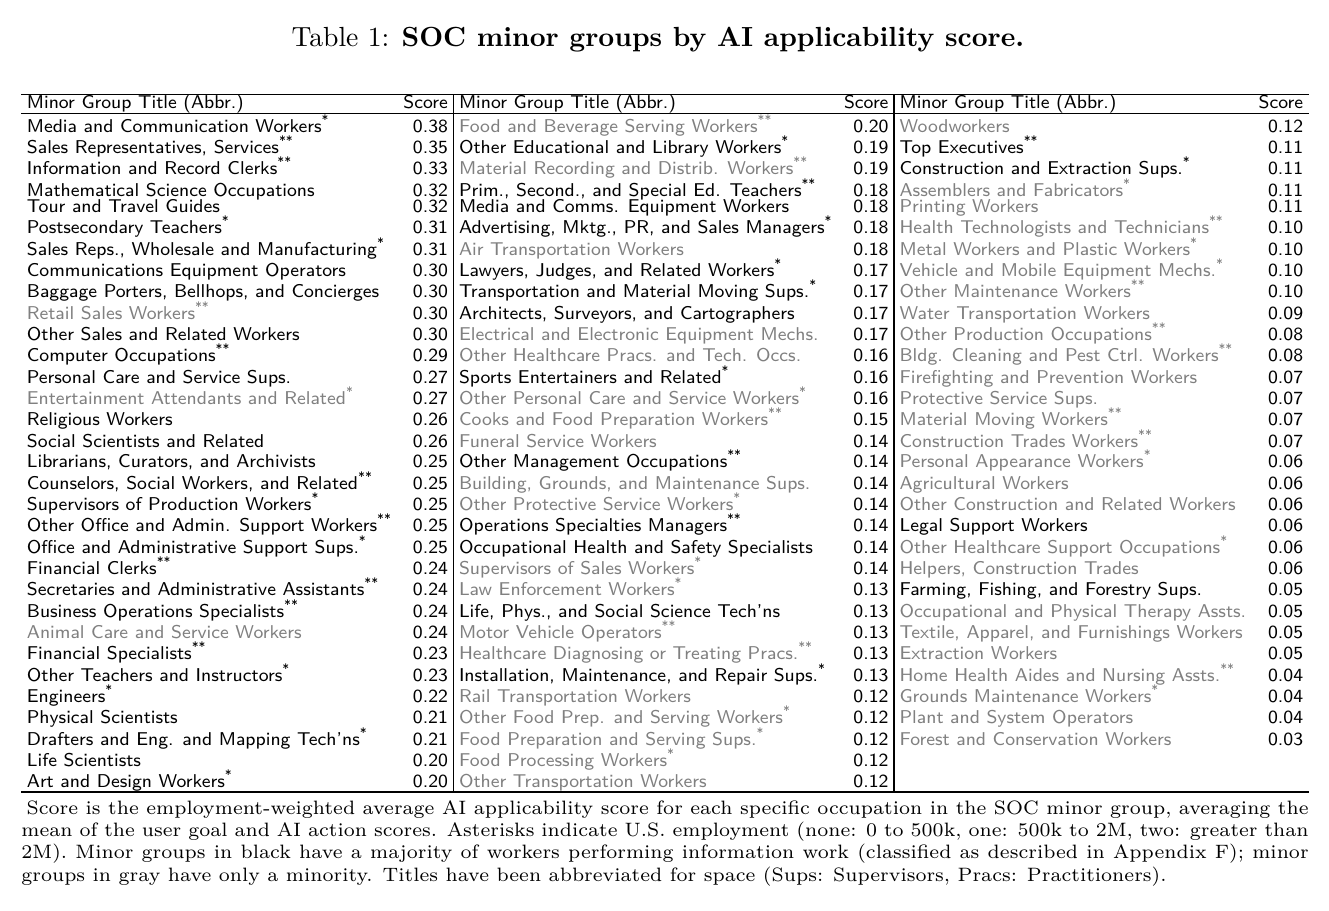
At the level of the 93 soc minor groups, Media and Communication Workers top the table at 0.38, then Sales Representatives (Services) at 0.35 and Information and Record Clerks at 0.33; Forest and Conservation Workers come last at 0.03.
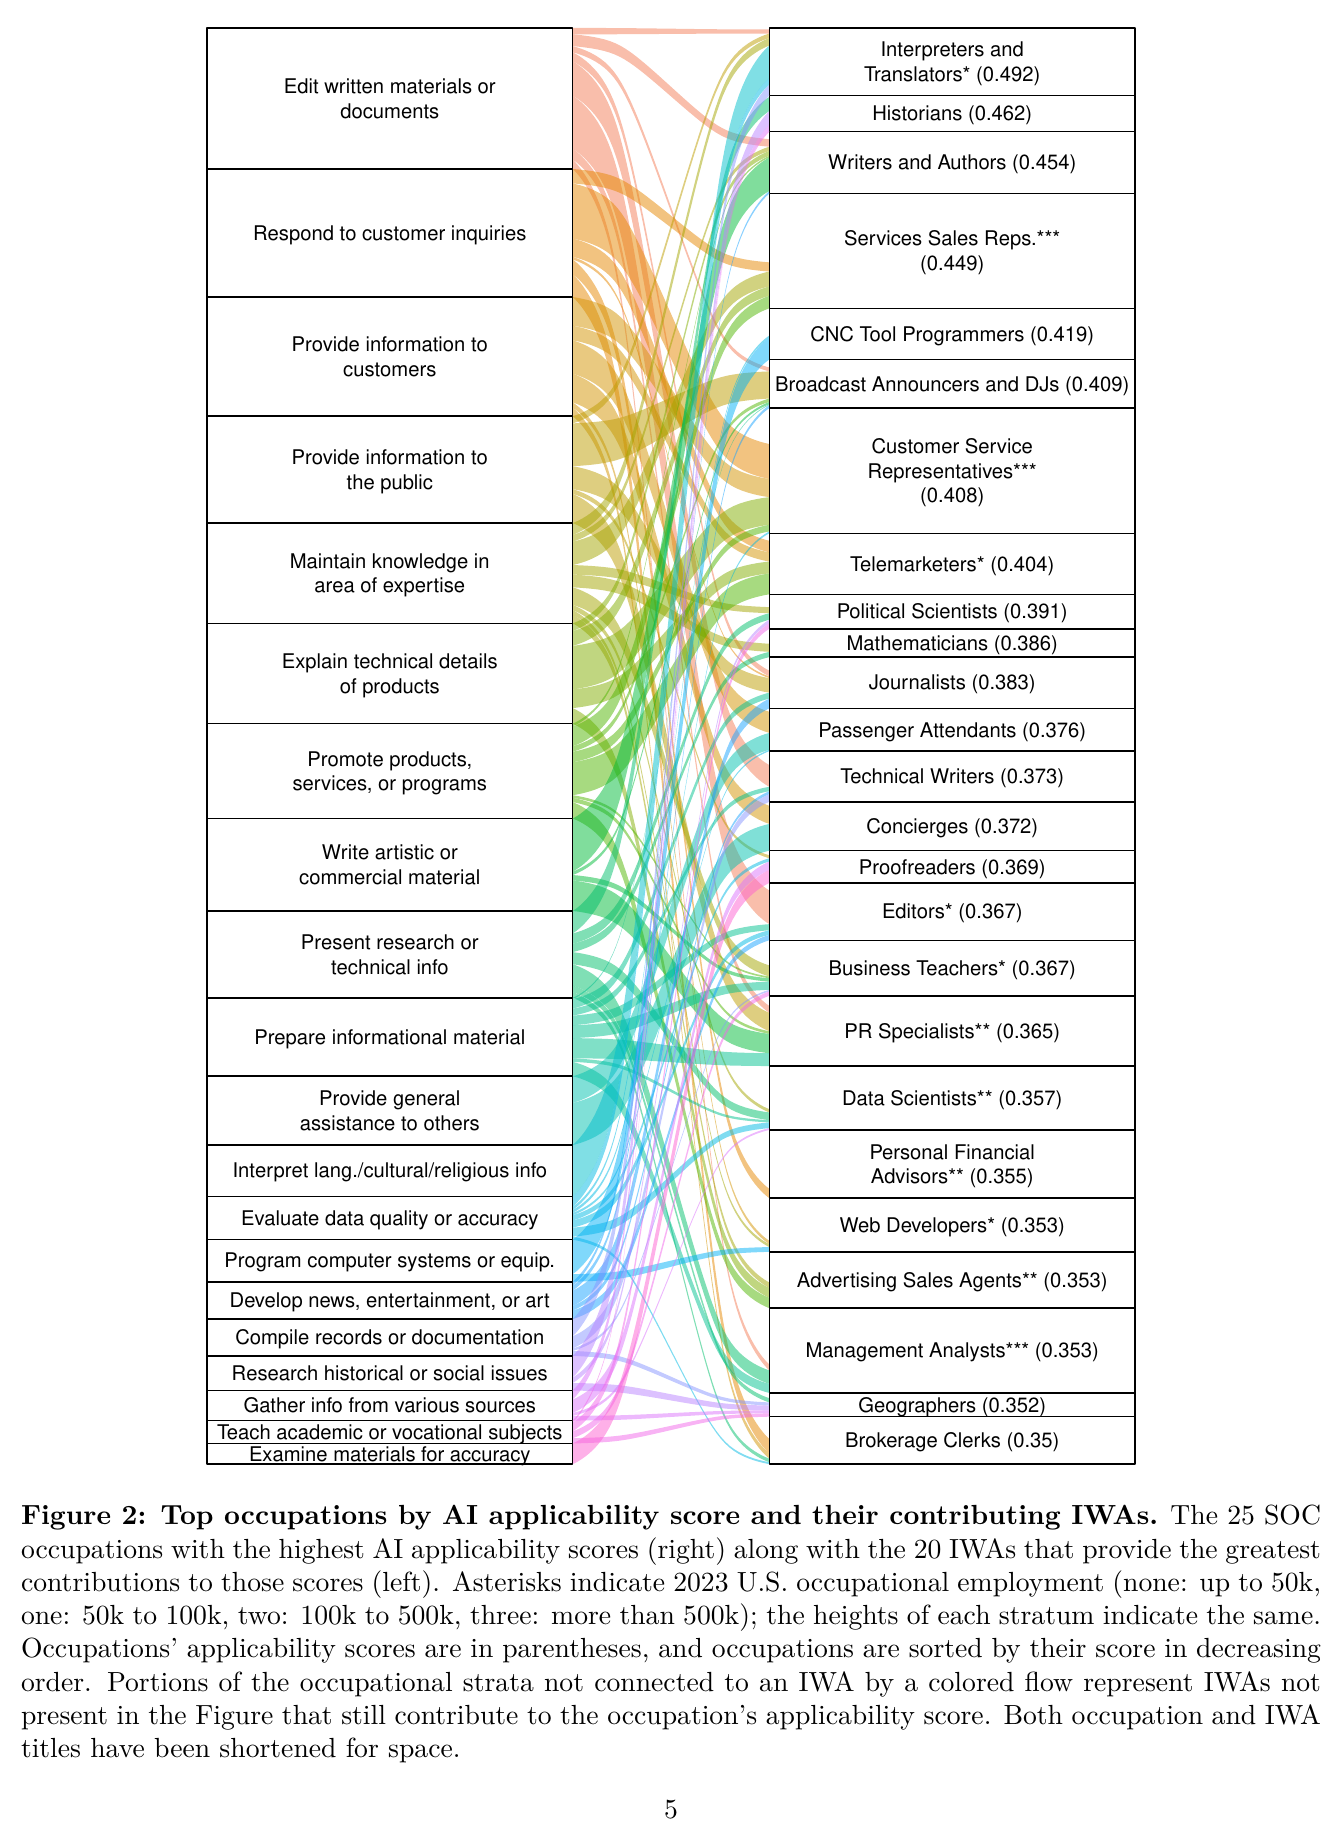
Individual occupations rank about as you would guess until they don’t: Interpreters and Translators 0.492, Historians 0.462, Writers and Authors 0.454, Services Sales Reps 0.449 — and then, fifth in the entire economy, Computer Numerically Controlled Tool Programmers at 0.419, which reads blue-collar and turns out, in o*net’s decomposition, to be mostly writing and checking instructions. The single activity contributing most across the top 25 is “Edit written materials or documents.”
The two sides really are different. The user-goal and ai-action activity sets are completely disjoint in 40% of conversations, and in 96% there are more activities unique to one side than shared. Per work activity the user brought, the ai performs two. The most lopsided cases are wonderful: “Purchase goods or services” appears 118 times more often as something the ai is assisting with than performing, “Execute financial transactions” 59 times, “Perform athletic activities” 47 times. In the other direction, “Train others on operational or work procedures” runs 18 times more often as an ai action. The speaker’s gloss on the assisted-but-not-performed pile: “these are things where people are getting ai advice for, but the ai is not connecting lines to each other.” A 2024 chatbot will happily talk you through a wire transfer and will not, under any circumstances, make one. He notes this could flip once agents get tool access, which is the most quietly consequential sentence in the talk.
Now the surprising part. Line these scores up against Eloundou et al.’s human-rated exposure and you get an employment-weighted occupation-level correlation of 0.73 — the new instrument broadly agrees with the old one. Line them up against wages and the agreement collapses. Employment-weighted, the correlation between ai applicability and average occupational wage is 0.13, or 0.19 dropping the top decile. Split it: 0.05 on the user-goal side, 0.26 on the ai-action side. The entire prior literature found ai exposure climbing steeply with pay.
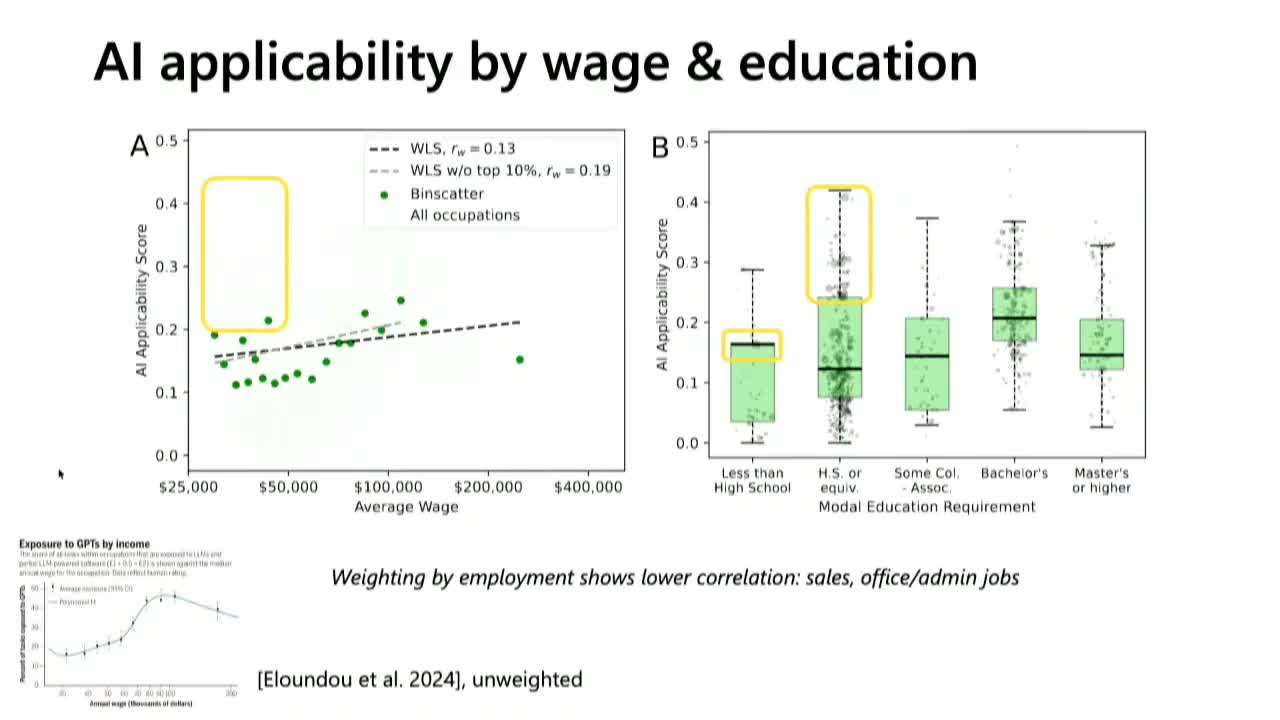
It isn’t noise. It’s composition, and the composition is enormous. Customer Service Representatives: 2.86 million workers, score 0.408. Services Sales Reps: 1.14 million, 0.449. Office and Administrative Support as a whole: 18.16 million workers, group score 0.26, against Healthcare Support’s 7.06 million at 0.05. “This is driven by some low wage, low education requirement occupations that are very large and that have high ai applicability,” the speaker said, “and these are clustered in sales and office and admin support.”
And then the knife twist. Drop the employment weights and the correlation climbs back to 0.17 on the user side and 0.32 on the ai side — roughly the old finding. Which is to say a chunk of “ai hits high-wage work” may be an artifact of counting occupations rather than workers. Why does that matter so much? Because occupation boundaries are a bureaucratic accident. Cooks are split into Fast Food, Restaurant, Institution and Cafeteria, and Short Order — four data points. Maids and Housekeeping Cleaners are one. An unweighted regression treats those five as five equal observations and does not notice that one of them contains 836,000 people. A finding that reads like an economic law turns out to be partly a fact about how the Standard Occupational Classification chops things up.
The paper is unusually honest, which is worth noticing given who wrote it. These are Microsoft Research employees measuring Microsoft’s product; the aggregates are public and the disclaimers are more prominent than the results. Three of the authors hand-labelled 195 conversations and report that they agreed with each other at Cohen’s κ of 0.41 to 0.58, and with the pipeline at 0.34 to 0.53 — moderate, and reported as such. Scope agreement is worse: human–human within-group agreement ranges 0.12 to 0.66, human–llm 0 to 0.49, with mean absolute error around 1.1 on a six-point scale where random guessing gives 1.94. And in the single best act of preemptive self-sabotage in the genre, the authors show that by moving the usage threshold from 1% of chat activity to 0.01%, you can conclude that either ~0% or ~100% of the workforce has half its importance-weighted tasks represented in the data. The rankings are stable across three orders of magnitude of threshold. The headline percentage is not, so they decline to produce one. Onstage, unprompted, the speaker flagged that the measures “are not indicative of what occupations ai is likely to replace” and name-checked a Washington Post article about the paper as the reason he was saying so. (The paper’s version of the argument is the atm (Bessen 2026): automating the bank teller’s core task raised the number of teller jobs, because branches got cheaper to open.)
The discussion, and its absence. McElheran discussed all three session papers in one nineteen-minute block, and her theme was the level of analysis. “One of the things that you have to start looking for when you’re consuming all of this literature is where the word occupation, where the word tasks, and where the word jobs come in, because they don’t always mean the same thing.” Her exhibit was Frey and Osborne’s 47%-of-jobs-at-risk versus Arntz, Gregory, and Zierahn (2016), who ran the same machinery on survey data about what workers actually do in their jobs and watched the number fall from a baseline of 38% to 9%. Her verdict on the state of the field: “we have built this edifice of thinking about exposure and worker implications that is all on this one narrow and I’m going to use Claude’s favorite term load-bearing column of o*net data at the occupation level.” Aimed here specifically: “there’s a lot of places where the sleight of hand happens and we think we’re talking about workers, but we’re actually talking about tasks in occupations.”
On this paper’s signature move she was warm and unconvinced: “I think this user goal versus ai action is distinctive and conceptually novel, but I wasn’t entirely sure what to do with it.” Her most actionable ask was statistical — “some of these things are within the confidence interval and I think you probably want to do some bootstrapping” — and she is right that no ranking in the paper carries an interval, which sits awkwardly beside a scope classifier whose human agreement bottoms out at zero. She also wanted the wage mechanism rather than the coefficient. And she delivered, as a joke, the sharpest thing anyone said all session: “now we’re going to have ai classifying o*net stuff so we can use the ai-generated o*net data to study ai. That’s going to be an interesting circular thing here.” The paper’s own footnote reports “strong evidence that gpt-4o includes o*net data in its pretraining corpus.” The classifier has read the taxonomy it is being graded against. The authors treat this as a convenience.
Here is the honest part about the exchange: there wasn’t one. Some of these points already have standing answers — the applicability-is-not-replacement disclaimer came about forty-five minutes before her remarks, and Appendix G lays out the employment-weighting mechanism she asked for — but the authors never responded on the record. The general Q&A went almost entirely to the other two papers in the session; the chair explicitly asked for questions on the Microsoft paper and the Bick adoption survey (Bick et al. 2026), and the next question went to the ai-interviewer field experiment anyway. The one moment that brushed this paper came from a questioner the chair seemed to call Harry (the caption is unreliable and no surname was given), who said community colleges training people for health care and it jobs “are terrified about all this. All of them are. So given the state of the knowledge, given the state of the data, what’s the best thing we can tell them?” McElheran took it, not the authors, and answered from her own work on older workers displaced by earlier technology waves: a bifurcation is coming between people comfortable with the tools and people who are “scared, they don’t understand it, they don’t like it, they don’t like how it was trained,” and the latter are at real risk of being left behind.
The talk also carried one result not in the December draft: recomputing everything month by month across the nine-month window shows the entropy of the activity distribution rising through 2024, with applicability scores rising alongside it — people spreading their usage out rather than concentrating it. The slide said “Over 6 months.” The speaker corrected it live: “this is a typo. This should say nine months.”
Which leaves the thing everyone in that room already half-knew. This paper’s most quotable finding — the wage correlation that vanishes — is a finding about weighting. Its most careful contribution is a refusal to publish the number that would have gotten it cited most. And the instrument doing the measuring learned the taxonomy from the same internet it is now being asked to score.