Notes on:
A Quarter of US-Trained Scientists Eventually Leave. Is the US Giving Away Its Edge?
Working paper (arXiv 2512.11146)
2 October 2026
scientist emigration · STEM PhDs · brain drain · patent citations
Talk · Paper · doi · PDF · Transcript
Made with AI: Haiku 4.5 (research), Opus 5.5 (reading and writing), Fable 5.1 (adjudication), Sonnet 5.5 (verification)
Part of Economics of Talent Conference, Fall 2026
Authors: Dror Shvadron, Hansen Zhang, Lee Fleming and Daniel P. Gross
Presented by Dror Shvadron at the nber Economics of Talent Conference, Cambridge ma, 2 October 2026 (video). No discussant.
Paper version: arXiv 2512.11146v1, December 2025. The talk ran on a newer build of the data than that draft, so below, numbers are marked as coming either from the slides or from the December draft.
The talk opened with a number from the Chinese Ministry of Education, by way of The Economist: 94% of Chinese students return home after their studies (02:45:04). Shvadron then asked the obvious follow-up: “If that’s the case then we might as well ask, you know, why are we funding them?” The paper answers two questions. Do they actually leave? Mostly not, or at least not for a long time. If they do leave, does the us lose what it trained? Less than you’d think, though the reason the us keeps the value isn’t really about the scientists.
Almost all of the talk was spent on the first question. The second is the one in the title, and it got a single bullet on the last slide. This note gives it more space.
How you count people who leave
The us has never had a good way to answer this. The Survey of Earned Doctorates catches graduates at the moment they finish and records only whether they intend to stay. The Survey of Doctorate Recipients follows roughly 10% of past graduates with a response rate around 65%. Response is worse among graduates living abroad, which is a problem when they are exactly the people you’re trying to count. Neither survey can be linked to what the graduates later publish.
So the authors build their own panel. They start with dissertations: about 800,000 us Stem PhDs from 1980 to 2019 in ProQuest, which tracks the sed census closely. Then they link each dissertation to the author’s later publications in OpenAlex and read off where the person is from the affiliations on those papers. The linking is the hard part. Blocking on names leaves about a billion candidate pairs, and the hardest names to tell apart are East Asian ones, “which is exactly the population that we’re after in this project” (02:49:33). The ground truth comes from orcid, where scientists list their own degrees and papers, and the linker is trained on that.
The two versions build the linker differently. In the December draft, a deep neural network proposes links and a second network acts as a precision filter that throws links out (23.0M down to 15.1M at scale). End to end it reaches 96.9% precision and 86.1% recall on the orcid validation set. On the slides, with the newer build, boosted trees find high-confidence “anchor” papers and a second stage expands from those anchors using co-citation and co-authorship. That gives 17.2M links for 1.11M graduates, with 98.4% precision and 88.8% recall. The newer build also adds career profiles from Revelio (LinkedIn) “to cover also people who are not publishing” (02:48:52), and it scrapes university repositories, so the dissertation base grows to about 1.05M core graduates for 1980–2025.
The draft spells out how a link becomes a migration. A year counts as foreign if the graduate’s foreign-affiliated papers outnumber their us-affiliated ones. Migration requires two consecutive foreign years, using links with match probability of at least 70%. Checked against orcid employment histories, that rule has an F1 of 0.829. The talk never stated its rule, and it never said how a LinkedIn location becomes an “abroad” call.
The phrase to keep in mind is the abstract’s: “25% of scientifically-active, us-trained Stem PhD graduates.” Doing the measurement requires either at least five located publications or a usable career profile. That is 526,402 graduates on the slides, about 58% of cohorts. The draft requires five publications and has 528,434. Someone who leaves research for a non-publishing job at a foreign firm and has no LinkedIn profile isn’t in the denominator. Shvadron said so himself in the Q&A.
A quarter, eventually
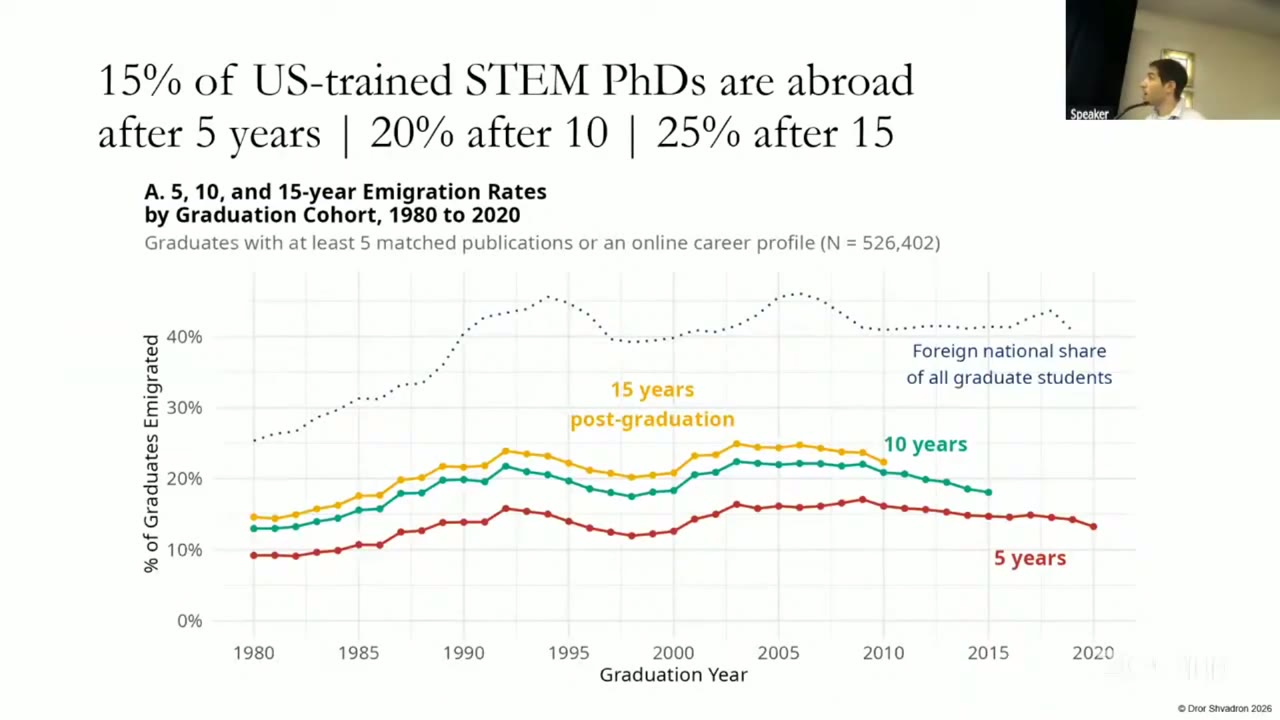
On the slides, with the newer build, 15% of graduates are abroad after 5 years, 20% after 10 and 25% after 15. The December draft has the same 10- and 15-year figures but a lower 5-year rate. Its text says “approximately 10%” and its Figure 1 caption says “approximately 12%”, which don’t agree with each other. The most likely reason the new 5-year rate is higher is that the LinkedIn profiles bring in people who left early and stopped publishing, but that is a guess, and the talk didn’t explain the difference.
The level matters less than how flat the lines are. The rates rose through the 1980s, which matches the foreign-national share of graduates going from about 25% to 40–45%, and they have barely moved since the early 1990s. The draft states the relationship directly. Cohort emigration rates correlate with the foreign share at to , and in every cohort the 5-year (15-year) rate is about a quarter (half) of the foreign share. Departures are also slow. “Even those who leave stay in the us for several years before leaving” (02:53:54). Even if emigration were pure loss, the us gets several years of postdoc and early-career work from a scientist before they go.
Destinations have changed more than the totals. According to the draft, nearly all of the rise in the 5-year rate since the 1980s comes from moves to Asia. South Korea and Taiwan led in the 1990s (“largely fueled by semiconductor scientists”), China has led since the mid-2000s, and moves to Canada halved. Engineers leave the most and life scientists the least. Roughly 30% of 2000s graduates in mathematics, computer science and engineering are abroad within 15 years. In the critical-technology categories, quantum is close to a third and biotechnology is under 20%.
The 94%
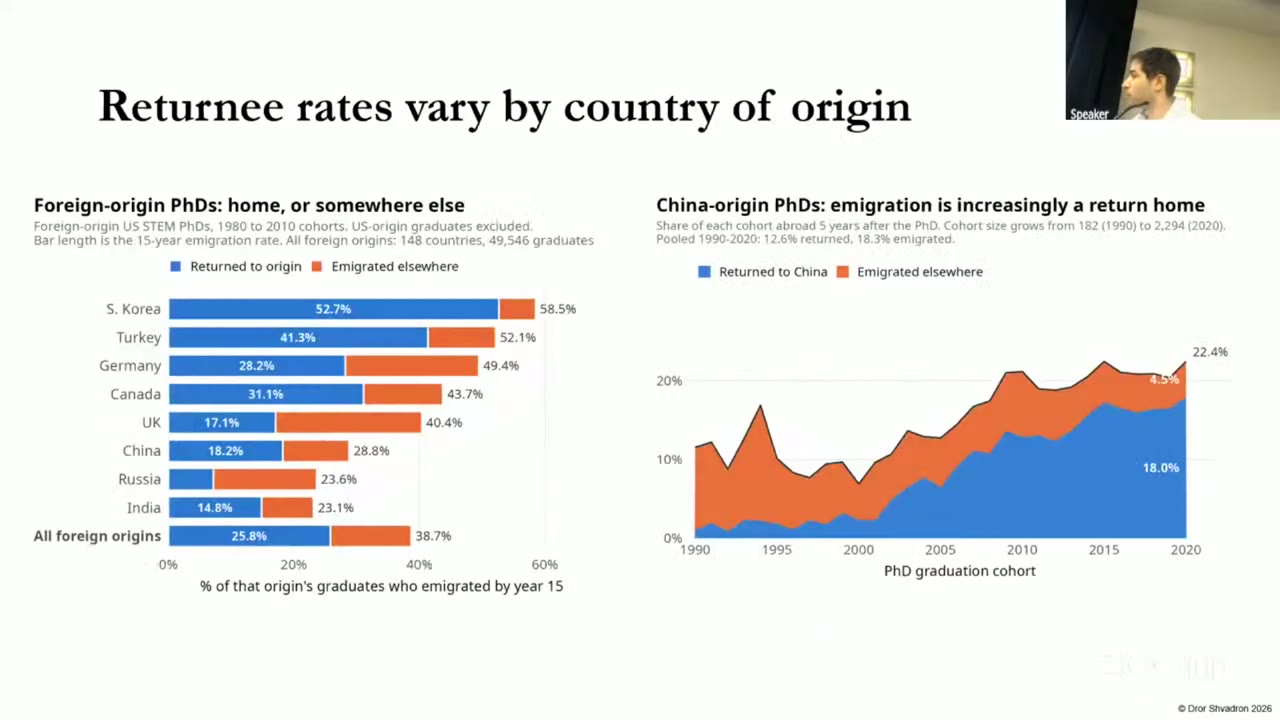
This part of the talk isn’t in the draft. The newer build uses the country where a graduate did their undergraduate degree as a proxy for country of origin, which is available for about two-thirds of the sample. Among 1980–2010 graduates with a Chinese undergraduate degree, 28.8% have left the us 15 years later, and 18.2% are in China. (Shvadron said “about a third”; the bar says 28.8.) The remaining roughly 71% are still in the us. That figure is just 100 minus 28.8 and isn’t printed on the slide. South Korea is the opposite case: 58.5% leave and 52.7% go home. The China return share has been rising, to 18.0% of the 2020 cohort five years out, but as he said, it is “definitely not the majority.”
You’d like this to settle the 94% question, and it doesn’t quite. When pressed in the Q&A, Shvadron agreed that the Ministry figure measures something else (03:02:33): returnees as a share of all outbound students, at every degree level and from every host country. “It’s a different population, it’s not only the us.” What the talk shows is narrower. The 94% describes some population, and us Stem PhDs aren’t it.
The talk also covered who leaves and where they go. Leaving is concentrated at the top. Among foreign-ba graduates of top-10 programs, 43.4% leave within 15 years, against 35.2% from programs ranked 51 and below. Most go to universities and research institutes, led by Max Planck (896) and Toronto (694). The biggest firm destination is Samsung (562), followed by ibm (161). On the takeaways slide, about a third of the corporate positions abroad are at us-headquartered firms, which means some of these “emigrants” still work for American companies.
Is the US giving away its edge?
This is the paper’s real contribution, and on the day it was one sentence on the last slide: “us still benefits for science produced abroad.”
The measure goes like this. Take every patent anywhere in the world that cites a graduate’s papers (Marx and Fuegi’s Reliance on Science data). Assign each citation to the country of the patent’s assignee, meaning the owner, “mostly firms, but including universities and individuals.” Then ask what share of the world’s patent citations to this person’s science comes from us assignees, and compare the papers they wrote before emigrating with the papers they wrote after.
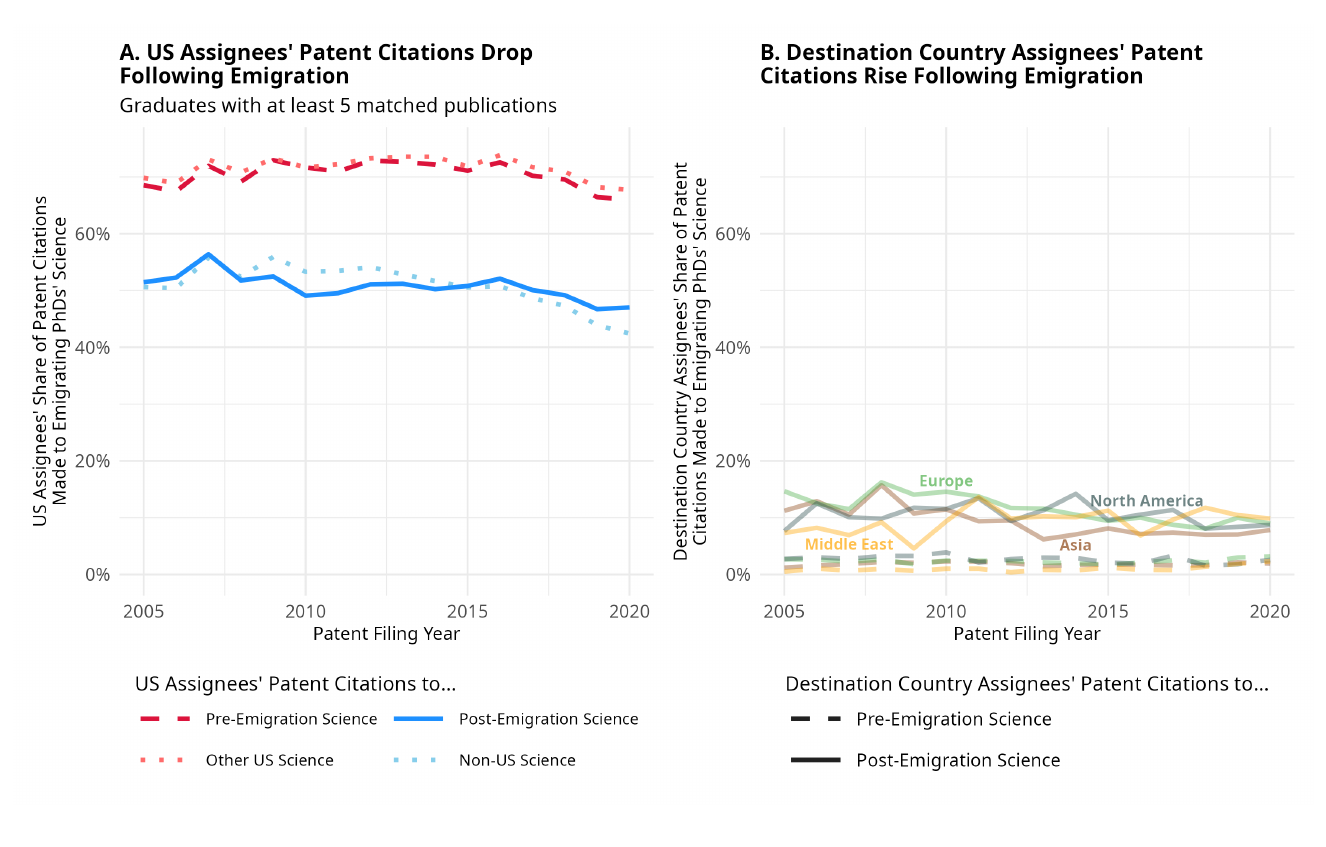
According to the December draft, us assignees make about 70% of patent citations to emigrants’ pre-emigration papers. That’s the same share they make to the papers of graduates who never leave. For post-emigration papers the us share falls to about 50%, the same share they make to non-us science in general. Over the same move, the destination country’s share goes from “roughly 2% to 10%.” The abstract’s summary is that the us share after emigration “remains five times larger than the destination country share, and as large as all other countries combined.” The result holds with 10 or 50 publications required instead of 5, when citations are indexed by citation date, and when only in-text patent citations are counted.
In each case the emigrant’s line lies on top of the comparison line. Before leaving, their science is cited the way us science is cited. After leaving, it is cited the way foreign science is cited, with no extra us pull because they trained there. So, at least through this channel, the us “edge” isn’t something the scientist takes with them, and it doesn’t leave with them either. It sits on the citing side. us assignees make about half of the world’s patent citations even to science written abroad, so a paper from a lab in Seoul gets read by us firms about as much as any other foreign paper. The “five times” isn’t mainly a statement about emigrants. It reflects how much us patenting absorbs everyone’s research compared with any one destination country (and it is 50 divided by 10 from rounded shares, since the draft never plots a pooled destination line).
The authors are careful about how far they go. They “interpret the 20% difference in shares as an indication of the loss of absorptive capacity” and call it “a rough estimate of the importance of a scientist’s physical presence in the us” (p. 7). That caution is warranted. The comparison is across different papers by the same people, written at different career stages and possibly on different topics, with no controls. And a share isn’t a level. If someone publishes more or less after moving, the us could get more or less total value at a constant share. Read conservatively, being in the us is worth about 20 points of the us citation share of a person’s work, and the other 50 points stay in the us whatever happens.
The draft also has a selection result pointing the same way, which the talk left out. In the 2000–2014 cohorts, the authors regress early-career output on a stayer dummy:
(Table S5 note, p. S41.) Here is graduate ’s output in their first five post-PhD years, , and are PhD-institution, field and graduation-year fixed effects, and is the stayer premium.
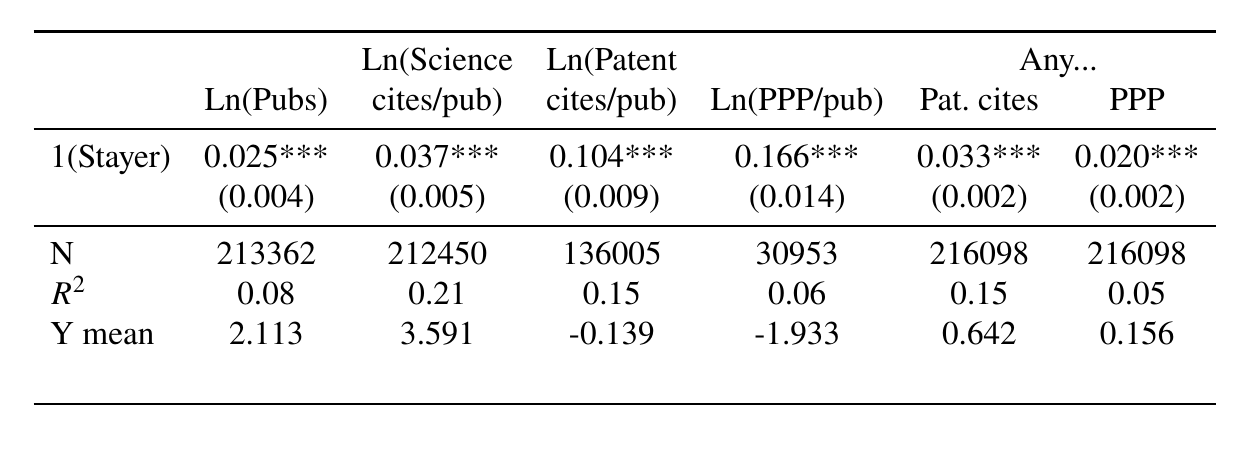
Stayers do better on every measure. They have 0.025 log points more publications, and per publication 0.104 more patent citations and 0.166 more patent-paper pairs. They are also 3.3 points more likely to be cited by any patent at all, against a mean of 64%. The authors read this as positive selection of stayers, while noting they “cannot fully rule out” that being in the us raises output early on. One thing to watch: the main text describes stayers as those who remain “at least five years,” while the table note says ten.
Put the pieces together and the title question gets a mixed answer. A quarter of these scientists leave, and the ones who leave are on average somewhat less patent-relevant than the ones who stay. Where you are does cost the us citation share, about 20 points, but the us still uses half of what emigrants produce afterward, because it uses half of what everyone produces.
Q&A
One questioner (not named) suggested a different channel of benefit. My co-authors in China have equipment I don’t, so do returnees keep publishing with us co-authors? “That’s a great idea, we haven’t done this” (02:59:26). The next question is mostly lost in the captions, but the answer was about coverage. OpenAlex catches anyone who publishes in China, and someone who goes to a firm abroad and stops publishing may be missed. They are considering using patents to fill that gap, but “there are limitations to the extent that we can pick up people if they’re not in the data” (03:00:15). A question the captions lose seems to have been about the most recent cohorts. The answer was that for the last two years the publication and LinkedIn data haven’t caught up yet: “I can come back to you in a couple years” (03:00:54). Asked whether leavers can be predicted at the start of the PhD, he pointed to program rank and early productivity, which are in the paper.
The sharpest question picked up an earlier talk at the conference about PhD slots shrinking at top programs. Most foreign students stay, but how does that compare with giving those slots to people who are even more likely to stay? “That’s a question to explore and I don’t have an answer” (03:02:21). That’s the honest answer, and it’s the right counterfactual. Everything in the paper compares a foreign-trained emigrant with the same person had they stayed. The policy question compares them with a different student in the same seat, and on that question the paper shows only what the us keeps, not what it would have had otherwise.