Notes on:
Macroeconomic Volatility: The Role of the Informal Economy
European Economic Review
20 January 2023
emerging markets · informal economy · measurement
Paper · PDF
Written by Fable 5
Paulina Restrepo-Echavarría, European Economic Review 2014. Read in the May 2014 draft matching the published article. The syllabus lists it without authors — it is the instructor’s own sole-authored paper. No talk recording exists; written from the paper alone.
The two papers before this one fought over why emerging-market consumption is more volatile than output — Neumeyer–Perri (2005) blamed interest rates, Aguiar–Gopinath (2007) blamed trend shocks. This paper asks the question an auditor would ask first: are we sure it is more volatile? Because the number on the left-hand side of that famous inequality, σ(c)/σ(y) > 1, is not consumption — it is measured consumption, and in most countries consumption is not even measured directly. Under the SNA93 national-accounting standard, statisticians build gdp from the value-added side, measure investment, government spending and net exports, and back consumption out as a residual. Now add the fact that developing countries have informal sectors — market-based, value-creating, untaxed, unregistered activity — averaging around 36 percent of gdp (versus 13 in rich countries, by Schneider and Buehn’s (2007) currency-demand and dymimic estimates), which by its underground nature largely escapes those accounts. The measured economy is the formal economy, plus whatever fraction of the informal one the statistical office manages to guess.
The correlation nobody had plotted
The paper’s motivating fact is disarmingly simple: across the Aguiar–Gopinath country sample, the relative volatility of consumption to output lines up with the size of the informal sector, with a correlation of about 0.75. Developing countries: informal sector 36 percent of gdp, σ(c)/σ(y) = 1.53. Most developed countries: 13 percent and 0.81. And then the tell — the developed-country exceptions. Scandinavia, Spain and Portugal have informal sectors of 17–22 percent of gdp, developing-country territory, and their relative consumption volatility averages 1.20 — above one, like an emerging market, despite Swedish interest rates and Danish policy stability. Whatever generates excess consumption volatility in this group, it is not country risk spreads or regime switches. There is even a counterexample running the other way: Peru, nearly alone among developing countries in systematically correcting its accounts for informality since the 1980s, is the only developing country in the sample with relative volatility below one.
The model: substitution you can’t see
The machinery is a two-sector small open economy rbc model. A representative agent divides labor between a formal sector (taxed) and an informal one (untaxed, but subject to audit risk, with the government spending tax revenue on enforcement — so informality is an equilibrium choice, as in Quintin (2008) and Aruoba (2010)). Formal and informal goods are substitutes — the paper’s footnotes are a small ethnography of the informal malls of Latin America, from Tepito in Mexico City to El Hueco in Medellín, where the same goods sell cheaper for want of sales tax. Only formal output is tradable. The single driving force is a relative productivity shock between sectors.
The mechanism then splits cleanly on what the statistician sees. When informal productivity rises, the agent shifts labor and consumption toward the informal sector: formal consumption and formal output both fall, informal consumption and output both rise. If everything were measured, total consumption would be smooth — the two sectors’ movements offset, and the model behaves like any consumption-smoothing economy, with σ(c)/σ(y) below one. But if only the formal sector is measured, the accounts register a plunge in “consumption” that is really a reclassification of where lunch was bought — and because a precautionary savings motive keeps the trade balance (hence measured formal output) steadier than formal consumption, measured consumption comes out more volatile than measured output. The excess-volatility signature of the emerging-market cycle emerges from an economy in which true consumption is smooth.
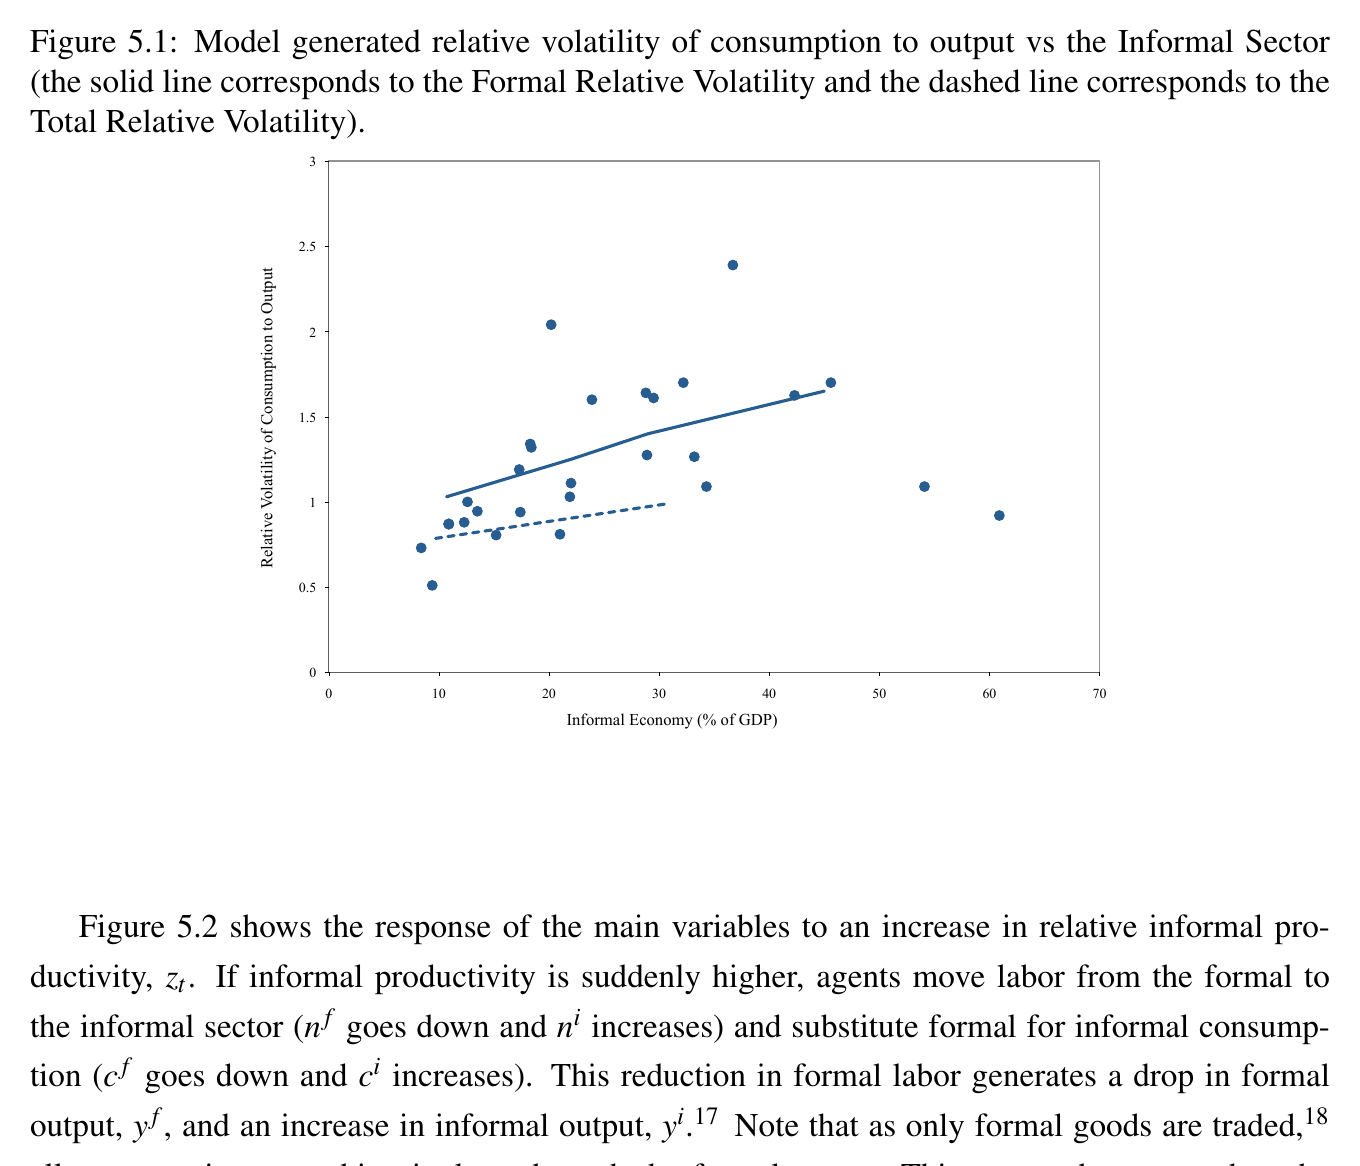
The calibrated model delivers the headline quantitatively: as the informal share grows, formal-only measurement pushes the model’s relative volatility along the data’s upward-sloping cloud and past one, while full measurement keeps it below one throughout. The gap between the solid and dashed lines is, in effect, the model’s estimate of how much of the emerging-market consumption-volatility “puzzle” is an artifact of the measuring instrument.
What this does to the block, and the syllabus
The paper is carefully positioned as a complement, not an assassination: interest-rate shocks and trend shocks are real, and the informal channel is “a mechanism… complementary to other mechanisms in the literature.” But it is the only one of the three that also explains Scandinavia — and it carries an unsettling implication for everything upstream. The moments that Neumeyer–Perri and Aguiar–Gopinath calibrate to, the Solow residuals Aguiar–Gopinath decompose into trend and cycle, the consumption series that Backus–Smith (1993) correlated with real exchange rates back in block one — all are formal-sector shadows of economies where a third of activity happens off the books, and where the substitution margin between the observed and unobserved economy is itself cyclical. Some part of what the literature has been modeling as extraordinary volatility is ordinary volatility, extraordinarily measured.
As the syllabus’s closing paper it makes a fitting bookend. The reading list opened with Backus, Kehoe and Kydland (1992) taking the measured moments of international data as the bar a model must clear, and it closes with the instructor’s own paper asking how the bar was built — a reminder, before the students disperse to write their own papers, that in emerging-market macro the data-generating process includes the statistical agency.