Notes on:
On the Design of Effective Sanctions: The Case of Bans on Exports to Russia
Economic Policy 39(117): 109--153
2024
geoeconomics · sanctions · export controls · Russia
Paper · doi · PDF
Made with AI: Opus 5 (reading and writing)
Ricardo Hausmann (Harvard Kennedy School; Santa Fe Institute), Ulrich Schetter (University of Pavia) and Muhammed A. Yıldırım (Harvard Kennedy School; Koç University). Economic Policy 39(117), January 2024, pp. 109–153, open access; presented at the 77th Economic Policy Panel, Managing Editor Isabelle Mejean. This digest is written from the published version, which supersedes cid Faculty Working Paper 417 of September 2022 — several headline numbers moved between the two. No talk recording could be found; pdf-only digest. Figures are cropped from the published version.
Sanction the imports, not the exports
The 2022 sanctions debate was about Russian energy, and the paper opens by pointing out why that was so hard. Before the war the eu bought a quarter of its oil and 40% of its gas imports from Russia, while Russia sold half its oil and three-quarters of its gas exports to the eu (p. 112, footnote 1). Symmetric dependence makes an energy embargo expensive for the sanctioner, which is a polite way of saying that both hands were on both throats. Russian imports are a different matter. The eu accounts for 40% of them while less than 2% of eu members’ exports go to Russia (p. 112), and the coalition — the eu, the us, the other G7 members, Australia, Korea and Taiwan — supplied about 54% of Russian imports before the crisis (p. 122). Export bans are therefore the instrument with the asymmetry in the coalition’s favour, and the paper’s job is to say which of the roughly 5,000 six-digit hs products to ban.
A criterion from Baqaee–Farhi
Section 2 (pp. 116–120) derives the cost to Russia of banning coalition exports of a single product in a four-tier production hierarchy with Armington varieties (Figure 3, p. 118). The trick is Baqaee and Farhi’s (2019) duality result. A ban raises the price of Russia’s aggregate of product , which is the same object as a negative productivity shock in a dual closed economy, where Hulten’s theorem gives the first-order effect and a second-order approximation supplies the curvature. Doing this one product at a time is what makes it tractable and is also the whole point: a single HS6 ban is a large shock at the product level while remaining small in aggregate, which is exactly the regime where the second-order term earns its keep.
That is Proposition 1, Equation (3), p. 119, where is the product’s sales share in Russia, the coalition’s pre-shock share of Russian expenditure on it, the elasticity of substitution across country varieties of (how easily Russia re-sources from third countries) and the elasticity across inputs of ’s downstream buyers (how easily they do without it), equal to one for consumer goods and to some otherwise. The four intuitions on p. 120 are the ones you would have guessed — ban a big input, ban where the coalition dominates, ban what cannot be re-sourced, ban what cannot be designed around — and the expression adds the one thing intuition does not give you, which is the shape.
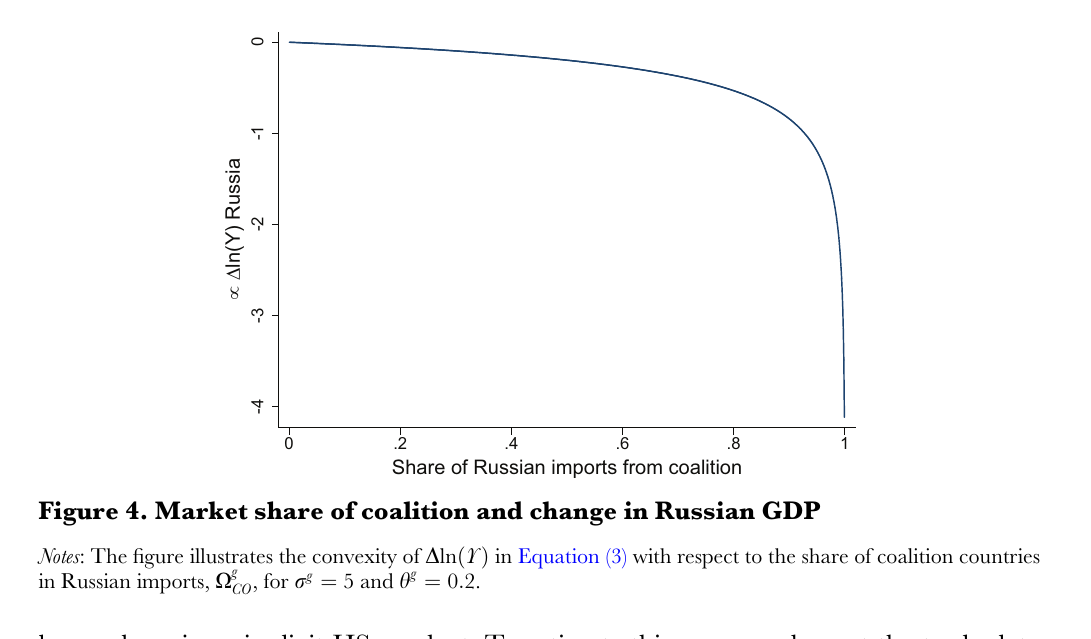
The cost is highly convex in the coalition’s share (Corollary 1, p. 120, proved in Appendix 2 and drawn in Figure 4): going from 80% to 100% control of a product does far more damage than going from 0% to 80%. That is the same nonlinearity cms find for power in Coercion and Fragmentation (2024), here derived for a sanction and with a direct implication — there are large gains from coordinating bans across the whole coalition and from targeting products the coalition dominates, and a ban by one member on a product the others keep supplying achieves close to nothing.
There is a second criterion, and it is the one that ends up doing the work. Dividing Equation (3) by the coalition’s exports of gives the cost to Russia per foregone coalition export dollar, Equation (4), p. 126:
This matters because the “optimal” baskets in the quantitative section are built on Equation (4), not Equation (3) (p. 136). The headline result later in the paper is a bang-per-buck targeting result, not a raw damage-maximising one.
What the eu and us actually banned
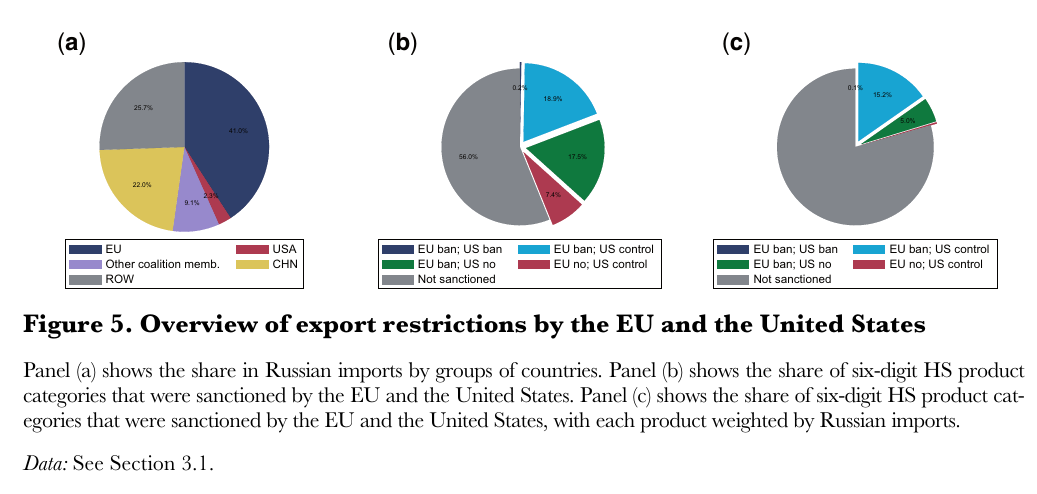
Section 3.1 (p. 122) characterises the restrictions in force. The data are Global Trade Alert, covering everything imposed since the 2014 annexation of Crimea and up to 14 October 2022; only 41 of the 1,689 products the eu had sanctioned by that date predate 2022 and were not superseded. The eu supplies 41.0% of Russian imports and the us 2.3%, which already tells you who has the leverage and who has the press releases. About 44% of product categories were sanctioned by the eu, the us or both — and of those, roughly 43% by both, 40% by the eu only and 17% by the United States only, so more than half of all restricted products were restricted by only one of the two. Weighted by Russian imports, sanctioned products account for about 20% of the total.
Ranking, and the scope for doing better
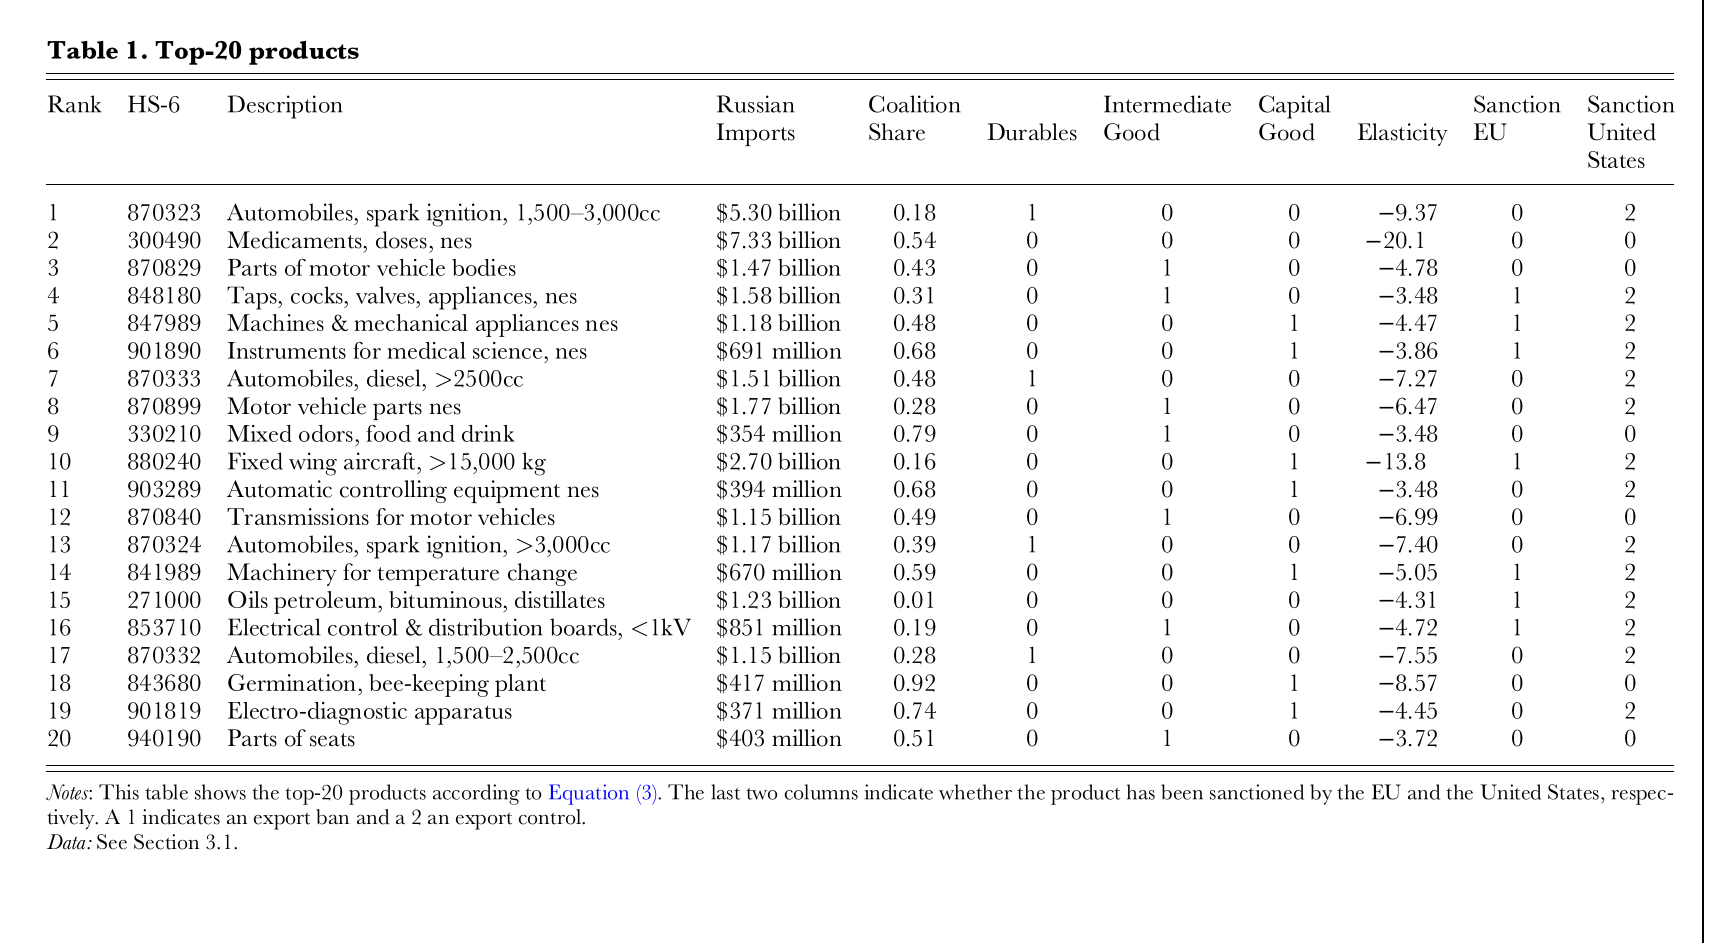
Section 3.2 ranks every HS6 product by Equation (3). The top twenty (Table 1, p. 124) all sit in the top decile of Russian imports and the top five each exceed $1 billion, but the other terms do work: rank 18 is germination and bee-keeping plant, only $417 million of imports but a coalition share of 0.92, sanctioned by neither party. Rank 2 is medicaments, $7.33 billion and a coalition share of 0.54, also sanctioned by neither — presumably on purpose, since the eu explicitly excluded food, health and pharmaceutical products (p. 132). Rank 15 is petroleum oils, coalition share 0.01, sanctioned by both, which is a tidy illustration of selection by size rather than by leverage. For the eu, the share of the top twenty that is sanctioned is about the same as the average across all products (7 of 20); for the United States it is larger (14 of 20). (A small erratum worth noting: the text on p. 123 calls hs-903289 “transmission for motor vehicles”, but Table 1 lists 903289 as automatic controlling equipment and gives transmissions to 870840. Trust the table.)
Systematically (Figures 6–8, pp. 125–126), both the eu and us restrictions do lean toward highly ranked products — but p. 125 says this is entirely driven by the term, that is, by product size. Rank by the per-dollar criterion of Equation (4) instead and there is no systematic relationship at all. Plenty of highly ranked products carry no restriction whatsoever.
Chosen by size, not by leverage
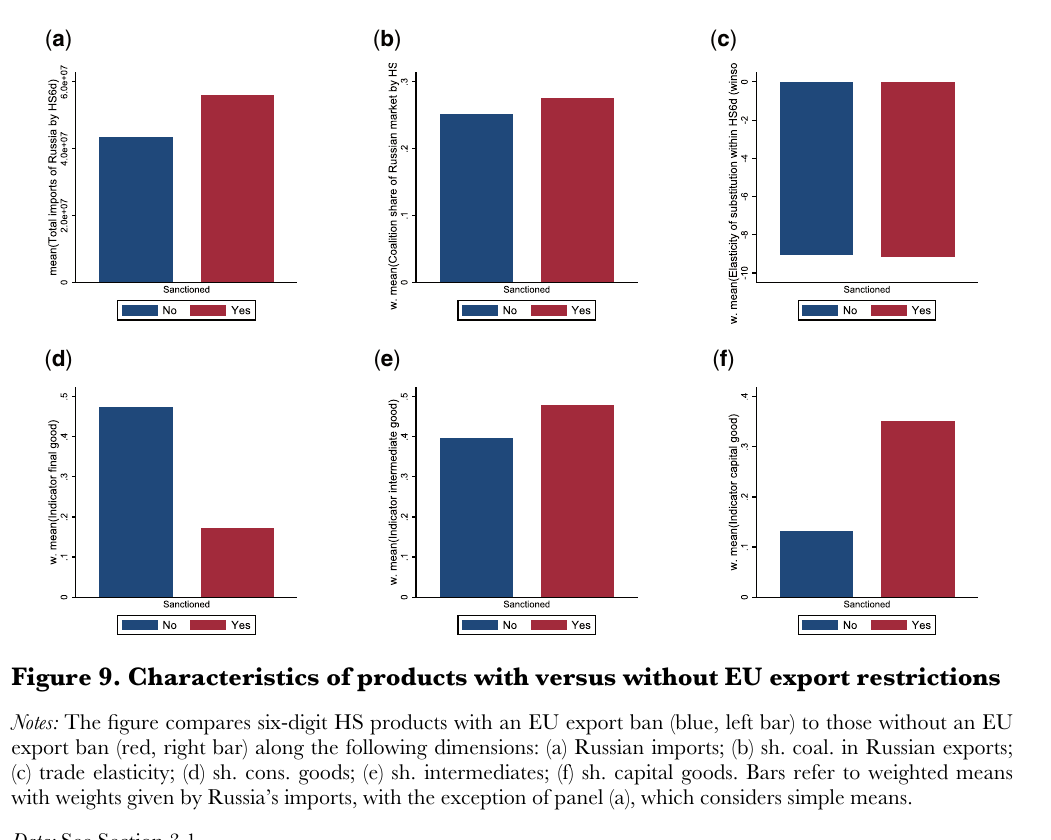
Figure 9 (p. 127) is the diagnosis. Sanctioned products have larger Russian imports, but show little to no difference in coalition market share or trade elasticity — the two things the criterion says should drive selection. They are, however, heavily tilted toward intermediates and especially capital goods. The paper reads this both ways. Inputs are harder to substitute than consumption goods, so a capital-goods tilt means low and is genuinely effective; but capital is a stock, and Russia can run down what it already owns. Section 4.1 makes the point formally with a Cobb–Douglas stock-flow example (Equation (5), p. 129) in which the direct price shock is attenuated by roughly the flow-investment weight . The sanctions on capital goods bite; they just bite slowly.
Quantification
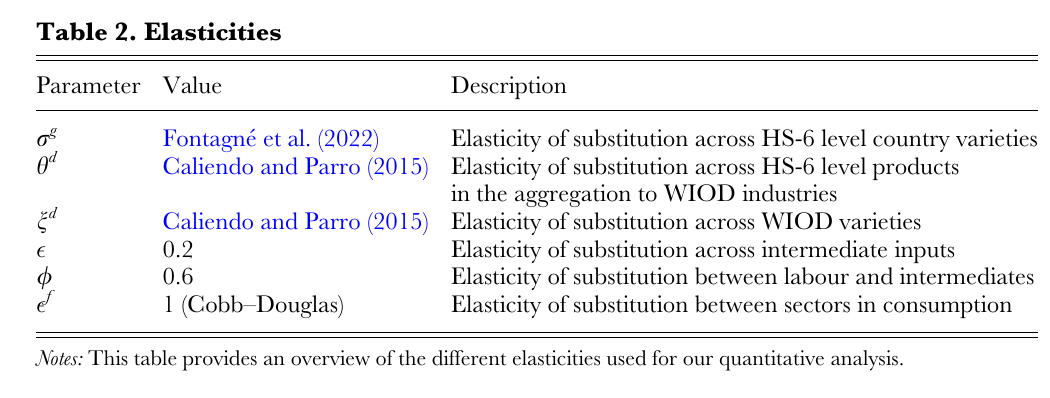
Section 5 (pp. 132–139) takes the product-level bans to a multi-country Armington production network on the World Input-Output Database (Timmer et al. 2015), aggregating HS6 restrictions into 15 goods industries via Equation (6) (p. 134), chosen so that the direct effect on Russian industry price indices matches the disaggregated economy. The elasticities sit in Table 2 (p. 136): variety elasticities from Fontagné et al. (2022), sectoral ones from Caliendo and Parro (2015), 0.2 across intermediate inputs, 0.6 between labour and intermediates, Cobb–Douglas in consumption.
Then six scenarios, and the numbers are the point. Under the sanctions as they stood, Russia loses 0.5% of welfare and the coalition 0.01% — a ratio of about 100 to 1, which holds across every scenario. Have the whole coalition adopt the eu list and Russia’s loss goes to 0.8%; the us list, 0.7%. Now hold the banned volume fixed at that level but distribute it less coordinatedly, and you get 0.6%. Distribute the same volume by Equation (4) instead, coordinated across the coalition, and you get 1.1%. That gap — 0.6% to 1.1% — is the paper’s headline: improved coordination plus criterion-based targeting raises the cost to Russia by about 80% at little to no extra cost to the coalition (p. 138). Coordination alone buys as much as or more than expanding the basket. And since even the optimal scenarios ban only about 45% of coalition exports to Russia, there is room above: at 150% of that volume, Russia’s loss reaches 1.6%.
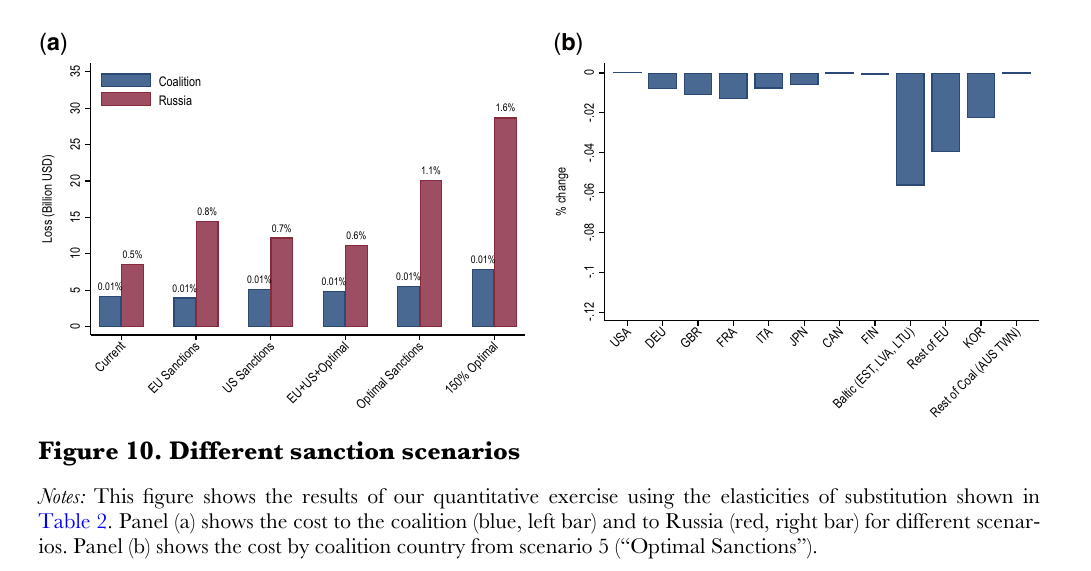
Panel (b) distributes the bill. The largest losses fall on the Baltics, then the rest of the eu, then Korea; the United States bar is essentially zero, and the paper notes that all other countries face much smaller losses or even gain. Even for the Baltics the loss is more than ten times smaller than Russia’s — the 100-to-1 ratio is an average, and proximity costs you an order of magnitude of it.
To the authors’ credit they immediately undercut themselves. The 1.1% figure, they write on p. 138, “is nevertheless moderate”, of the same magnitude as Bachmann et al. (2024) and Evenett and Muendler (2022); their interest is in relative magnitudes across scenarios rather than point estimates; and their elasticities were estimated from small shocks while they are applying them to large ones, which means the exercise may overestimate Russia’s ability to substitute. Appendix 3 reruns everything with much stronger complementarities and the pattern survives.
What is left out
Section 4 (pp. 128–132) is unusually candid: one product at a time, so no interaction effects between bans; simplified input-output linkages; no cost to the sanctioners inside the ranking itself, though Equation (4) partly fixes that; no war-economy distortions; static, so no stock run-down dynamics; no strategic retaliation; and no non-economic motives at all.
On evasion the published version says more than the working paper did, and it is worth being precise. The quantification still assumes sanctions are fully effective. But Section 4.1 (p. 129) names the leakage channel outright: Miromanova (2023) finds no systematic evidence of smuggling around Russia’s own 2014 retaliatory embargo, but there is suggestive evidence of re-routing through Turkey, Kazakhstan and Armenia (Borin et al. 2023). And here the convexity result turns on its makers: if the last slice of market share does most of the damage, then even small leakage undoes a lot of it. The authors’ defence is that leakage is probably not systematically biased across products, so the ranking survives even if the levels do not. This is where Export Sanctions (Egorov et al. 2026) and the dark-shipping paper (Fernández-Villaverde et al. 2025) pick up. Throughout, the paper insists it is “not a blueprint for policy, but an easily implementable input into a more comprehensive analytical process” (pp. 114, 140).
The thing the working paper never had to admit
The published conclusion opens by conceding the obvious (p. 139). The sanctions against Russia are “the most comprehensive in modern history”, initial forecasts anticipated a double-digit contraction of Russian gdp, and Russian gdp fell 2.1% in 2022 and was expected to grow 0.7% in 2023 (imf, accessed 30 June 2023). The authors then do something more interesting than get defensive: they point out that their own quantitative estimate of a moderate effect is broadly in line with that resilience, with the resilience of European countries to energy shocks (Fontagné et al. 2024; Moll et al. 2023), and with a whole literature of quantitative trade models that routinely predict small effects from trade shocks. Which is to say that a paper selling a targeting criterion ends by arguing that gdp was never the right scoreboard. The case for export bans is the 100-to-1 ratio, the multiple purposes sanctions serve, the lag built into a capital-goods-heavy basket, and the roughly 80% of headroom nobody has used. That admission did not exist in the cid working paper, and it is the sharpest thing in the published one.
Where it sits
This is the practical paper in 2.3 and the one that connects the sanctions sub-block to the production-network backbone in 1.0: the criterion is Baqaee–Farhi’s second-order formula pointed at a target, and the convexity result is the sanctions version of the block’s recurring gotcha that power and damage are nonlinear in share. The published version positions itself carefully. Chowdhry et al. (2022) find quantitatively that coalitions mattered for Iran in 2012 and Russia in 2014; this paper claims to supply the analytic reason, which is the convexity. Imbs and Pauwels (2024) approximate sanction effects through input-output linkages, where this paper emphasises product-level substitutability, and the two are explicitly framed as complements. Becko (2024) does sanctions as terms-of-trade manipulation; Javorcik et al. (2022) price friend-shoring. From our own list: Becko gives the theory of which goods to tax; De Souza et al. solve the same problem with tariffs in a Caliendo–Parro model; this paper does it with bans at the product level and then, unusually, confronts the answer with the lists actually adopted. Read with Alekseev–Lin (2025), whose military-use measure is the same exercise for dual-use goods, and with Ghironi–Kim–Ozhan (2025) for the dynamic welfare split between sanctioner and target.