Notes on:
The Power of Substitution: The Great German Gas Debate in Retrospect
Brookings Papers on Economic Activity
2023
geoeconomics · production networks · energy shocks · elasticity of substitution · Germany
Paper · PDF
Made with AI: Fable 5.1 (reading and writing)
Benjamin Moll (London School of Economics), Moritz Schularick (Kiel Institute for the World Economy and Sciences Po) and Georg Zachmann (Bruegel). Brookings Papers on Economic Activity, Fall 2023, pp. 395–455, with comments by James D. Hamilton (pp. 456–465) and Tarek A. Hassan (pp. 465–476) and a general discussion. The version read is the unembargoed conference draft dated 26 September 2023, prepared for the bpea meeting of 28–29 September, which carries the paper and its online appendices but not the discussants’ comments; nothing below is attributed to Hamilton or Hassan. No talk recording was found; pdf-only digest. Figures 3–7 and 13 and Table 2 are cropped from the draft. This is the retrospective half of a pair: the forecast it audits is Bachmann et al.’s March 2022 “What if?” brief, digested separately.
The company that was right about its furnace and wrong about the country
On 31 March 2022 the chief executive of basf, the world’s largest chemicals company and a very large buyer of Russian gas, asked a newspaper whether Germany “knowingly want[ed] to destroy our entire economy.” In the same month, the paper notes, basf was publicly stating that half its normal gas supply would be enough to keep its Ludwigshafen site running; the clearest version came on an investor call in July 2022, “Continued operation at Ludwigshafen site is ensured down to 50% of basf’s maximum natural gas demand,” and ammonia, a very gas-intensive product, was in due course made in the company’s American plants and shipped in. The two statements were not separated by a learning process. They were made at the same time, to different audiences, by the same firm. The paper’s reading is that the first is an engineer’s statement about a furnace at today’s price and the second is a manager’s statement about a company with options, and that the German debate of spring 2022 was conducted almost entirely in the first register.
The setup: two weeks into the invasion, nine economists including Moll and Schularick (Bachmann et al. 2024) put the first-year cost of a full stop of Russian energy at what this paper restates as 1–3 percent of output relative to baseline, “substantial but manageable” (the brief itself says 0.5–3 percent; 1–3 is how this paper summarizes it, with the model’s largest number, 2.3 percent of gne, rounded up to 3). Studies financed by industry and unions said 6–12 percent; one forecast 2.5 to 3 million extra unemployed, a rise of more than five points in the unemployment rate. The chancellor went on prime-time television to warn against “the irresponsible use of mathematical models.” Germany kept buying. Then Russia stopped selling: Nord Stream 1 cut to 40 and then 20 percent in June 2022, halted on 31 August, blown up on 26 September. Russia’s share of German gas went from 55 percent to zero.
German gdp grew close to 2 percent in 2022 while gas consumption fell about 20 percent. Over the heating season there was a technical recession — two negative quarters, the first at minus 0.4 or minus 0.5 percent depending on which page of the draft you read (it says both), the second at minus 0.1. A realized gdp path is not a counterfactual loss, the authors concede, but for a 12 percent loss to be true Germany would have had to be on course to grow 12 percent.
Why an elasticity of 0.05 is closer to 1 than to 0
The theoretical core is one production function and one observation about it. Output is made from gas and everything else with a constant elasticity of substitution,
(equation 1), where is the gas share, calibrated at 1 percent of gross national expenditure, and the elasticity. At production is Leontief and : a 20 percent gas cut is a 20 percent output cut whatever the value of , because the missing gas strands a fifth of every other input. At the loss is percent. At it is 2.7 percent.
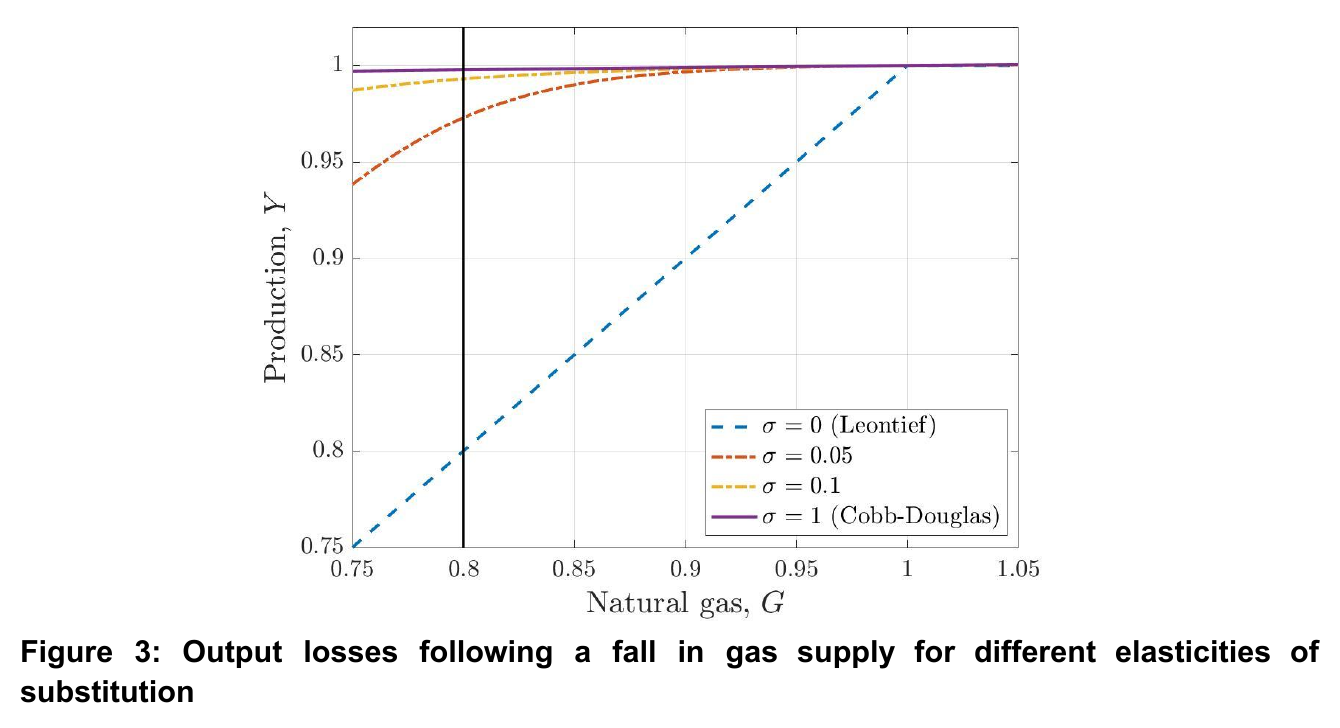
Going from literally zero substitutability to a trace of it cuts the loss by almost a factor of ten, and on the figure the 0.05 line lies visibly nearer Cobb–Douglas than Leontief, because with a 1 percent input share very little substitution unsticks the bottleneck. The paper adds two reasons the relevant elasticity is not the one an engineer would quote: macro elasticities exceed micro ones (Houthakker’s (1955) result that Leontief firms aggregate to a Cobb–Douglas economy), and elasticities grow with the horizon — Le Chatelier, illustrated by the glass furnace that cannot switch to fuel oil overnight but did within months. The “engineering view” is right about a furnace and wrong about a country.
The tool that made the 2022 forecast tractable is a Baqaee–Farhi (2019) second-order approximation:
(equation 2), where is gas imports, their price and the expenditure share. Every assumption about elasticities and input-output structure ends up in the second term: bottlenecks make gas prices explode, which makes the share jump. In March 2022 the share was 1.2 percent; assume it quadruples to 4.8 and cut imports 30 percent and the loss is about 1 percent (equation 3). In the data it went from roughly 1 to roughly 4 percent of gne.
The authors’ point about the formula is that it works as a bound. Any headline loss implies a jump in the expenditure share, and you can ask whether that jump is believable; a loss large enough to justify the sponsored numbers, they say, “would imply an unreasonably large increase in the gas expenditure share, say to 20% of gne.” They leave it there, but you can run it. Put the share at 20 percent and cut imports 30 percent and the formula gives about 3.8 percent of gne, not 12. To reach 12 with a 30 percent import cut the share has to rise to about two thirds of national expenditure; even if every unit of Russian gas vanished and imports fell 55 percent, it has to reach nearly 30. Germany spending a third or two thirds of its income on gas is not a scenario anyone published, and that is the paper’s advice to anyone modelling the next input shock: check what the model implies for expenditure shares before publishing the headline.
What filled the hole
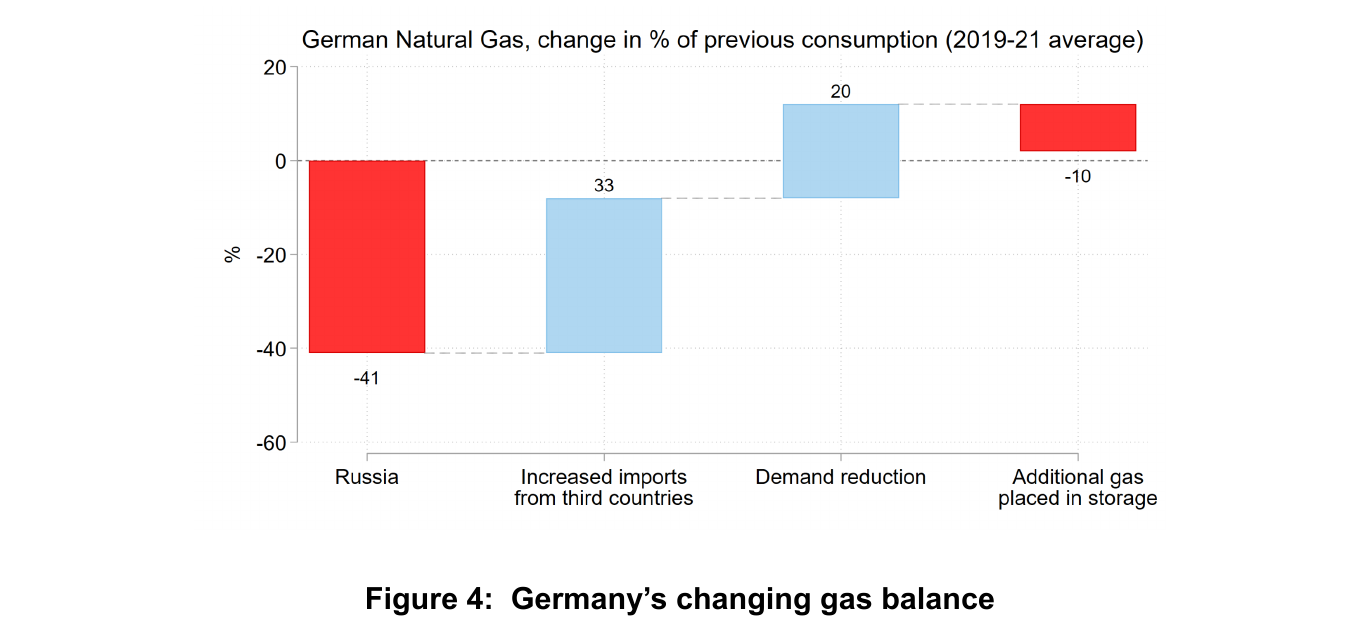
The cut-off removed gas worth 41 percent of previous consumption, counting indirect flows and re-exports rather than pipeline meters (the direct drop was 81 percent, but much of that gas had been passing through to Germany’s neighbours). Third-country imports made up 33 or 34 points depending on whether you read the figure’s bar or the text; Appendix Figure B.1 breaks the bar down by ultimate source, and its components sum to 33. Norway supplied 16 of those points, almost half. lng supplied 13: 7 from the United States, 3 from Qatar, 1 from elsewhere and, in a detail the paper reports without comment, 2 from Russia. British and eu production added 4. Germany’s own hastily built terminals, the first of which opened at Wilhelmshaven on 17 December 2022, handled about 3 points of that lng; the rest came ashore in Belgium, the Netherlands and France and arrived by pipe, which is the paper’s point about openness as insurance. The terminal you never built is still useful if your neighbour built one. Demand fell 20 points; 10 more went into refilling storage that Gazprom had kept deliberately empty in 2021.
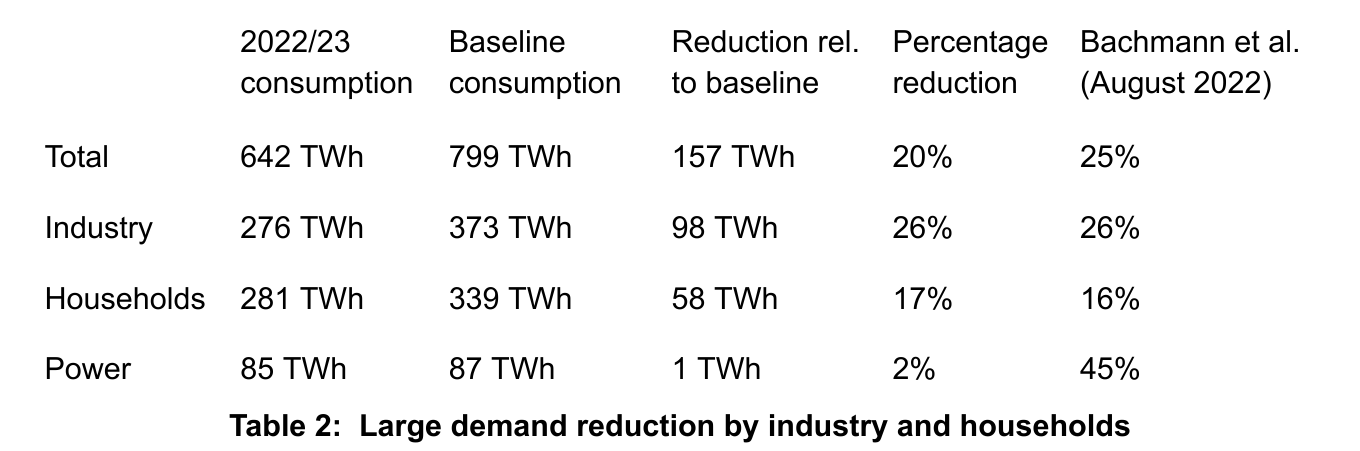
Industry cut 26 percent and small consumers 17, almost exactly the authors’ August 2022 guesses. Where they were badly wrong was power: they expected 45 percent and got 2, because 2022 was the year French nuclear output fell 82 TWh, drought took 82 TWh of European hydro and Germany’s own phase-out removed 32 TWh, so the one substitution everyone agreed on — coal for gas in the power plants — was used up covering somebody else’s shortfall. The weather, checked on a trend-adjusted heating-degree-day basis, saved about 18 TWh over calendar 2022, under 13 percent of the 142 TWh Germany saved that year. The authors’ verdict is that the role of good luck has been “considerably overstated” and that the bad-luck items exceeded the good ones — and, in a footnote, that Germany was not particularly unlucky either.
Decoupling, not cascading
The specific fear of spring 2022 was cascades: gas to glass to bottles to medicine, each link Leontief. In that world a 26 percent cut in industrial gas shows up as roughly a 26 percent fall in industrial production.
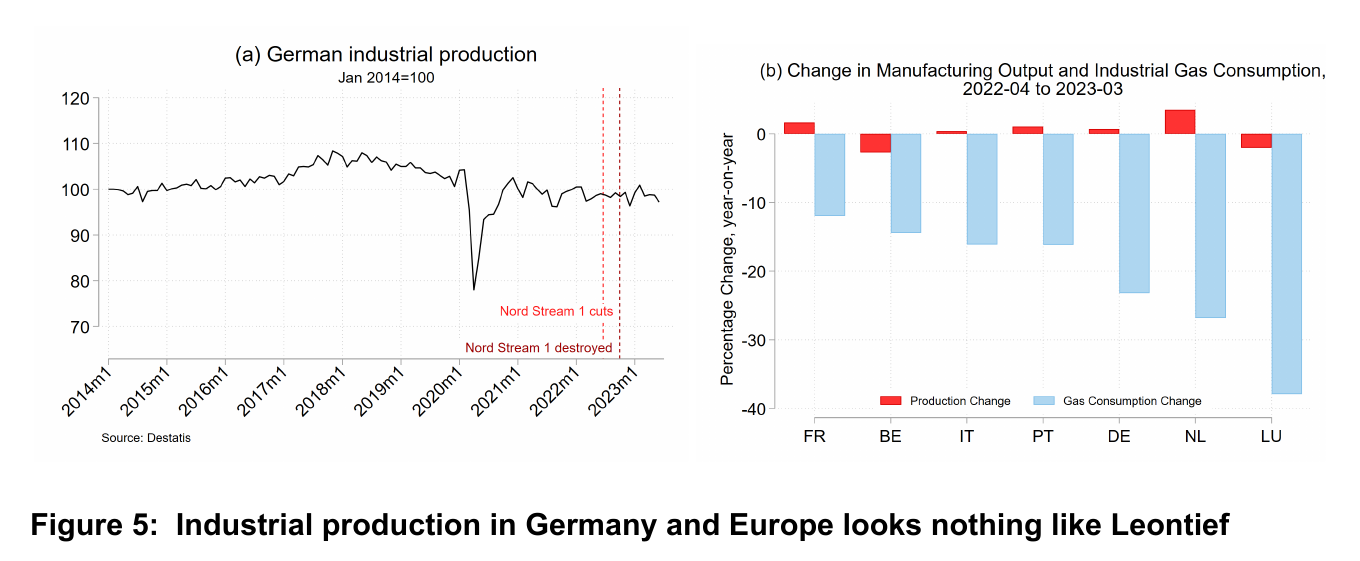
It did not. German industrial production barely moved; across seven European countries there is no visible relation between how much gas industry gave up and what happened to output. What happened instead is the split in Figure 6.
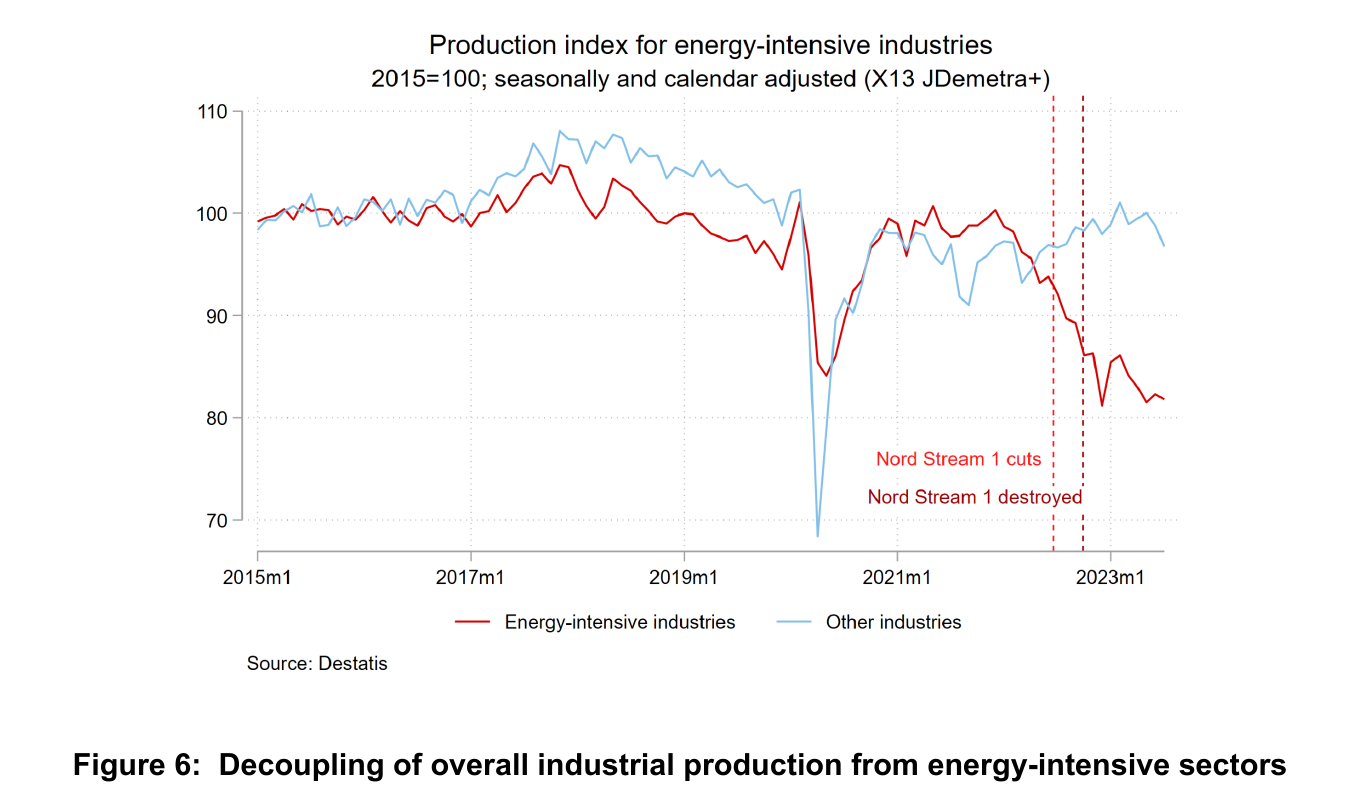
Energy-intensive branches fell close to 20 percent. Everyone downstream of them did not, the polar opposite of a cascade. Figure 7 repeats this at a finer sectoral level, with production merged by wz code: output change is negatively correlated with gas intensity, as it should be, but the authors’ point is that the level is as interesting as the slope — fertilizer, organic basic chemicals, dyes and paper fell roughly 10 to 17 percent, while the cloud as a whole is centred on zero, with plenty of gas-intensive sectors (sugar, bricks) above it.
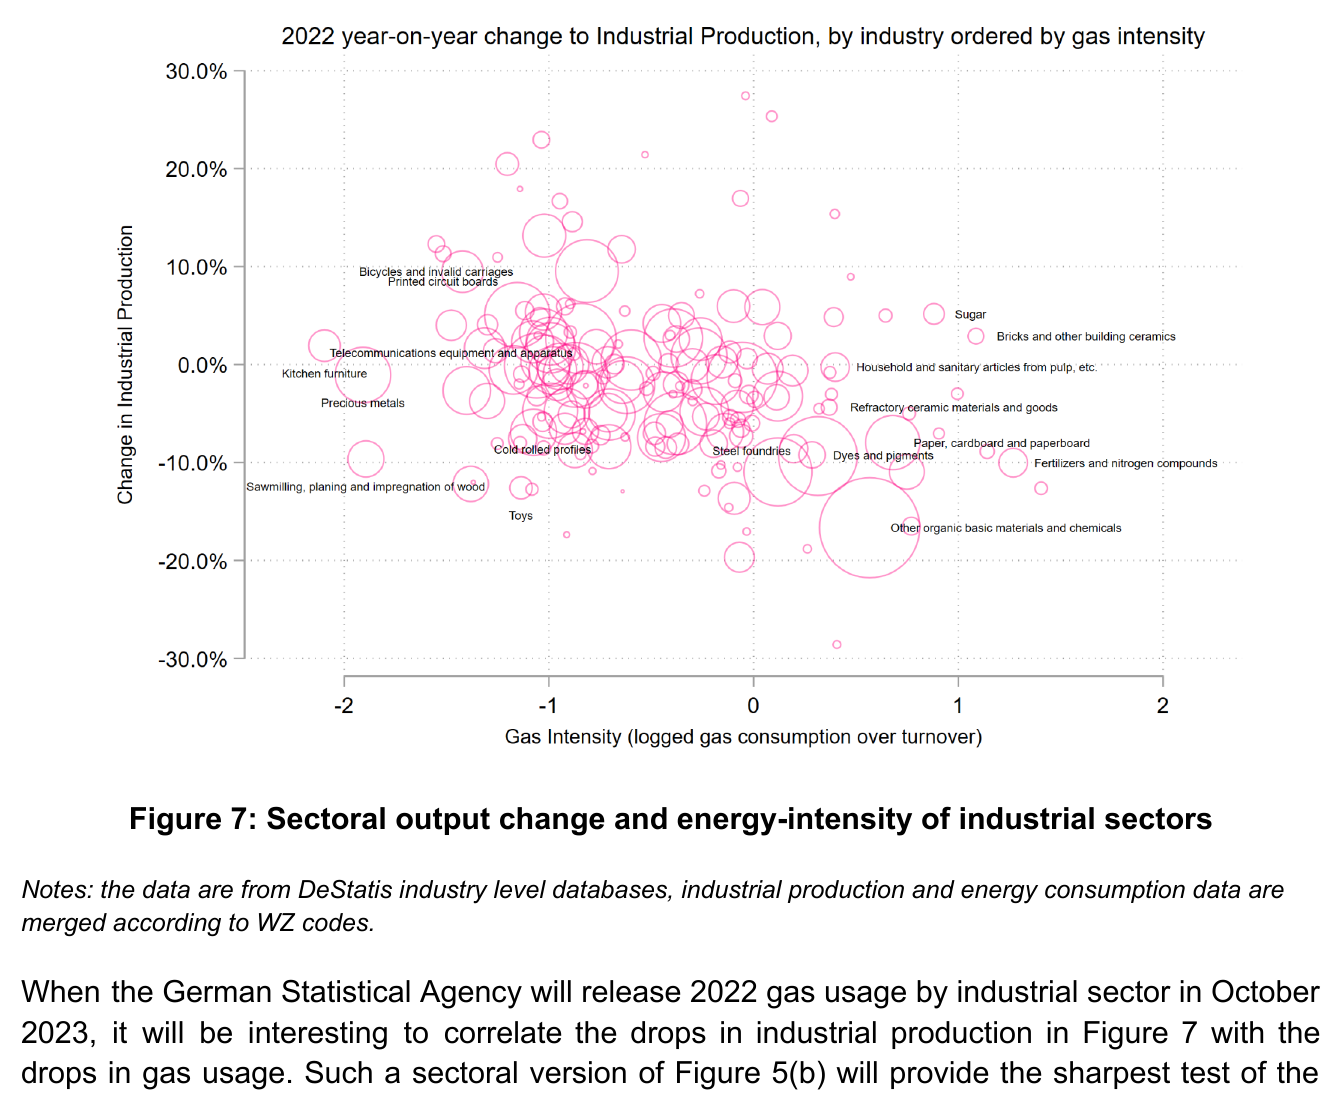
The authors’ leading hypothesis for what broke the chain is imports of the gas-intensive intermediate rather than of gas. Their evidence is illustrative and they say so: net imports of plastics, tyres and aluminium rose, ammonia was made in basf’s American plants instead of Ludwigshafen, and Mertens and Müller’s (2022) finding that 300 mostly traded products account for 90 percent of German industrial gas use explains why the margin could exist. “Substitution via imports was likely an important channel” is the paper’s phrasing, and the correlation with sectoral output is, on its own admission, “less close.” Importing embodied gas costs the importer some production; what it buys is that the loss stops at the first link. One further caveat the authors flag: sector-level gas data for 2022 were unreleased when the draft was written, so the sharpest test — did production fall only where gas use fell? — is promised rather than delivered, and the footnoted conjecture that energy-intensive sectors cut gas by more than 26 percent, making even them non-Leontief, is a conjecture.
Anyway, the paper’s own statement of the lesson, which appears twice in identical words:
In an open economy with substitution possibilities, sharp declines in output in some upstream sectors do not necessarily lead to large contractions in downstream industries. At each point in the production network substitution possibilities exist.
What did not hold up, and what was never modelled
The 2022 model was real and flexible-price, with no Keynesian amplification, and the authors now call that the biggest gap. Lacking a way to measure it in this episode, they lean on hank versions of the same shock (Bayer et al. 2022 under 3 percent, Pieroni 2023 3.4) and on Hamilton’s (2009) oil-shock evidence that the damage runs through consumer spending. Why 2022 hurt less than the 1970s they leave as three unranked candidates: oil is simply the bigger input (about 2 percent of world gdp in normal times against 1 for gas, and the 1970s peak of 7 percent was twice the 2022 gas peak of 3.5), manufacturing is now only about a quarter of activity, and petrol prices are spot-linked and salient where heating bills sit in longer contracts. The advice for next time: more demand amplification, less cascade modelling.
Two more findings stay useful. Germany’s “gas price break” was, despite its name, a lump-sum transfer keyed to 80 percent of past consumption, so the marginal price stayed at market — Hicks compensation rather than a price cap. And on whether Germany could have cut Russia off in April rather than waiting for Russia to do it, the arithmetic is short: about 100 TWh of Russian gas arrived from April to August (67 of it in April and May), Germany exited the winter with 160 TWh in storage, so an April embargo would have left storage at 25 rather than 65 percent with consumption held fixed and no extra demand response allowed, and never empty at any point on the path. This is a storage-adequacy calculation, not a cost estimate. The 25 percent is a floor, since consumption is frozen and autumn imports were in fact constrained by full tanks (a further 2 percent demand cut alone lifts the end-winter number to 33), and the authors add that an earlier stop “would likely have moved gas prices by more and/or earlier,” with “higher economic costs” as the likely result. What they conclude is narrower than “it would have been fine”: that the government overestimated its own physical dependence.
How the number got made
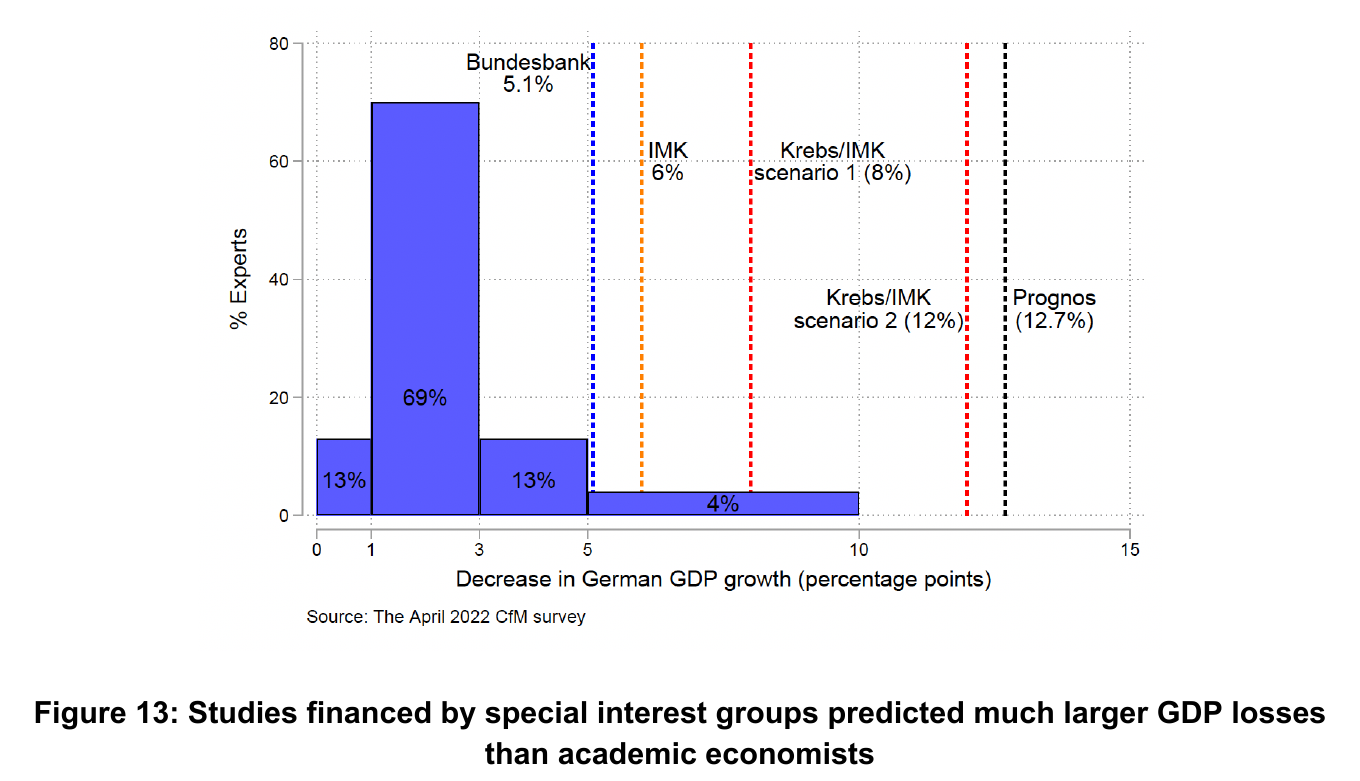
Policymakers asked the firms with the largest bets on Russian gas how dependent they were, and the firms had every incentive to say very. Academic opinion was in fact tightly clustered — 69 percent of a survey of European economists put the cost at one to three points, and the Bundesbank’s 5.1 is the largest estimate not financed by an interest group — while sponsored studies ran to 12.7 percent. The authors’ claim is that the sponsored numbers were not meant to be believed but to widen the range, so that the chancellery’s economics chief could say “we will never ever be able to determine whether this has a 2% or 10% gdp impact” and defer to the ceos. Manufacturing uncertainty is cheaper than winning the argument, and it worked.
Where it sits
Context in the production-networks sub-block, beside Baqaee–Farhi’s Beyond Hulten and the endogenous-network papers, and the list’s one live test of what a chokepoint costs when the network is allowed to reoptimize. The number it fixes is the factor of ten between and on a 1 percent input, and the sufficient statistic that a realized quadrupling of the expenditure share is consistent with a loss near 1 percent of gne. The horizon claim the list attaches to it — near-Leontief within the quarter, near-unitary within the year — is not something this paper estimates; its own evidence is Le Chatelier logic, the twelve-month comparison in Figure 5(b), and appendix back-of-envelope household elasticities of 0.07 to 0.15 lifted from a Twitter thread on early-2022 data, so the year-horizon number should be sourced from Baqaee–Farhi rather than from here. The caveat it imposes on the theory papers is symmetrical: a threat model whose power runs through a Leontief input-output matrix is assuming away the margin that blunted the largest energy weapon of the decade, and, as the authors note in closing, the power of substitution cuts both ways — Russia has been substituting too, which is the ruble material in the money block. The one thing nobody in the story substituted away from was the belief that the people most exposed to a shock are the best judges of its size.