Notes on:
Bias in the Level, Trend, and Cyclicality of U.S. Unemployment
NBER EMRI conference paper (preliminary draft)
18 September 2026
unemployment · survey measurement error · tax data · CPS
Talk · Paper · PDF · Transcript
Made with AI: Opus 5 (reading and writing), GPT 5.6-Sol (reading), Fable 5.1 (adjudication), Sonnet 5 (verification)
Part of Innovations in Measuring Employment, Fall 2026
The draft Bruce Meyer presented on the last slot of the last day is dated 11 September 2026, carries the watermark PRELIMINARY DRAFT – PLEASE DO NOT CIRCULATE across its title page, and is, by the author’s own account from the podium, about a week old: “This is early work. We just finished our first draft a week ago. So we would welcome comments and we’ll be incorporating your thoughts into a new version” [05:34:29]. He opened the other way round, with the provenance of the numbers rather than of the paper: “All the results have been through census disclosure review. Some of them done this week” [05:12:02]. That is not throat-clearing. Several of the sharpest things on the slides — the 2023 figure, the linked-data corrections beyond 2010, the result for Black respondents — cleared disclosure between the writing and the presenting, and appear nowhere in the written text. Where this piece uses them it says so and points at the clock, not at a page.
The thing being measured has never had a truth set. The official unemployment rate comes out of the cps Basic Monthly Survey: interview in the week containing the 19th, questions about the week containing the 12th, and you are unemployed only if you report both not working and searching or on layoff. Both halves are self-reported, and the literature on their accuracy has had to make do with internal inconsistencies — rotation-group differences, reinterviews, people answering the same question twice and differently. Nobody in the United States has had an external record that says what a given person’s labour force status actually was. Meyer, Derek Wu, Matthew Stadnicki, Patrick Langetieg and Mark Payne have found one, for a slice of the population: irs Form 1099-G, Box 1, the form a state files reporting unemployment compensation paid to a person in a tax year. Census holds the universe for 2010 through 2023. You generally cannot collect ui without having been unemployed, so a non-zero Box 1 is a marker. It is a partial marker — it sees claimants only, not quits, not discharges, not the self-employed, not the eligible who never filed — but it is external, which is the part that has never existed before.
Link that file to the cps asec, the March supplement that asks retrospectively how many weeks you worked, how many you were unemployed, and whether you received ui. About 90% of asec persons carry a Protected Identification Key and over 99% of 1099-Gs do; dropping whole-imputes and reweighting leaves 80% of the sample. Then compute one number. In 2010, 47.7% of administrative ui recipients told the asec they had no unemployment that year — a false-negative rate for U.S. unemployment measured against an external benchmark, the first of its kind. The closest precedent is Swedish administrative data, where the equivalent failure rate is 10%, rising only to 16% at a ten-year recall.
The error runs in the direction that hurts twice. The interesting part is not that half the recipients said no. It is what they said instead. Of the misreporters, 31% reported zero weeks worked and no job search — out of the labour force entirely, which is strange for people who had to certify an active search to get paid. Another 16% reported working part of the year. And 53% reported working nearly the whole year, the vast majority of them full-time. On stage: “In the cps of the 48% never unemployed, 69% work during the year and 53% said they worked full year” [05:22:38]. This is not a fuzzy boundary case between unemployment and non-participation, the place measurement people expect trouble. It is a flat contradiction with a tax form the respondent received in the mail and carried onto a 1040. And because the same answer that takes a person out of U puts them into E, the survey overstates employment and understates unemployment with a single stroke, which is why a paper about the unemployment rate turned up at a conference about counting the employed.
You can also close the obvious escape hatch, which is that people simply cannot remember last February. The sipp, with a four-month recall window instead of twelve, three interviews covering the year instead of one, and a design that tries to reach each household member rather than take a proxy, gets 43%. Shortening the recall buys you five points.
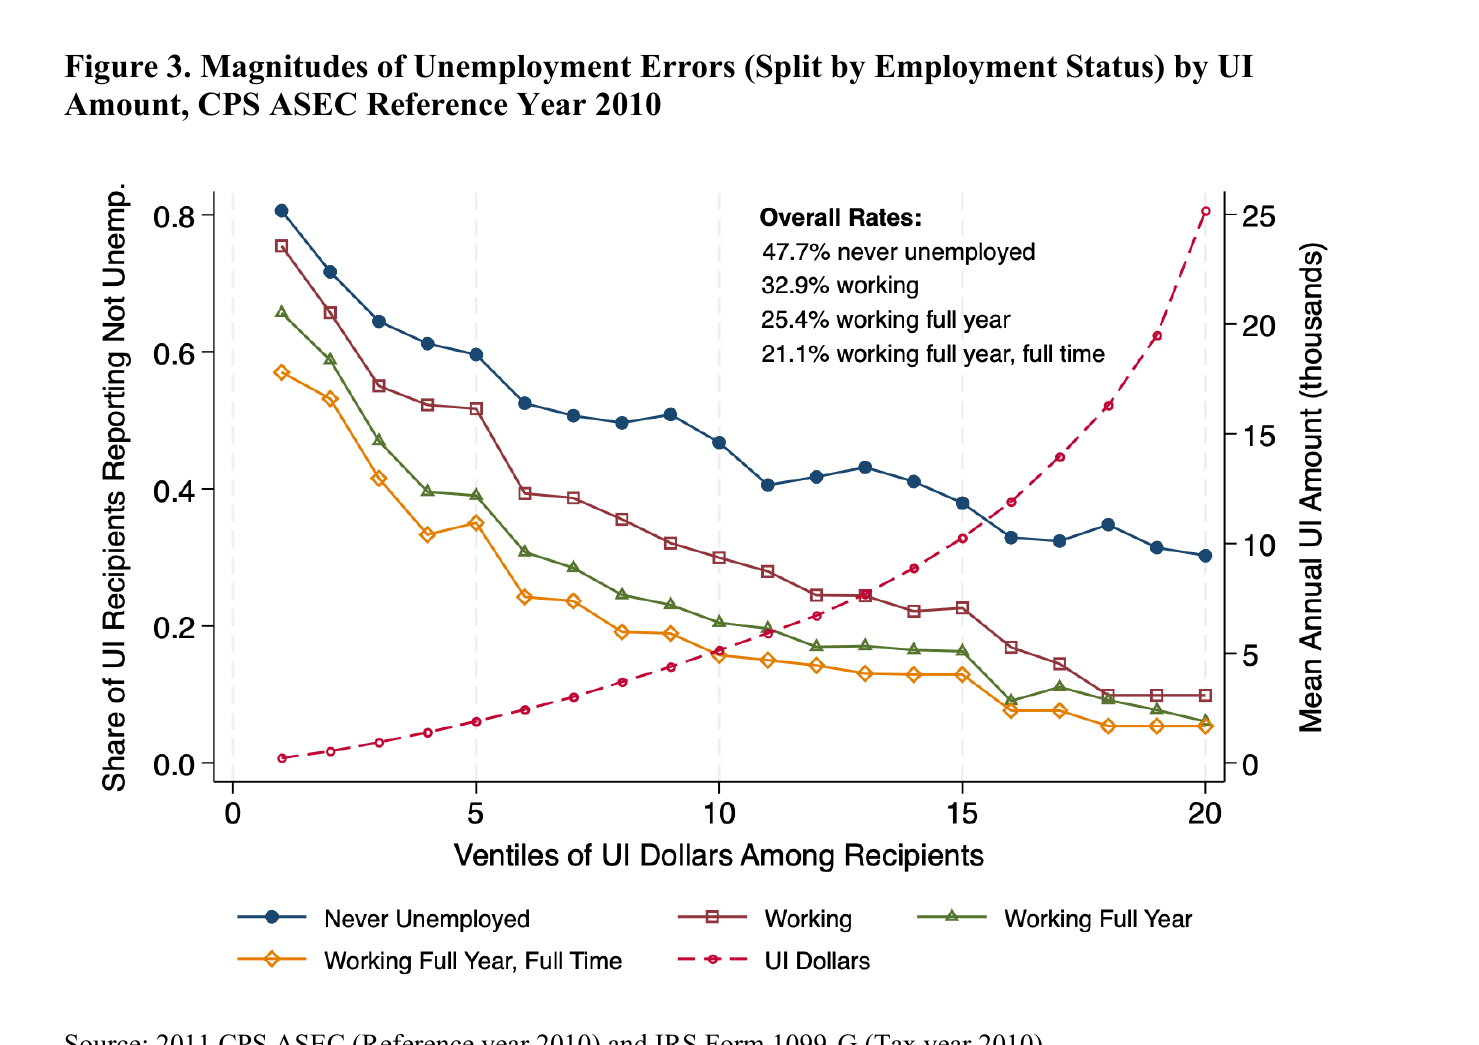
What predicts forgetting is money. Sort recipients into twenty bins by benefit dollars and the bottom ventile — mean receipt around $500 — reports no unemployment over 80% of the time, while the top ventile, at around $25,000, still manages about 30%. Salience, in other words: a small cheque does not organise your memory of the year. Note where that gradient points. Non-recipients got nothing at all, never filed, never certified a search. The paper leans on this; hold the thought.
The bridge, and then the correction. The asec is a supplement to the monthly cps, fielded to the same people, so the errors should travel. But the load-bearing argument is arithmetic. Build a retrospective annual rate from the asec — aggregate weeks unemployed over aggregate weeks in the labour force — and it tracks the annual average of the official monthly rate over 1975–2023 with a correlation of 0.99, the official rate running about 20 percent (roughly one percentage point) above it, with no secular trend in either the ratio or the difference, “though the difference varies procyclically.” That stability is the whole permission slip: fix the annual rate in percentage points, carry the same percentage points to the monthly rate.
The fix itself is an accounting identity with one new number in it. Split weeks unemployed into incidence times mean duration, separately for ui recipients and non-recipients, and correct incidence only — the labour-force denominator is left alone, since most of the misreporters claim to be employed, so the repair moves people from E to U and leaves lf where it was. Then rescale:
where is the count of ui recipients who report some unemployment in the linked data and is the share reporting none (0.477 in 2010). The draft is candid that this “is equivalent to treating each ui recipient as being unemployed in the year of ui receipt.” In 2010 the factor is 1.91: 9.3 million reporting recipients become 17.8 million, and the annual rate goes from 8.3% to 11.6%.
Then comes the step everything turns on, and it is an assumption, stated as one. The paper applies the same 1.91 to the 15.4 million unemployed who never received ui: “We cannot identify underreporting among non-recipients… A conservative correction (in terms of providing a lower bound on revised unemployment counts) would also assume that . This assumes that underreporting of unemployment among non-ui recipients is the same as ui recipients.” Conservative because the gradient says the least-salient recipients misreport at over 80%, and non-recipients are the limiting case of low salience. Meyer put the trade-off the same way from the podium: treating every recipient as unemployed is “a little bit aggressive,” but “on the other hand we apply that same factor to non-recipients for whom it appears that unemployment is less salient” [05:29:23]. He mentioned the alternative, setting non-recipients to the bottom ventile’s 80.6%, only to say he would show none of it: those results “would go and make the corrections much bigger” [05:30:19]. That move takes 2010’s annual rate to 16.0%. Finally subtract false positives — people who claim unemployment and had none — at 2.70 percentage points:
with the mean reported weeks unemployed in each group and total weeks in the labour force, held fixed at 7.71 billion. The second expression is the carry to the monthly rate, and it is where the room pushed. The 2.70 deserves a look too: it comes from Poterba and Summers (1986), who found false-positive rates of 0.54% among the employed and 0.64% among those out of the labour force, giving 0.864% of the 1981 labour force misclassified as unemployed — then inflated by 47.7/15.2, the ratio of this paper’s false-negative rate to theirs. So the false-positive allowance is a forty-year-old number scaled up on the premise that false positives grew in proportion to false negatives, which the draft asserts and does not defend. It is the smallest term in the chain and the least anchored.
Net for 2010: annual 13.3%, a correction of +5.0 points, and the official monthly rate goes from 9.6% to 14.6%.
For every year outside 2010 the draft has no linked data, so it builds a proxy out of public-use answers: the inconsistency rate, the share of respondents who say they received ui and also say they had no unemployment — a self-contradiction inside a single questionnaire, visible back to 1987. It runs from roughly a quarter to more than a half of survey recipients, is procyclical (lowest in recessions, highest in expansions), and has roughly doubled since the early 1990s. The 2010 linked rate sits a near-constant distance above it, which is the justification for pegging one to the other, either by holding the additive gap fixed or the proportional one. 2020 and 2021 are dropped, sensibly: pandemic programmes paid people who were outside the cps definition of unemployment, search requirements were waived, and improper payments ran to roughly 25% of dollars.
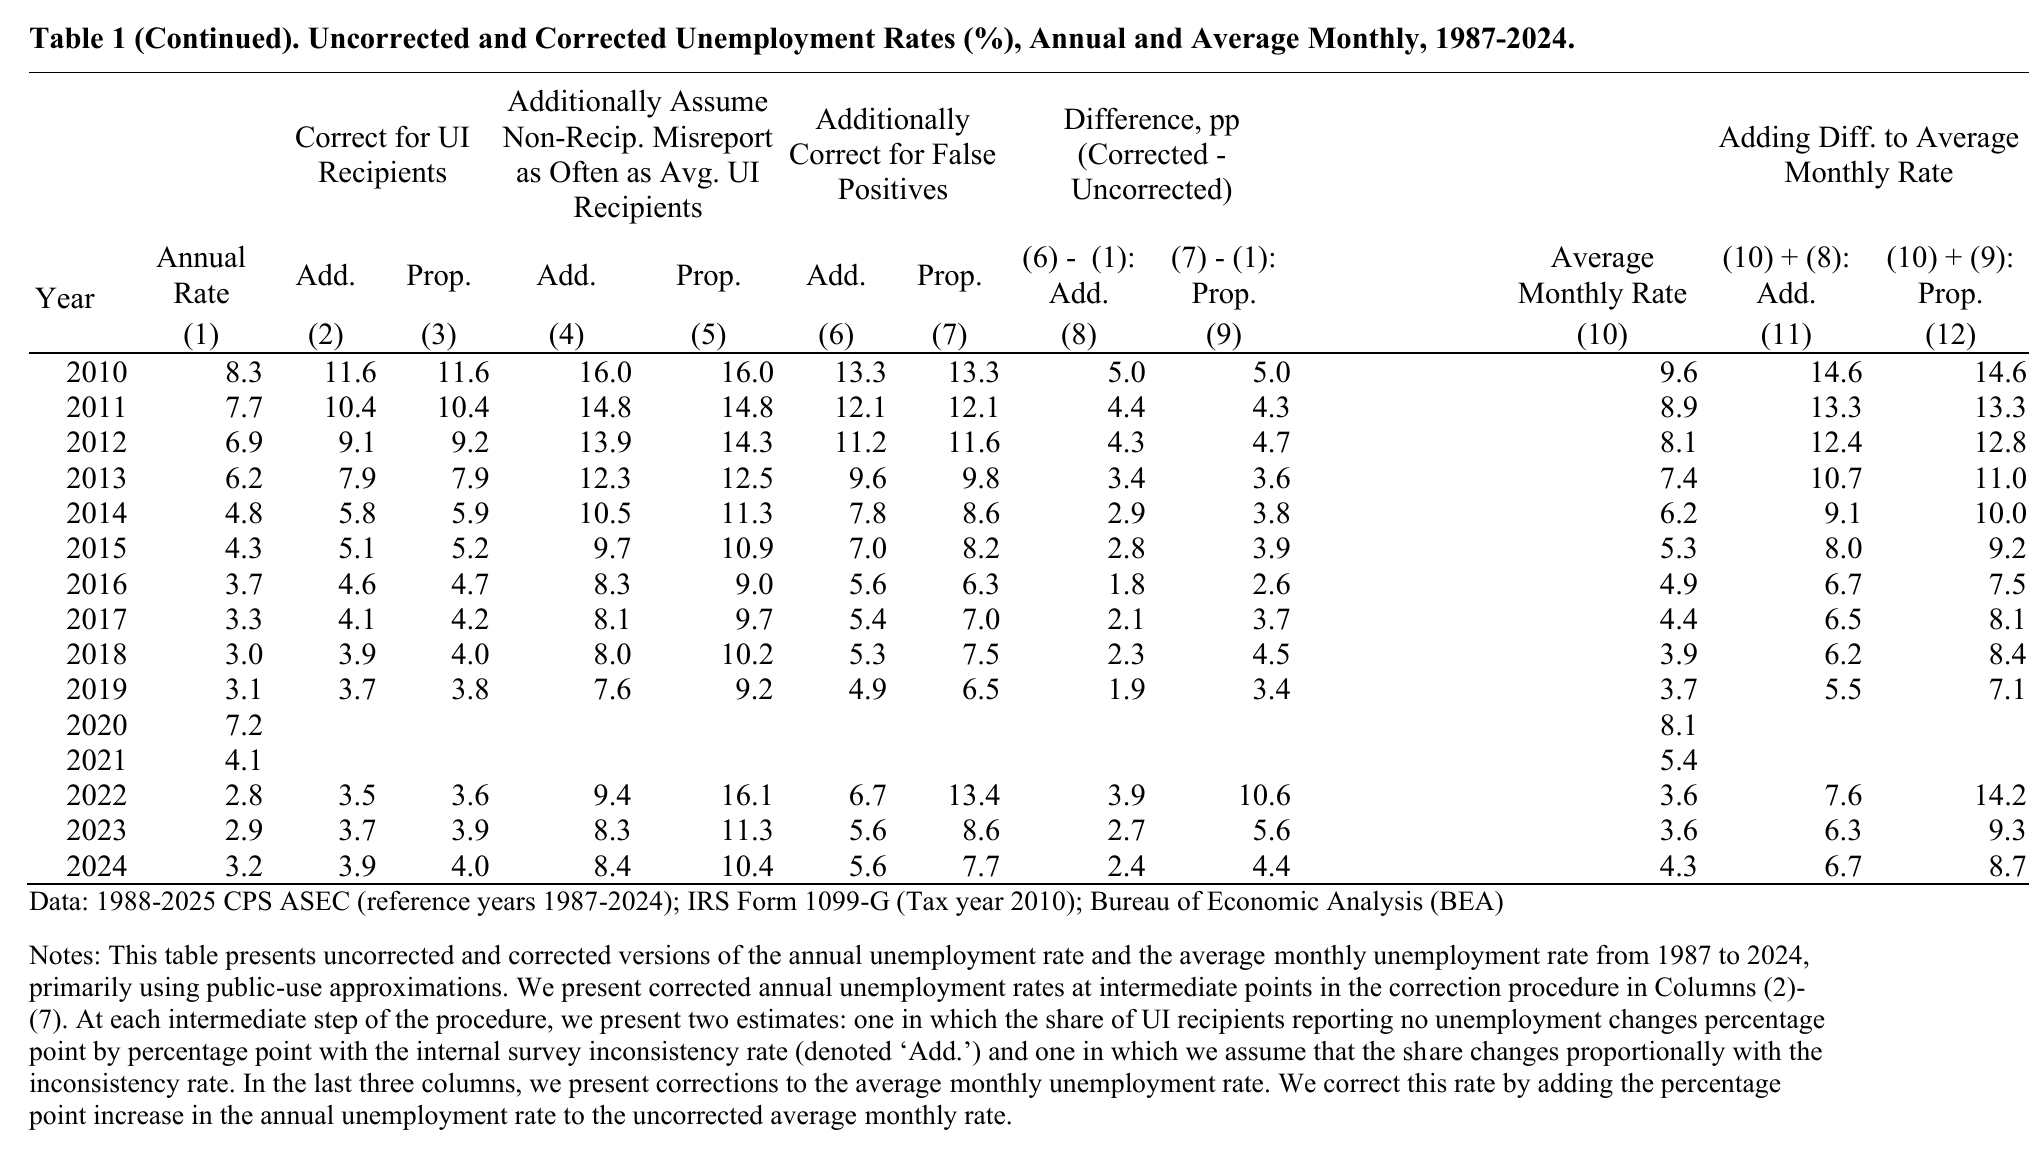
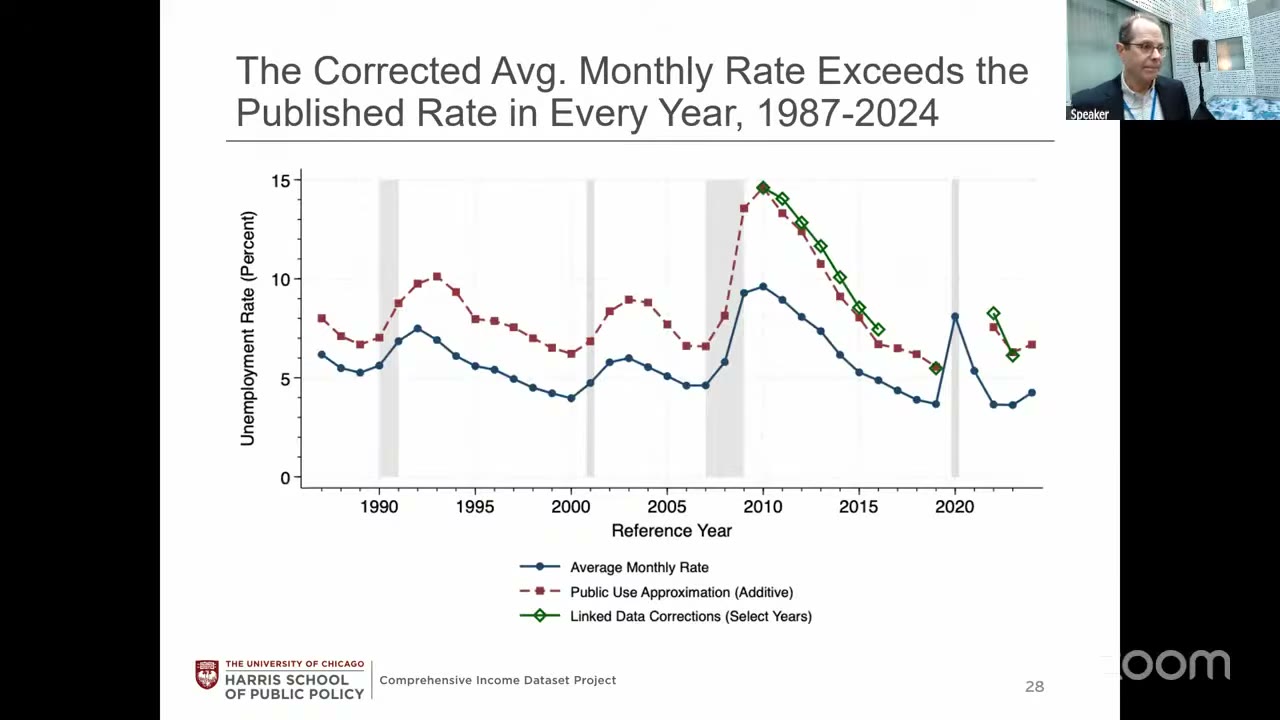
What that does to the picture. Unemployment is understated in every year from 1987 to 2024 under both extrapolations. The additive version puts the average correction at 2.7 points, ranging from 1.4 (1990) to 5.0 (2010), with the corrected rate averaging 1.48 times published and never falling below 1.25 times. The proportional version averages 3.7 points and 1.72 times. The claim is not only about level. In percentage points the correction is biggest in recessions; relative to the published rate it is biggest in booms and has been growing. At the end of the 1990s expansion and again in 2018–19 the published rate sat at 3.7–4.0% with corrections of 1.9 to 2.3 points; in 2022 and 2023 the published rate was about 3.6% and the corrections were 3.9 and 2.7 — same measured slack, more implied bias — and four of the six largest ratios in the series fall in 2018 or later. Cyclically, 2007 to 2010 the published rate rose 5.0 points and the corrected rate 8.0. One number to hold at arm’s length: 2022 has the highest inconsistency rate in the sample, and there the two extrapolations disagree wildly — a correction of 3.9 points additive against 10.6 proportional, the latter putting corrected 2022 unemployment at 14.2% against a published 3.6%. That is the most fragile figure in the paper and it is a pure artefact of which pegging rule you pick.
Crossley’s six, and the argument he was actually making. Thomas Crossley discussed both Session 6 papers and was generous about this one: “another really important paper from Bruce and his co-authors. I find it very convincing… It’s a worrying finding for sure, but what I like about the paper is it’s constructive” [05:42:43]. Then he said he had spent the previous few days learning what a 1099-G is, and found “a lot of reasons” you could hold one without having been unemployed. The form is on a cash basis, so you can file at the end of one year, get paid in the next, be employed throughout that next year, and still receive the document. Some states run short-time compensation, paying benefits to people who lost hours rather than jobs. Other programmes land in the same box — disability as a ui substitute, which is exactly why the authors drop California. There is claimant fraud. There was a surge of identity theft targeting ui in 2021, in which people who were never unemployed and never filed received 1099-Gs anyway. And when overpayments are repaid, the 1099-G often is not corrected.
He then declined to argue any of them were big, which is the sophisticated move: “All of these are small… do a lot of small things add up to something that’s not quite as small? And in particular, many of these things change over time. There was a spike in identity theft, fraud moves over time. The cash basis problem was particularly acute during the pandemic because states got really behind on processing” [05:44:52]. Conclusion: “these things won’t make the main result go away, but they could change the sort of cyclical pattern” [05:45:20]. Note what that is aimed at. Not the level, which is the headline; the trend and the cyclicality, which are two-thirds of the paper’s own title. The draft’s validity section does bound three of the six — short-time compensation at 9.1% of compensated weeks, other programmes by excluding states, fraud via the Labor Department’s audit programme, where the causes plausibly reflecting fraud were 2.5% of 2010 dollars. It says nothing about the cash basis, the identity theft, or the uncorrected repayments. Crossley also handed over one point in the authors’ favour: imputing non-recipients from recipients “goes exactly the other way… probably that means that Bruce’s and his co-authors’ numbers are too low” [05:46:45]. On the asec-to-monthly leap he was unresolved rather than opposed, flagging the supplement’s gate questions — did you do any full-time work at all last year, did you spend any time looking or on layoff — where a wrong answer means you never reach the how-many-weeks question at all.
Abraham’s objection is the one that bites. Katharine Abraham conceded the finding and refused the inference: “it’s very clear that the annual asec numbers miss a lot of people who were unemployed at some point during the year. But where I really have trouble making the leap is from that to saying that the monthly unemployment rate is similarly biased” [05:48:29]. The bridge is that the annual and monthly series track — “but that sort of assumes that the reported durations are right” [05:49:27]. They are not. When someone moves month to month in the cps from out of the labour force into unemployment, they should report zero to four weeks of unemployment, “but they often say things like, oh, I was unemployed 24 weeks or whatever” [05:49:36]. So: understate incidence, overstate duration, and the annual rate lands on top of the monthly rate anyway, from two errors cancelling. “That could be because the monthly unemployment rate is right and the annual unemployment rate is reflecting two offsetting errors” [05:49:57]. Verdict: “I could be convinced, but at this point I am not.”
Meyer had a minute and spent all of it on her. First, that reasoning from questionnaire design is unreliable — everyone expected the 1993 cps redesign to push the unemployment rate up and it went down. Second, the direct rebuttal: “the proof is in the two measures lining up, having a correlation of 0.99 and almost a fixed difference over time. And Catherine’s comment was that assumes that the durations are right? No, it’s a check on them being right. Or at least the bias in them being constant over time. Because the fact that they line up says that either the durations were right or differed by a constant such that it leads to a constant difference” [05:56:06].
That is a real argument and it does not close the door. A stable offsetting-error structure is precisely what Abraham posited; the 0.99 rules out a duration bias that changes, not one that sits there. And the draft’s own text concedes that the annual-monthly difference “varies procyclically” — which is the exact dimension the title claims. Meanwhile a questioner from the Federal Reserve Board offered a cheap internal test nobody has run: asec respondents in waves five through eight have their own prior-year monthly answers on file, so you can check directly whether people recorded as unemployed in the basic monthly fail to report it the following March. He also proposed a concrete culprit — temporary layoff, which people may experience as continuous employment, and which is only about 12% of the unemployed in a given month but a much larger share of everyone unemployed at some point across a year, so it “could actually be accounting for the very large magnitude you’re finding.” Another Fed questioner asked whether the misclassification runs employment-to-unemployment or unemployment-to-non-participation, and what causes it — shame at a failed job search, or genuine ambiguity about what counts as active search — since the remedy differs. The clock ran out. None of Crossley’s six, neither Fed question, no answer.
Which leaves the honest position roughly where Crossley put it: convincing evidence of an important problem, from a paper whose magnitudes will keep moving. Meyer volunteered the three loads himself before the discussant could reach them — that the 1099-Gs record unemployment accurately, that non-recipients underreport like recipients, and that reported durations are unbiased and extrapolable. All three are exactly what the room went after. The kicker is the number that was still in disclosure review the week before: in 2010, 48% of ui recipients told the survey they had no unemployment; the slide put 2023 at 64% [05:15:54], which is in no version of the written paper. If that holds, the instrument has been getting worse during the years everyone has been reading its output as evidence of a tight labour market.
(There is a minor grace note in the provenance. The draft says the authors are “planning to disclose results excluding California,” which means the 47.7% printed in the paper probably still has California in it, while the talk’s 48% presumably does not. Two numbers, one rounding apart, that are not quite the same number. In a week-old draft that is not a flaw; it is a timestamp.)