Notes on:
Monetary Policy, Bank Fragility, and the Modern Financial Intermediation
Annual Review of Economics
13 July 2026
monetary policy · banking · shadow banks · financial stability
Paper · doi · PDF
Made with AI: Opus 5.5 (reading and writing), GPT 6-Sol (reading), Fable 5.1 (adjudication), GPT 6-Astra (verification)
Gregor Matvos, Tomasz Piskorski and Amit Seru · Annual Review of Economics, 2026 (18:263–81) · a review essay · pdf-only digest (no talk found) · version used: the published version
Banks are the fragile part, and they are also the smaller part
Matvos, Piskorski and Seru’s review of monetary policy and bank fragility makes two arguments, and the interesting thing is how they fit together. The first is old: banks are fragile. The second is that banks no longer do most of the lending. Put those side by side and you get a slightly uncomfortable conclusion. The part of the system that breaks when rates move is also the part that policy has traditionally been modelled as working through, and it now intermediates maybe a third of credit.
Start with the fragility, which the review states briskly because everybody in the room already believes it. A typical us bank funds about 90% of its assets with debt, mostly deposits, and about 10% with equity (the authors cite Jiang et al. 2020). Nonfinancial firms run debt-to-assets of 25–35% (occ 2021, the one number in the piece that doesn’t come from the authors’ own papers). The bank then lends long at fixed rates and borrows short and callable, often without much hedging. So when the Fed raises rates, the bank’s assets lose value and its funding costs rise at the same moment, and with 10% equity a moderate markdown eats a large share of the cushion.
The review’s contribution to this half is the “solvency run.” Diamond–Dybvig runs need illiquid assets. The Jiang et al. (2024) runs don’t. Their model “shows that interest rate increases can trigger self-fulfilling runs by uninsured depositors—even when banks’ assets are fully liquid and banks have strong deposit franchise value in the absence of runs.” The phrase doing the work is in the absence of runs. The standard defence of banks’ rate exposure, Drechsler, Savov and Schnabl (2021)’s “maturity transformation without interest rate risk,” says the deposit franchise hedges the asset side: when rates rise your bonds fall, but you keep paying depositors roughly nothing, so the franchise gains value. That’s a fine hedge right up until the depositors leave. Then the franchise is gone at exactly the moment you needed it. The hedge pays off only in the equilibrium where nobody runs, which is a strange property for insurance to have. The authors add that even in the no-run equilibrium DeMarzo, Krishnamurthy, and Nagel (2024) find the franchise falls as rates rise for most banks, and that past some level of losses insolvency is the unique equilibrium anyway. Applied to 2022, Jiang et al. estimate that higher rates cut the market value of us banking-system assets “by up to $2 trillion” relative to book. That’s an asset-side number: the review gives no offsetting liability figure, and it describes the run risk as present “in a significant subset of us banks,” not all of them. So this is svb written up as a model, and the model is careful about how many svbs there are.
Anyway, the banks shrank
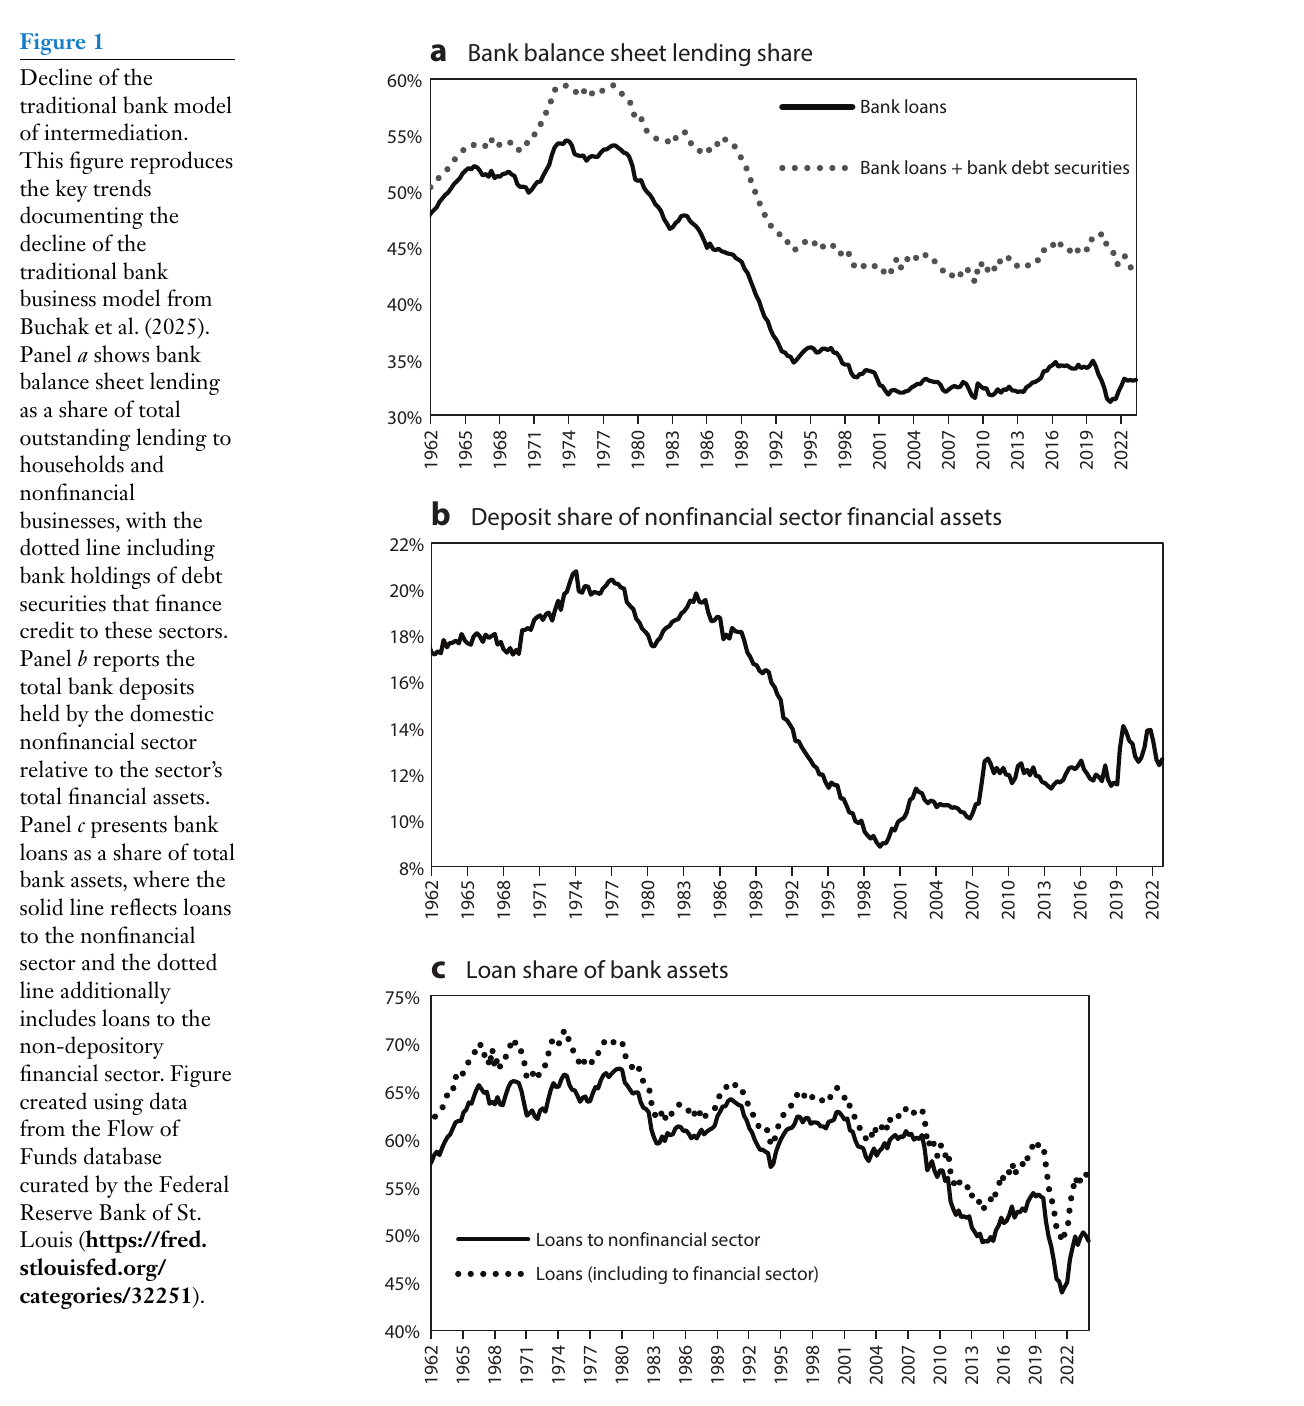
The second half rests on Figure 1, taken from Buchak et al. (2025). The share of lending to households and nonfinancial businesses held on bank balance sheets went from about 55% in the early 1970s to about 33% recently. Deposits went from 21% of the nonfinancial sector’s financial assets to 13%. Loans went from 70% of bank assets to 55%. Two things about those endpoints are worth knowing, and you can read both off the chart. The 21% is the 1974 peak, not the 1962 start (which was nearer 17%). And most of the fall in bank lending share had already happened by the early 1990s. Since then the line has wandered between roughly 31% and 36%. That looks less like an ongoing decline than like one big break followed by a new normal, although the new normal is still the one that matters for policy today.
What the banks did with the space is the more interesting part. They didn’t simply get smaller. They moved from making loans to holding securities issued by the originate-to-distribute sector, and to lending to nonbanks through warehouse lines, repo and credit facilities. The abstract says nonbank intermediation is “now involved in most lending,” and that’s the right verb. Banks are still involved in that lending, just not as the balance sheet that holds the loan.
Six ways for credit to go somewhere else
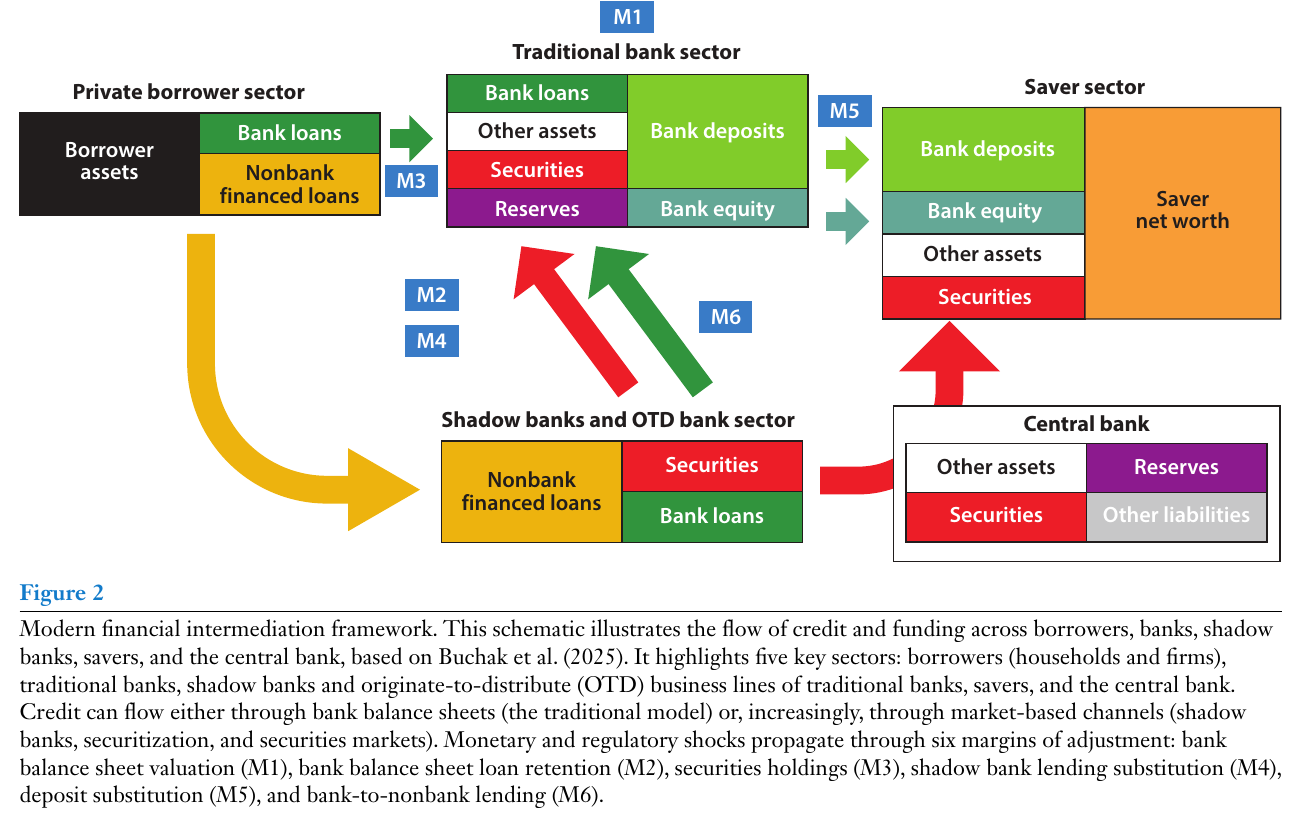
Figure 2 is the organising picture. It shows five sectors (borrowers, banks, shadow banks and banks’ own otd lines, savers, the central bank) and six margins along which a shock can move. The Kashyap–Stein (2000) bank lending channel is one of them, roughly: rates hit bank equity (M1, valuation), and a bank with less equity lends less. The other five are the reasons that story overstates the effect on total credit. A bank short of capital can sell its loans instead of cutting origination (M2, retention), and Buchak et al. (2025) find banks behave “more like shadow banks after negative capital shocks.” It can switch between loans and securities (M3). Nonbanks can pick up the standardised, securitisable lending the bank drops (M4), though not the relationship lending. Savers can move from deposits to money funds and etfs (M5), and when they do, their money often keeps funding loans through the securities market, so the review concludes that the aggregate effect of deposit outflows on lending is “far more modest” than it looks. And banks lend to the nonbanks directly (M6).
The model underneath, Buchak et al. (2025), is described only in words. Savers choose between deposits and securities, which are imperfect substitutes. Borrowers choose between information-sensitive bank loans and information-insensitive debt securities, also imperfect substitutes. Only banks can offer deposits and information-sensitive loans. Market power opens a wedge between what borrowers pay and what savers get, and it passes into deposit rates only partly. From that, the headline result: “under current conditions, bank balance sheet size is driven more by saver demand for deposits than by borrower demand for loans. Marginal increases in deposits are often invested in securities funding informationally insensitive lending rather than in new bank loans.”
That’s the weird true story, and the hedges are the authors’ own. Under current conditions, the size of a bank is set more by how much people want to hold deposits than by how much anyone wants to borrow from it. The marginal deposit often doesn’t become a marginal loan. It becomes an mbs, which funds a loan somebody else originated. The bank is partly a deposit-services business that invests its float in the same securities you could have bought yourself, and the paper says so fairly directly: banks “can invest in securities even when they earn the same returns as other savers.” (This is a claim about today’s equilibrium, not a law. In the rate-cut counterfactual, the new deposits fund both new bank loans and securities.)
What that does to policy
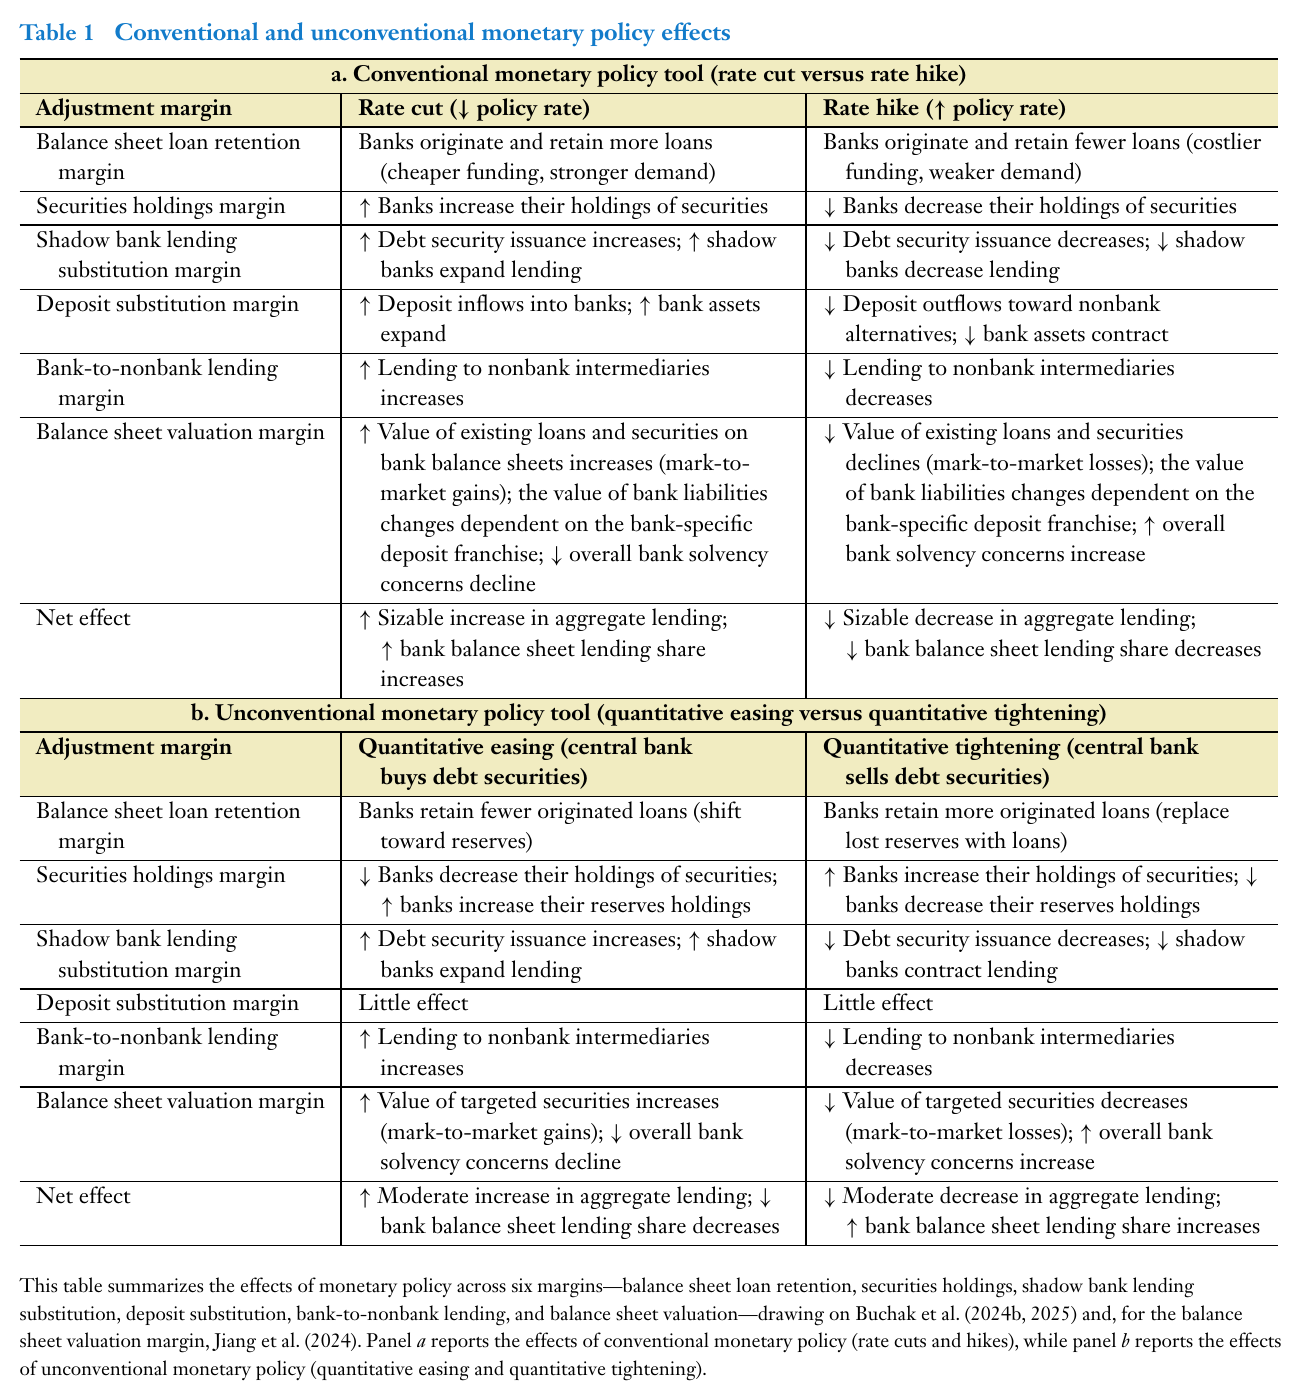
Table 1 runs the counterfactuals, and it contains signs and adjectives only, no magnitudes. For a rate cut (modelled as a shock to both the benchmark rate and the rate on reserves) everything points the same way. Banks retain more loans, hold more securities, and take in deposits because deposit rates fall by less than market rates. Debt issuance and shadow lending rise, and mark-to-market gains shore up equity. Net effect: a “sizable increase in aggregate lending,” with the bank share rising. A hike is the reverse. So for conventional policy the margins, in the authors’ words, end up “amplifying the initial policy move,” which is worth holding onto, because the conclusion later says shadow banking “blunt[s]” monetary policy. Blunting describes capital shocks and qe. For rate moves, the review’s own table says amplification.
qe is where the saver-driven balance sheet pays off. The central bank buys mbs, and when it buys them from banks it pays in reserves. The bank swaps one asset for another, so the balance sheet doesn’t get any bigger. mbs yields fall “substantially, in line with historical estimates,” so securitised origination and shadow lending expand, and banks lend more to the nonbanks doing it. Deposits barely move. Net effect: a “moderate increase in aggregate lending” and a fall in the bank share. The policy that was supposed to repair bank lending mostly moves origination into capital markets. qt runs the other way: a moderate fall in lending, and credit returns to bank balance sheets as banks refill their lost reserves with loans. The authors note that real qe and qt come bundled with rate moves, so these are isolated pieces rather than predictions for any particular episode.
Regulation gets the same treatment, and here the two halves of the paper finally meet. Banks are the fragile part: nonbank lenders carry capital buffers more than twice as large (Jiang et al. 2020), and bank equity holders “may be reluctant to recapitalize or insure against” rate risk. Banks are also only about a third of lending. So tighter capital requirements should cut total lending only modestly, mostly shifting where the lending happens, while making banks less likely to amplify a tightening through insolvency or fire sales. The authors want stress tests to include rising-rate and stagflation scenarios and to cover regional banks. Jiang et al. (2025) find that in the current environment rate risk threatens banks more than credit risk, “potentially creating a bank stability constraint on monetary policy.”
Where a skeptic would push. Nearly every quantitative pillar here is the authors’ own coauthored work, and the policy table reports only signs and “sizable” versus “moderate,” so the magnitudes are taken on trust. More substantively, the argument that capital requirements are cheap because lending moves to nonbanks sits a few pages from M6, where banks fund those same nonbanks through credit lines that get drawn in a crisis (as in 2008). The review states both halves and never reconciles them. Moving the lending outside the perimeter may just give the risk a longer route back to the banks.
So the review’s picture is that the fragile institution is also the one monetary policy acts on most directly, and it’s no longer where most of the credit is. You can make that institution much safer without shrinking credit much, according to the authors, and the main effect of doing so is that more of the credit ends up somewhere you’re watching less closely.