Notes on:
Informal Redistribution Through Work
CEPR Discussion Paper DP19833; forthcoming, Econometrica
2 July 2026
Uganda · informal insurance · field experiments · labor markets · social norms · firm productivity
Paper · PDF · Appendix
Made with AI: Haiku 4.5 (research), Opus 5 (reading, adjudication, figures, diagram and writing), GPT 5.6-Sol (reading), Fable 5 (adjudication), GPT 6-Astra (verification)
Elisa Macchi (Brown University) and Jeremia Stalder (University of St. Gallen), “Informal Redistribution Through Work,” forthcoming in Econometrica and circulating as cepr Discussion Paper DP19833. There is no public recording of a talk on this paper, so this is read from the paper alone — the July 2026 Econometrica manuscript and its online appendix.
You run a grain mill on the outskirts of Kampala. There is no unemployment insurance, no public pension worth the name, and a large number of people who know where you work. In this sample, 96% of employers gave money to someone in the past month, and among givers the average gift came to 32.7% of monthly income. That is not philanthropy, it is the social insurance system, privately provisioned, and the premium is about a third of your income.
So far this is the standard informal-risk-sharing setting. The part that isn’t standard is the channel. Asked what rich people can do to share earnings with poor people, over 90% of both employers and workers in this sample say employment; charity and transfers, education, public goods and taxes divide up the remainder in low single digits. Roughly 46% of employers report having given somebody work in the past month specifically to support them financially, and the number barely moves across three survey waves spread over two years — 46.4%, 46.5%, 46.2% — while about 30% say they gave work even when the task was not needed. The employers have their own word for that work, and the paper adopts it: symbolic.
Which is where the measurement problem starts, and the reason the paper exists. The most common redistribution tasks are loading, milling, sealing and weighing; about 40% of them are classified as symbolic by the employer who assigned them; and they are observationally indistinguishable from the same tasks done for real. Nothing in a firm survey separates the worker you need from the worker you are carrying. Lewis said as much in 1954, in the epigraph the authors chose: “The line between employees and dependents is very thinly drawn.”
The design
Anonymous pairs, an uneven lottery, and one question asked twenty-two ways. The employer is asked whether to hire person B for task at wage or hand over a cash transfer ; the worker is asked the mirror question about receiving. Wages run from ugx 500 to 10,000 against a fixed ugx 3,000 transfer, then the transfer runs from ugx 500 to 6,500 against a fixed ugx 3,000 wage, ugx 3,000 being the market rate for a 30-minute task. Choices are private, made before the lottery is drawn, and 5% of pairs are actually paid out with one decision implemented, so this is cheap for the authors and real for the participants. Willingness to pay is the maximum amount by which the wage exceeds the transfer — or the transfer exceeds the wage — at which the respondent still chooses work.
The price grid is doing the identification, because each of the obvious motives implies a threshold. Value the work at the market wage, as the paper conservatively does, and a payoff-maximising employer hires only at ; an altruist hires only at ; someone targeting an equal split also needs . Choosing work at both ends violates all three at once, which is a nice property for a design to have, since it means the interesting result and the null result cannot be confused.
A demand curve with no slope
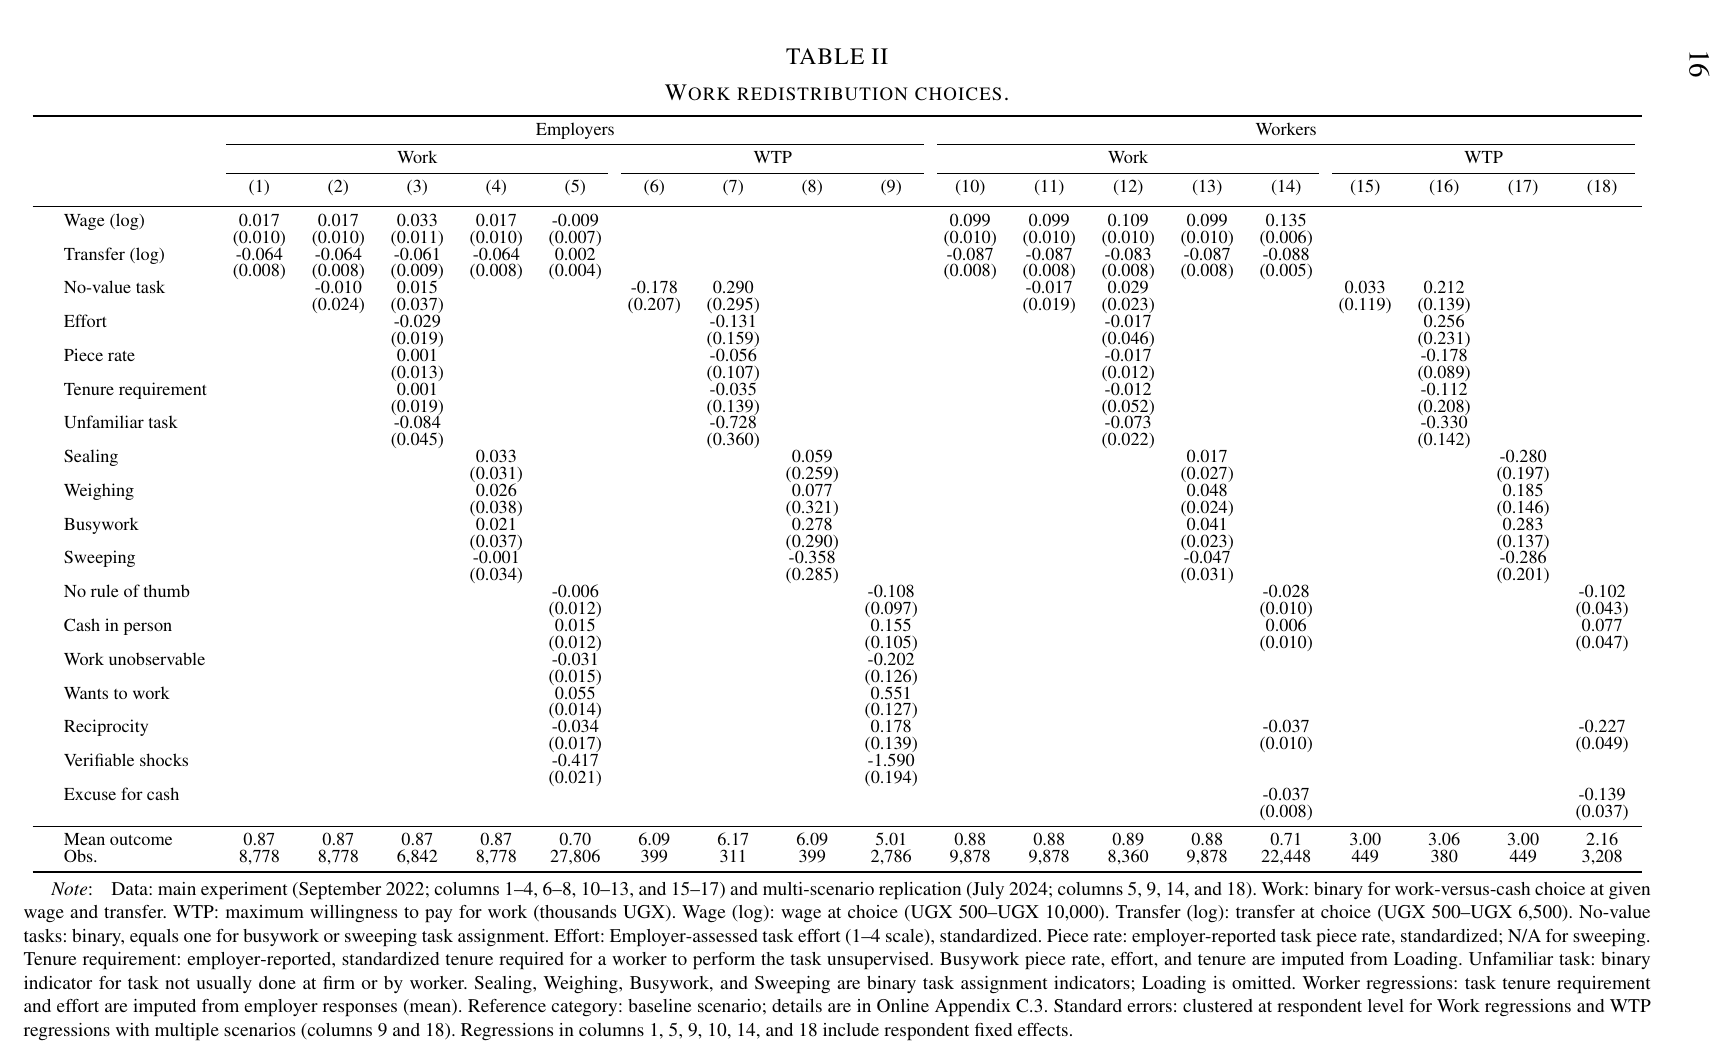
Employers choose work in 86.5% of decisions and workers choose work in 87.8%, a difference you cannot reject as zero (p = 0.389). More to the point, the choice does not respond to price in the way a choice about money should. At ugx 10,000 — more than three times the market wage, against a ugx 3,000 transfer — 79.7% of employers still hire. At ugx 500, where hiring is nearly free, 70.7% hire, which is fewer, giving a locally upward-sloping demand curve that the authors attribute to distaste for paying below the market rate. The wage semi-elasticity of employer work choices is 0.017 (0.010): not just small, but insignificant, over 8,778 decisions with respondent fixed effects. Mean employer willingness to pay for the work channel is ugx 6,085, about twice the market wage and 40.6% of their endowment.
The supply side is, if anything, worse. Offered ugx 500 to work against a ugx 3,000 handout, 57% of workers take the job. Their mean willingness to pay is ugx 3,004, roughly 26% of a permanent worker’s daily earnings, spent on the privilege of being paid less. Asked to explain themselves, 59.1% of employers and 44.9% of workers give the same answer, the modal one on both sides by a wide margin: recipients must work for money and should not get it free. “Money is supposed to be worked for.”
Full price for work that undoes itself
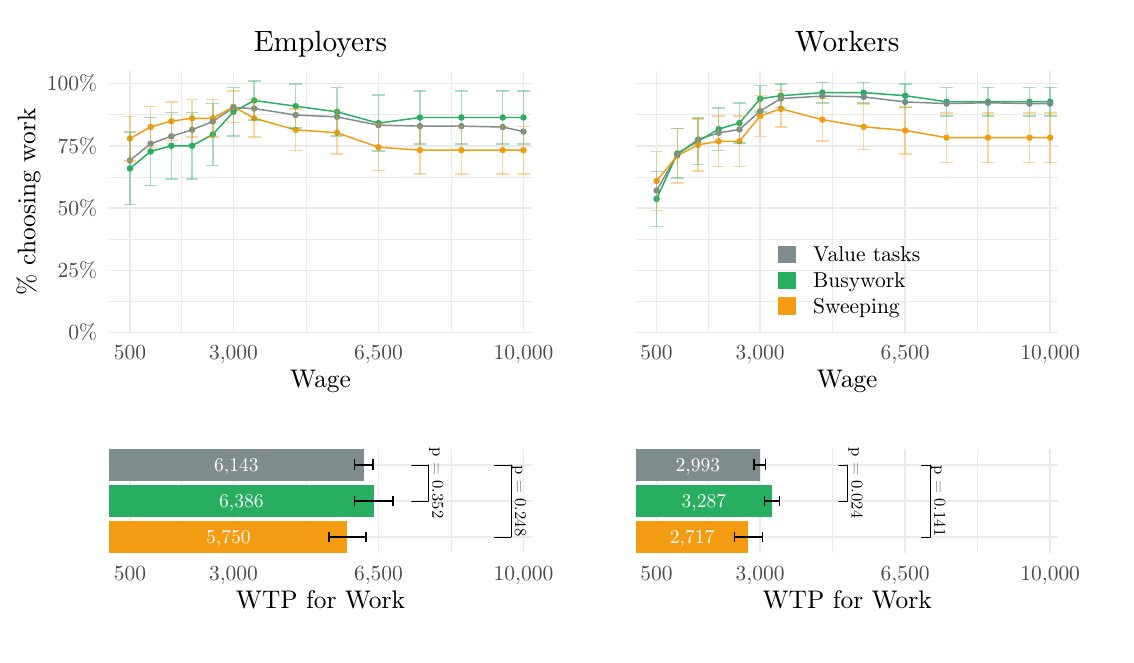
The obvious rejoinder is that the work is worth something. So the authors randomised the task. Alongside the three real ones — loading, sealing, weighing — pairs could draw busywork, defined as loading three sacks and immediately unloading them, which has zero production value but might still let an employer screen or train a stranger; or sweeping, which has almost no value and, being the lowest-skill task in the setting, no screening content either. Sweeping’s own market rate is about ugx 770 per half hour.
Nothing happens. Employer willingness to pay is ugx 6,143 for the real tasks, ugx 6,386 for busywork (p = 0.352) and ugx 5,750 for sweeping (p = 0.248), the last being over seven times what sweeping is worth. And 86.4% of employers will go to ugx 10,000 for a man to load three sacks and put them back, rather than give him a smaller amount of money for nothing. The test is a single coefficient:
Eq. 2 in the paper, where is respondent ’s work-versus-cash choice at wage–transfer combination (or their willingness to pay, in which case the price terms drop out), holds task controls for effort, piece rate, tenure requirement and unfamiliarity, and on the randomly assigned no-value indicator is the entire test. It comes in at −0.010 (0.024) for employers and −0.017 (0.019) for workers. The one task difference that clears significance is on the worker side and points the wrong way for the confound: workers pay more for busywork.
Nor is it about the relationship
That leaves the relational story — you are buying a contact, a reputation, a favour owed. The design already fights this with anonymity and with matching across clusters averaging 15.6 km apart, and the July 2024 replication then switches off the remaining channels one at a time, within respondent, using the strategy method. Make the hiring unobservable by having the task done at the worker’s place: −0.031 (0.015) on employer work choices, adjusted p = 0.291. Equalise networking by having the employer hand the cash over in person: 0.015 (0.012). Re-explain the anonymity and spell out that nobody can come back for more: −0.006 (0.012), adjusted p greater than 0.999. Employer willingness to pay across those three scenarios reads 5,048, 5,329 and 4,938 against a baseline of 5,157.
Two sanity checks deserve mention because they are the ones that would have killed the paper. The ugx 500 transfer floor might have forced giving, making work the cheapest way to comply — so the replication set the floor to zero, and 88.6% of employers still hired at the market wage. And the whole thing might be an aversion to handing over cash, or paternalism about how it gets spent — so 99 employers ran an identical script choosing between food and cash, and chose cash 79.8% of the time. Whatever this is, it is not cash-aversion, and an experimenter-demand story would have to explain why the same enumerators elicited the in-kind answer in one experiment and the cash answer in the other.
The one real crack is on the worker side: re-explaining the privacy rules does move workers (p = 0.021, about 4.5% of their willingness to pay). The authors read it as either minor image concerns or something more interesting — workers expect cash transfers to face 21.1% more informal taxation than earnings, so a wage is money that is harder for your relatives to reach. Even in that scenario, 70.2% of worker choices are still for work.
The switch
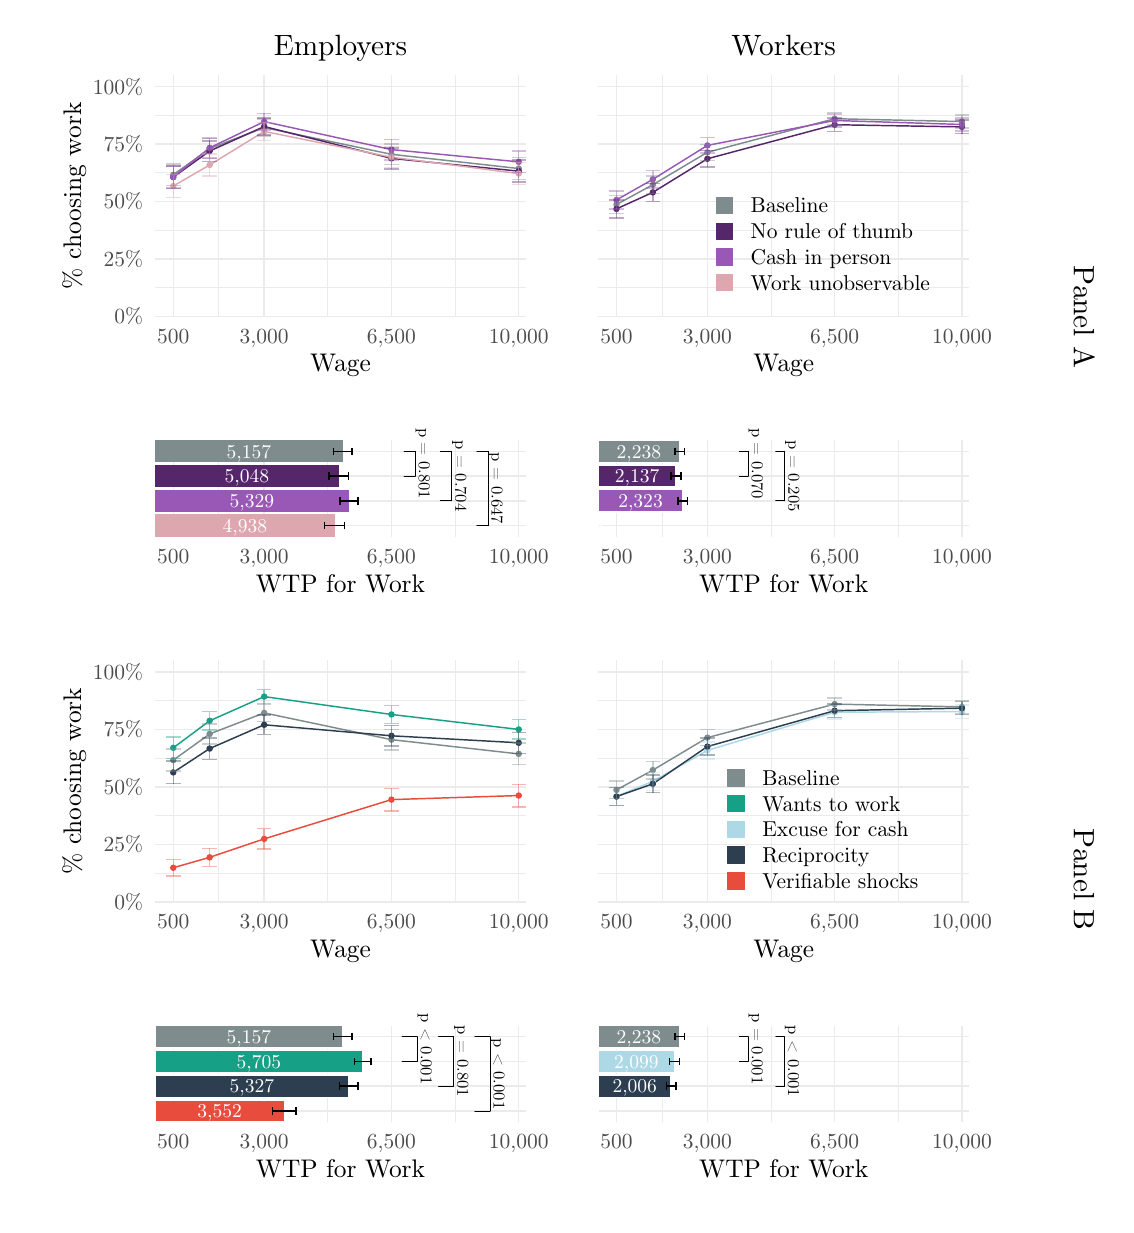
By this point in the manuscript you have a population whose choices refuse to move for a twentyfold change in the relative price of work, for a task with literally zero output, or for the removal of every observer. The natural reading is a deontological rule about earning. Then the authors add one sentence to the script: person B “is in real need of financial help due to unexpected hardships, such as medical emergencies for a relative or funeral costs. Person B is able to work.” Same money, same anonymity, same task. Need is now observable and clearly bad luck, which switches off both of the classical justifications for a work requirement — screening the truly needy when earnings potential is hidden, and deterring dependency when poverty is partly your own doing.
Eq. 3 in the paper: the same outcomes within respondent across the July 2024 scenarios , with respondent fixed effects , errors clustered at the respondent, and each measured against the always-first baseline. Every is small except one. Under verifiable emergencies, only 27.4% of employers choose work where wage and transfer are equal — the paper reports this as a 54.8 percentage point reduction from a baseline of roughly 82% — with an overall scenario effect of −0.417 (0.021) on choices and −1.590 (0.194) thousand ugx on willingness to pay, which falls to ugx 3,552, “equivalent to the market wage.” Their choices then look like plain generosity: they offer work when work is the more generous option, and not otherwise.
So the preference for work was never a preference. It was a conditional requirement, and the condition is exactly the one Nichols and Zeckhauser (1982) and Besley and Coate (1992) derived for a government: impose work when it buys you targeting or incentives, drop it when it buys you nothing. Small-firm owners in Kampala have reinvented optimal workfare without the public-finance seminar. The corroborating result is the one that reads backwards — tell employers the worker has already been pre-screened as someone who chose work over an equal cash transfer, so the character screening is done, and they demand more work, not less: +0.055 (0.014) on choices, willingness to pay up to ugx 5,705. Reciprocity does nothing to them either, even though they predict the workers’ reciprocation accurately.
The workers, meanwhile, are the deontologists. Nothing on their side comes close to a collapse. Letting them send cash back costs about 10% of their willingness to pay (ugx 2,238 to 2,006). The privacy reminder costs about 4.5%. And the most telling lever, because it is pure framing with no change in money, observability or relationship, is a line from Dana, Weber and Kuang’s (2007) moral-wiggle-room playbook: if you take the cash, “you can think of it as payment for work you did for us. We will confirm if anyone asks.” Work choices fall 5% and willingness to pay 6.2%. Give a man an alibi for calling a handout a wage and he will take the handout, which is roughly what a dignity story predicts and not at all what a targeting story predicts.
One honest caveat, since the asymmetry is the paper’s best line and the evidence for half of it is thinner than the other half. The manuscript says workers with verifiable emergencies request work at the same rate as those without (p = 0.830), but that comparison is a self-reported emergency entered as a respondent characteristic in the baseline choices, in the online appendix — there is no randomised verifiable-emergency arm on the worker side. The null is real; it is just not the mirror image of the employers’ −0.417, and should not be read as one.
What this does to the productivity statistics
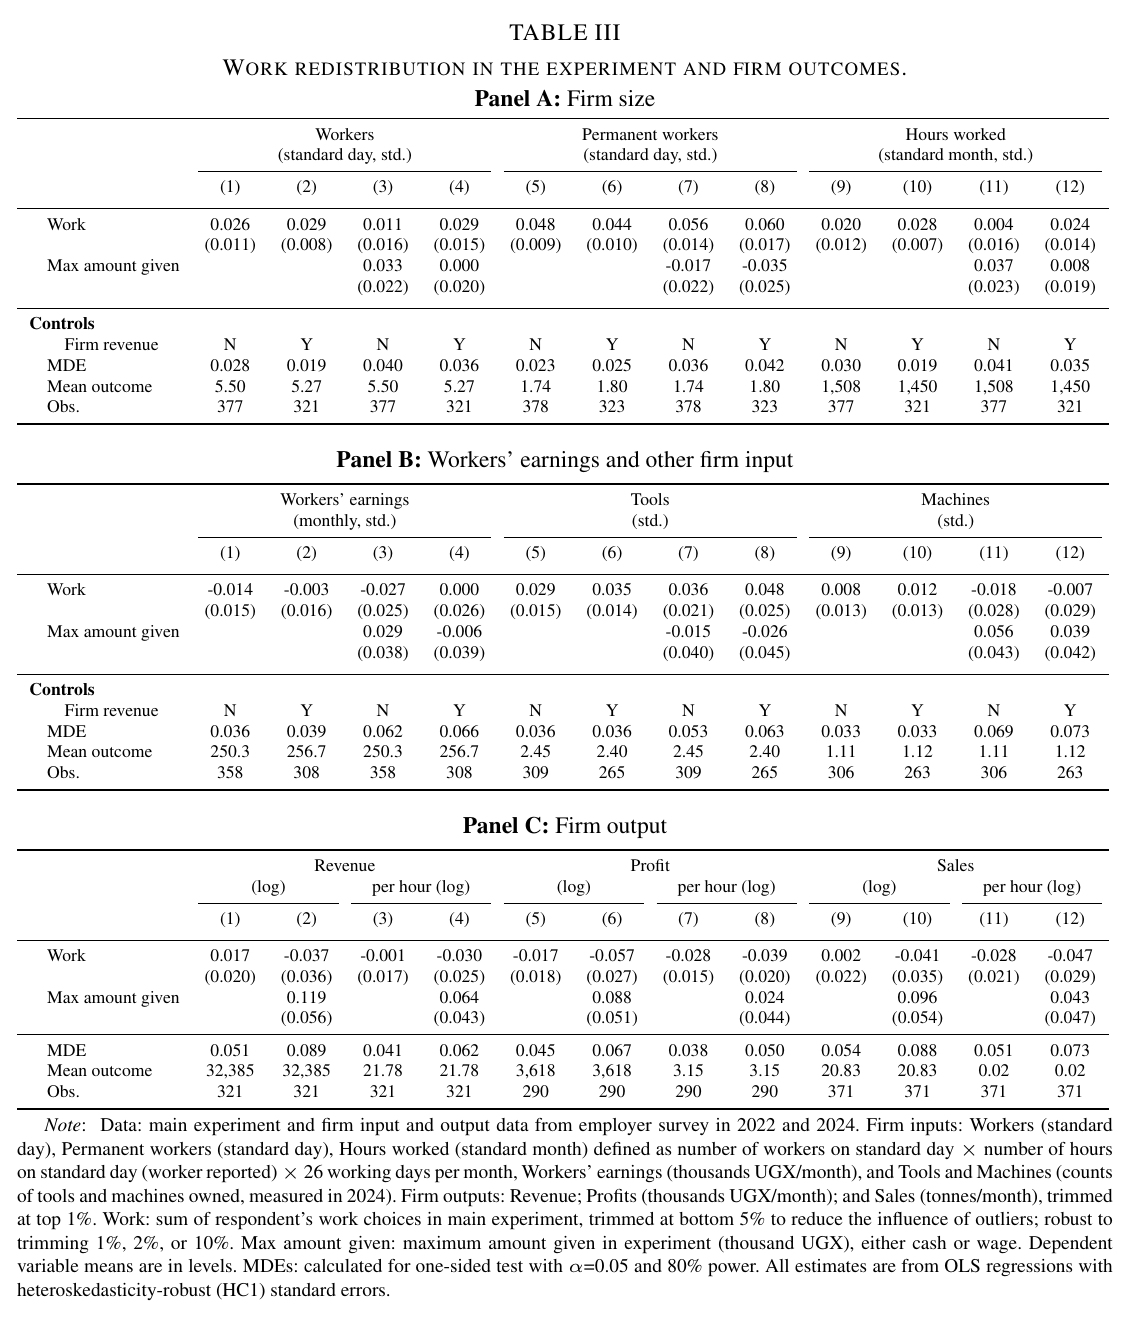
The experimental measure travels. One more work choice in the experiment predicts 0.026 (0.011) standard deviations more workers at the firm and 0.048 (0.009) more permanent workers, on 377 and 378 firms. Controlling for generosity, though, revenue is flat at −0.037 (0.036) log points and profit is −0.057 (0.027), on 321 and 290 firms. The norm shows up in the headcount and not in the output, which is what it would do if the headcount were partly a transfer.
The accounting then sizes it. Among firms that give work, 93.9 hours a month are given to help someone out, of which 55.7 are on tasks the employer calls symbolic or on idle time: 11.2% and 6.0% of total hours, 9.8% and 5.3% of profits. Redistribution workers are paid ugx 2,702 more per hour than standard workers (+71.6%), symbolic workers ugx 3,560 more (+94.4%), and the premium survives controls for role, closeness and skill — which is the answer to the objection that piece rates make overpayment impossible. Across the full sample, including firms that give nothing, observed size overstates effective size by 4.3% to 9.7%, and revenue per observed hour understates effective productivity by 2.8% to 5.1%. Adjust for it and the firms that give work, which look bigger and no more productive, turn out to be more productive by ugx 4,039 per effective hour.
In place of a discussant
There is no talk on this paper and no Q&A, so the pressure points are the ones the manuscript itself names and answers. Section 5 is correlational and the authors say so, conceding that firm revenue “may itself be affected by preferences for redistribution via work, making it a potentially bad control,” reporting everything with and without it and printing minimum detectable effects in every column. The redistribution quantities rest on employers’ own classification of their own charity, which is why they come as bounds, both significant at 1%, and why the estimates come from the lean season when symbolic giving is least common. Sweeping is minimal-value, not literally zero. The sample is grain processing within 30 km of Kampala, and prevalence elsewhere is not established. And the paper explicitly declines to say whether this is a moral norm or a social one, on the grounds that Bicchieri (2016) thinks the boundary is fuzzy, which is either scholarly restraint or the world’s most respectable way of not answering the question.
Lewis assumed all of this in 1954 and moved on. Seventy-two years later it took two field experiments, a strategy-method replication and a task consisting of loading three sacks and immediately unloading them to establish that he was right — and the immediate payoff is that every productivity comparison ever run on firms in this setting has been quietly dividing output by the hours of a welfare state.