Notes on:
Improving Official Employment Statistics: New Insights from Private-sector Data
NBER EMRI conference paper
17 September 2026
employment measurement · payroll data · firm dynamics · small business
Talk · Paper · PDF · Transcript
Made with AI: Opus 5 (reading, diagram and writing), GPT 5.6-Sol (reading), Fable 5.1 (adjudication), Sonnet 5 (verification)
Part of Innovations in Measuring Employment, Fall 2026
André Kurmann and Etienne Lalé have written a paper about the business birth-death model, which is the most-blamed single component of the us payroll number, and the interesting thing about it is that they do not try to forecast it better. They try to stop needing it.
Start from why it exists. The ces does not count jobs; it counts a ratio and then multiplies. Last month’s level, scaled by employment growth among the establishments that reported in both months — a sample that by construction contains no establishment that opened this month and none that closed. Whatever those two populations did has to be put back by hand, and the hand is the net birth-death model, which imputes their net contribution from historical aggregates. This works whenever the recent past resembles the present, which is to say it works precisely when nobody needs it. Kurmann, three minutes in: “the birth-death issue in normal times is not that important… it’s exactly around turning points when birth and death become important. It’s exactly when, as we learned in the pandemic, policymakers, businesses want to know most about what is happening with the labor data.”
You can see where it fails, because the failure is published. Benchmark revisions to the ces first read are large and cyclical — positive in expansions, negative in downturns — and they are almost entirely a service-sector phenomenon. Four supersectors (trade and transport, professional and business services, leisure and hospitality, other services) are 38 per cent of nonfarm employment, and their revisions correlate 93 per cent with total nonfarm revisions; they account for “three quarters or more of the two most recent benchmark revisions and for about 70% of the employment imputed by the birth-death model.” Inside those sectors it is the small establishments doing it: across all of nonfarm, births and deaths generate 30.6 per cent of yearly employment growth, of which establishments under 100 employees are 28.2 points; in the four service supersectors births and deaths generate 54.2 per cent, of which small establishments are 47.6. So the whole revision problem lives in a corner of the economy the size of a rounding error in the sampling design.
A word on what this draft is. The version presented is the 9 September 2026 conference draft,
and it says “Work in progress” on its title page in the ordinary sense and also in a much more
literal one: Section 6.5, which is supposed to contain the implementation, validation and results
of the second half of the paper, consists of the words “Work in progress…” and nothing else, as
does Section 7, the conclusion. Two cross-references in the Section 6 preamble render as
Section ??. The acknowledgements disclose that “portions of this manuscript were drafted with
the assistance of Claude ai,” reviewed and edited by the authors — still unusual to see in print,
and worth noting rather than tiptoeing around. None of this is a knock. It is a conference draft
behaving like a conference draft, presented to a room convened for exactly that purpose, and the
speaker was more forthright about the gaps than the gaps required.
The wedge: an entry is a mixture, and the paper is a splitter
Here is the thing the paper is really about. A private payroll panel has the same birth-death problem as the ces, except worse, and the reason is that the vendor is a business. Homebase sells scheduling and time-clock software to very small service employers. When an establishment appears in the Homebase panel, two quite different things may have happened: a new business opened, or an existing business bought some software. When an establishment disappears, either it closed or it switched to a competitor, or stopped paying, or shut for the season. The observed entry margin is a mixture of a birth and a sale, and the observed exit margin is a mixture of a death and a churned account. Homebase, during the sample period, was growing. So the naive estimator does not merely add noise; it reads a software company’s sales funnel as economic expansion, with a sign and a trend.
Write the recursive estimator so the mixture is visible (eq. 1, p. 9):
where is estimated employment, are qcew-derived weights for cell (industry × size × region), is employment at establishments active in both periods, the employment gained from genuine openings and reopenings, and the employment lost to genuine closings. Set the last two to zero and you have the continuing-establishment estimator the ces then has to patch at the aggregate. Kurmann and Lalé instead estimate them establishment by establishment (eq. 2, p. 9; eq. 3 is its mirror for closings):
Every entrant gets a probability of being a real opening rather than a new customer; every exit gets a probability of being a real closing. Three signals in priority order: the platform-internal self-report first (Homebase now records a company creation date and a self-reported reason for leaving — permanent closure, switched to a competitor, seasonal shutdown); then third-party activity data matched by name and address, with a mechanical rule that spending rising at least 25 per cent over the four weeks after entry marks an opening and falling 25 per cent after exit marks a closing; then, for everyone else, a cell average by quarter, size and sector. The ’s are cell-level adjustment factors calibrated so that implied birth and death rates reproduce the administrative bed and bds rates — a benchmark revision, in other words, but applied at the industry-by-size cell rather than to the aggregate, and inheriting the ces’s own timing problem in the process. Kurmann said so out loud: “these Ts here, you should think of them as they’re lagging… when you know what the bed, beds is, you’re benchmarking, and then you’re using those benchmark values going forward.”
How much of the entry margin is real
Very little, is the answer, and this is the number to carry away.
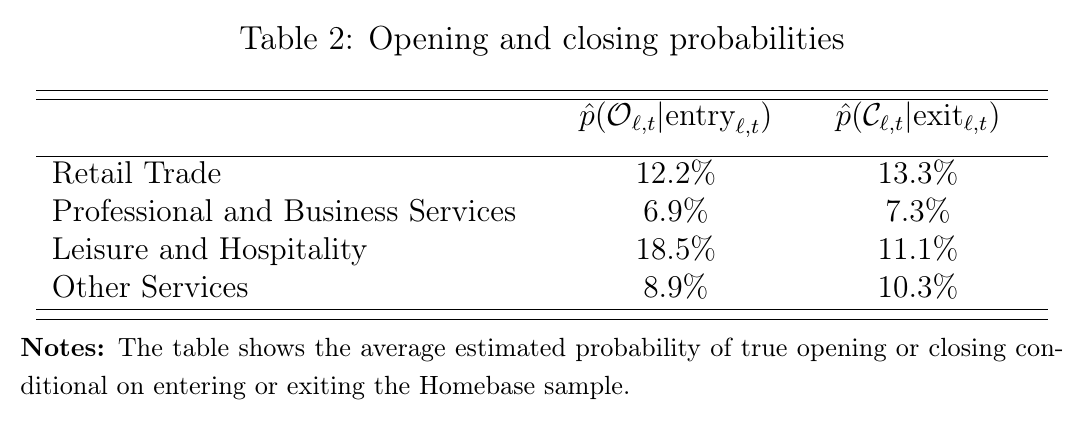
Retail trade: 12.2 per cent of entries are openings, 13.3 per cent of exits are closings. Professional and business services: 6.9 and 7.3. Leisure and hospitality: 18.5 and 11.1. Other services: 8.9 and 10.3. So between 81 and 93 per cent of what looks like business formation inside a payroll panel is somebody buying software. Leisure and hospitality is also the case that kills the tempting shortcut of assuming entries and exits offset: 18.5 against 11.1 is not a wash, and the paper says assuming otherwise “would introduce substantial bias, at least in this sector.”
The churn is not subtle once you look. The mid-February base sample grows from 81,817 establishments in 2022 to 113,909 in 2025; exits without return run 27 to 30 per cent every single year — “far larger than yearly establishment exit rates in official population data” — and new entrants fall from 55 per cent of the base sample in 2022 to 47, then 36, then 26 per cent by 2025. That collapsing entry rate is what equation (4) exists to neutralise: is scaled by the inverse of the sample’s own relative entry rate, so that a doubling of the customer base does not double measured openings, while is held fixed because exit is bounded by sample size. The calibrated factors are large and very uneven — the smallest establishments, one to four employees, need scaling up to 9.71× to reproduce administrative death rates, against 3.33 for the five-to-49 group in the same sector — which is another way of saying the panel is blindest exactly where the action is.
What this buys, if you take a naive count instead, is a wrong answer of a memorable size.
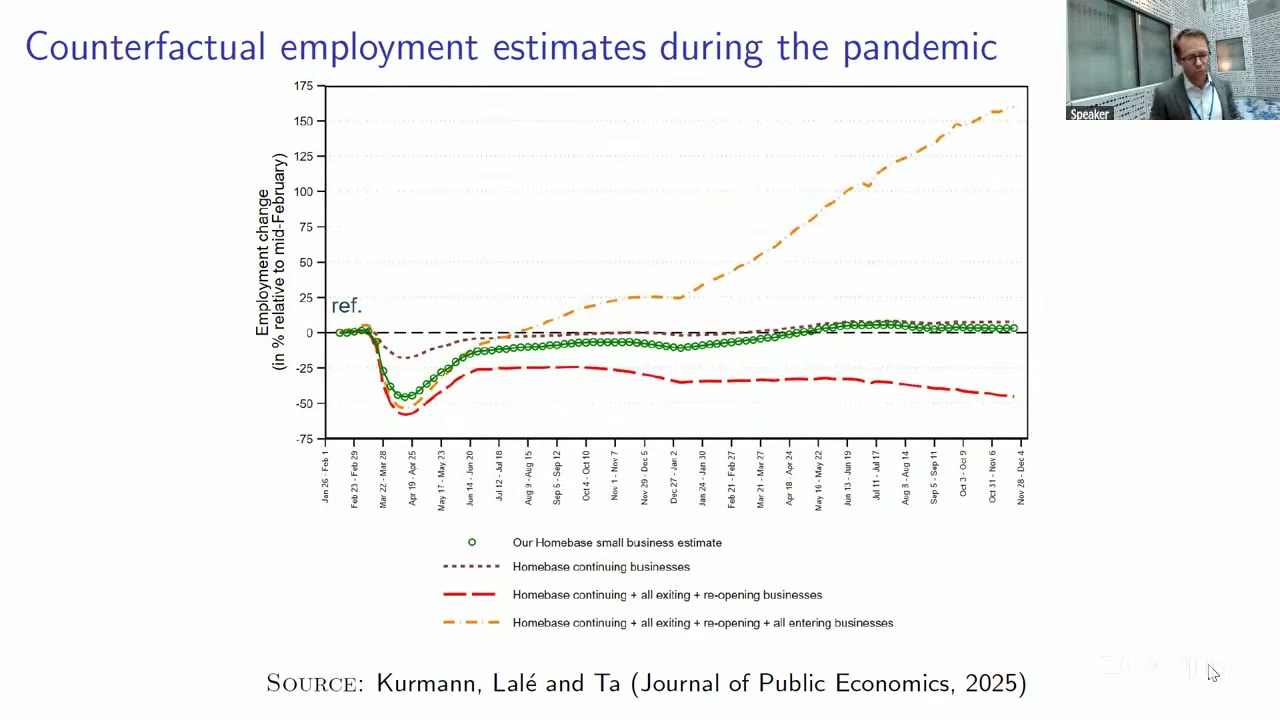
Four treatments of the same 2020 panel, all relative to mid-February. The corrected estimate troughs at roughly −48 per cent in early April and is back near zero by December. Continuing establishments only: a trough near −20 per cent, missing both the crash and the recovery. Add all exits and reopenings but no entries: down near −57 per cent and still around −40 at year end. Add all entries as well, treating each new client as a new firm: a climb to roughly +160 per cent. Same data, same year, and the sign of the pandemic depends on which of these you picked. Two cautions, both of which the authors would make themselves. The exhibit is from the published 2025 paper rather than this draft, and the numbers here are read off a slide whose gridlines are 25 points apart, so “roughly −50 per cent” and “roughly +150 to +160 per cent” is as precise as anyone should get.
What the corrected series says about right now
Against qcew small-establishment counts the weekly estimates track closely — professional and business services is essentially perfect for 2023, with a slight undercount in 2022 and a slight overcount in 2024; other services overshoots the next qcew point in every year, which the paper flags rather than buries. Kurmann’s own verdict was modest and accurate: “it’s quite surprising how close we get. These revisions are not very big, generally.”
The one live claim is about openings, and it is a claim about a hole.
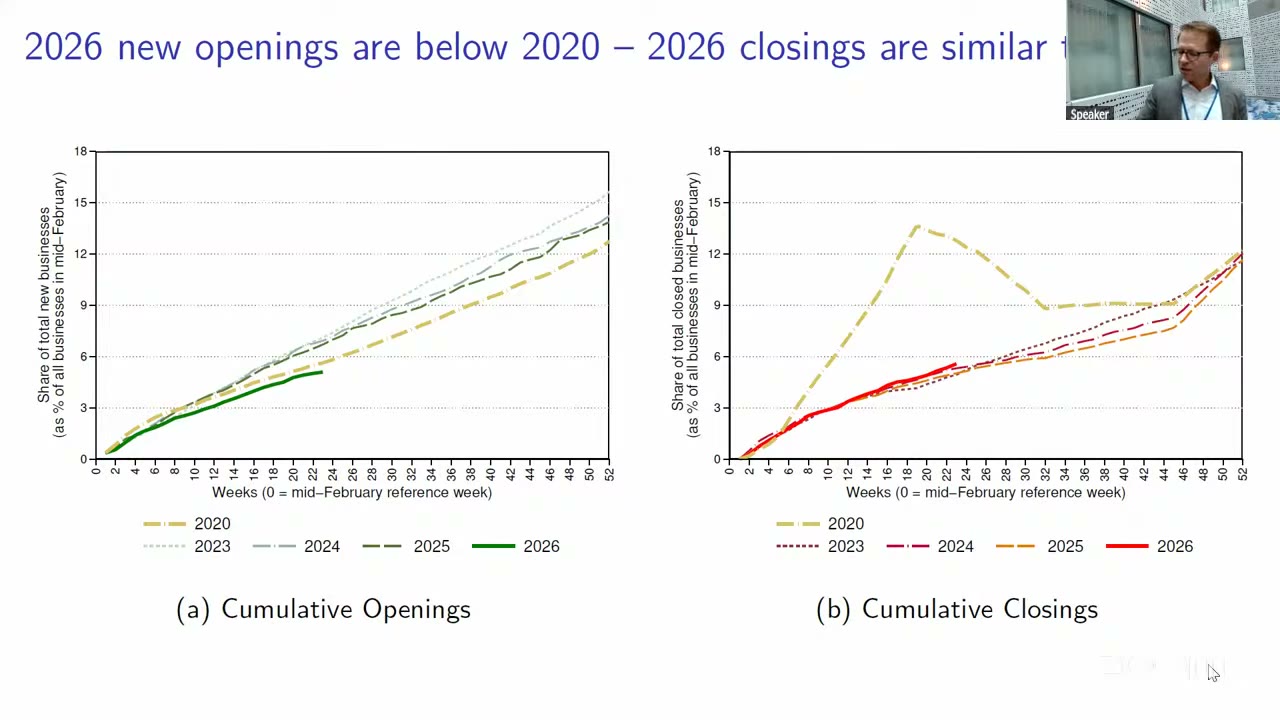
Through the roughly 22 weeks observed, cumulative 2026 opening rates run below 2020 — the pandemic year — at about 5 per cent of the mid-February stock against 5.5 to 6 for 2020 at the same horizon, with 2025 already the weakest post-Covid year. Closings are “sort of on the higher end, but not that much off from 2024.” So the signal is not a wave of failures; it is missing births. The paper is appropriately careful: “if correct, the hb estimates in Figure 6 give an early sign of a slowdown in small business dynamics along the entry margin — which at the time of this writing cannot be detected in administrative data.” That last clause is a falsifiable forecast with a resolution date, and Faberman named it from the discussant’s chair: it “hasn’t showed up in the published government statistics or at least not yet. So it would be interesting to see how that looks like post benchmarking a little less than a year from now.”
The half of the talk with no results
The second half was supposed to solve a different problem. Homebase is 130,000 to 150,000 filtered establishments a year, which is large for a research panel and small relative to the small-business population — and it is one vendor, which is a single point of failure. The foot-traffic and card-spending vendors cover vastly more locations. So treat the payroll ∩ activity intersection as a labelled training set, learn a map from activity signals to payroll outcomes with the usual menu (Lasso, ridge, random forest, gradient boosting, K-fold cross-validated), and impute onto the much larger activity-only set. It is a mass-imputation problem, it has a clean identifying assumption — no covariate shift in the conditional, the same in the labelled and unlabelled samples — and the paper concedes that assumption is “not directly testable and constitutes the primary threat to the validity of the proposed extended estimator.” Kurmann’s live gloss: “that’s obviously a big assumption. Not clear whether that’s true.” The motivation was the one that had been in the air all morning: “the hold-up problem that Ryan talked about. Is there any hope that we could sort of hedge here by having such a predictor and still produce reliable estimates?”
And then: “Now, I will not show you any results. Why? Because so far, as I write here, this has been a pretty sobering experience… We came in with high hopes and so far it’s been humbling.”
What follows is the part that will not survive into the published version, and it is the most useful fifteen minutes anyone spent at this session. The reason there are no results is that the activity data turned out not to be usable. Three defects, from the slide: the signal appears only in large common movements, so visits and spending track employment through Covid and predict almost nothing in calm periods; the sampling frames are unstable, with Advan’s point-of-interest count jumping and visits reshuffled across incumbents in 2023 while SafeGraph’s card panel drifts and breaks; and attribution fails at the establishment level, because Advan visits are assigned to a location rather than a business and “keep registering even after business stops,” while SafeGraph’s customer counts do go to zero but are sparse or missing for many establishment-weeks. Kurmann, saying it out loud to a room substantially composed of people with published causal papers built on these products: “they just redefine the number of what they call points of interest establishments every once in a while. And then they reattribute visits or cell phone pings to those things in a fashion that we can[’]t actually know how they do it. They don’t want to tell us. It’s kind of untransparent.” And then, unmistakably: “for people who have used safegraph or AdVan, and there’s many of us in the room, including us, it’s a bit of a cautionary tale. You got to be really careful what kind of data you use before you make big statements of… I had this causal effect or that causal effect or no effect at all.”
The paper’s own line is drier and says the same thing: “We view the framework as the right structure for the problem, but the results to date are a cautionary tale about the key role of data quality and sample stability.” There is a remedy in flight — new access to actual card-swipe transaction records, “where we have much more hope… So stay tuned” — and there is a structural irony worth sitting with, which the schematic above makes visual. The friction the paper solves on the left, the sample-churn wedge in the payroll panel, reappears unsolved on the right, in the activity panel, where there is no internal creation date to appeal to and no payroll data to resolve it against.
The discussion, and the question nobody asked
Jason Faberman had ten minutes for three papers, so this one got about four, and he spent them well. He credited the contribution precisely: private data “suffers from this problem of being an opportunity sample, convenience sample, in other words firms are entering and exiting their… data for no other reason than business related reasons, not being a true opening or closing. The real contribution here from this paper is putting together a methodology that better identifies true openings and closings from these data.” He graded it without flinching in either direction — “is it a perfect match?… it doesn’t meet the bar for statistical samples, no, but the methodology certainly makes some progress here, performs relatively well” — and he defended the niche against the obvious complaint that Homebase covers an odd corner of the economy: “these are also precisely the ones that we tend to care about for measuring or updating birth death models… it’s the small businesses that give us the issues.”
His verdict is the fairest single sentence anyone produced, including the authors: “there’s real promise here in terms of the methodology if not the particular data set itself.” He is separating the estimator from Homebase and betting on the estimator, which is exactly the right decomposition given that the estimator is the contribution and Homebase is a vendor relationship. He then did the thing that discussants almost never manage, which is to use one paper against another: on the session’s regional payroll-survey paper, whose estimates showed a much bigger hurricane drop and a much stronger recovery than qcew, “my read of that is that’s probably because we’re missing all of the exits that may have happened during that period by focusing on the continuing establishment. So unless there’s a way to, for example, apply the methodology from the first paper to the payroll survey data, we may be limited in what we can say even at a local level.” The discussant’s recommendation, in other words, was to bolt Kurmann and Lalé’s splitter onto somebody else’s data.
There was no author response, because there was nothing to answer: Kurmann had pre-conceded the central limitation during his own talk, and had already drawn the line he wanted drawn between the two halves — the classifier, “it’s quite successful. We are quite heartened by what we’ve come up with”; the coverage extension, “that’s a bigger haul and maybe we will not be successful. But I think it’s worth trying.” And no floor question was put to this paper. All sixteen minutes of Q&A went to the uk administrative-data paper and then to the general question of whether the United States could ever build the same infrastructure — the tax-office pipe, the fifty-one state partners, the National Directory of New Hires that sees every hire at I-9 time and cannot be used without an act of Congress. Kurmann did not speak again.
Which is its own comment on the session. The room spent its whole hour on how to get the administrative data flowing, while the paper on the table was a demonstration of how much scaffolding you have to build when you can’t. And Kurmann’s closing complaint is the one that should worry people, because it is not about method. The hard part, he said, “is not because of any, you know, coding or ai does that anyway or whatever else. The really challenging part is to convince these companies, not only to give you their data, but to give you data on the actual businesses, the names and addresses so you can do the matching.” The entire apparatus — every probability in Table 2, every in Table 3 — rests on being able to match an establishment in a payroll panel to the same establishment in an activity panel by name and address. Vendors will hand over the numbers and not the names. “So maybe there’s some role for a clearing house. I don’t know what the clearing house could be.” Neither, so far, does anyone else, and until someone does, the best available fix for the us payroll number’s weakest component is going to depend on whether a software company feels like sharing its customer list.