Notes on:
International Power
NBER Working Paper 34006
2025
geoeconomics · power · measurement · trade dependence
Paper · PDF
Made with AI: Fable 5.1 (reading and writing)
Ernest Liu (Princeton) and David Y. Yang (Harvard). The version read is the draft dated 10 March 2026 (139 pages with appendices); an earlier version circulated as nber Working Paper 34006 in 2025. No talk recording exists, so this is a pdf-only digest. Matteo Iacoviello’s discussion slides from the assa meetings (San Francisco, 3 January 2025) are public and supply the pushback; he saw an earlier draft, and the essay says where it differs. The paper also thanks Thomas Chaney and Jonathan Vogel as discussants. Figures and tables are cropped from the pdf; page citations are the paper’s printed page numbers.
Hirschman with a number attached
Hirschman’s (1945) claim was that trade creates dependence and dependence is power, and that the power runs to whichever side needs the relationship less. Clayton, Maggiori and Schreger (2024) built the contract theory of that claim. Liu and Yang do something more modest and, for empirical work, more useful: they write the smallest model in which the claim is true, read off the statistic it implies, compute that statistic for every country pair and year since 2001, and then test the two things the model says power should do — provoke negotiation, and get built up when relations sour.
The model is two-stage. Ex ante, countries place their trade orders. Ex post, a bilateral dispute arrives with some probability, and either side can pay a fixed cost to open negotiations, at which point the coercer threatens to stop exporting to the target. Because the target’s import plans were made ex ante, it cannot re-route in the moment, so the coercer holds it up and extracts a rent bounded by what the target would lose from the cut-off. (Threatening to stop importing does no work in the baseline: under competitive production the exporter’s labour simply moves into the outside good, so an import ban hurts the banner and not the banned. Appendix A.1 adds irreversible investment, which makes exporter losses positive but second-order.) The target can threaten back, so what matters is the asymmetry — who loses more if the two stop trading — and Nash bargaining splits the difference.
Anticipating this, a welfare-maximising government sees a wedge on both sides of its trade with a likely adversary. Private agents overvalue imports from that partner, since every import share is a hostage, and undervalue exports to it, since every export share is leverage. The model’s prescription (p. 12) is therefore an export subsidy and an import tariff of the same size, each scaled by the dispute probability and the inverse of the sector’s trade elasticity. “Building power” means reducing what you buy from an adversary and expanding what you sell to it; which of the two governments actually do is an empirical question the paper answers near the end, and the answer is not symmetric. The incentive is strongest in goods that are hard to replace. Utility is quasilinear with a freely traded outside good, which shuts off terms-of-trade effects and keeps the power measure a function of observables; Appendix A.2 builds the general-equilibrium counterpart in the Costinot–Donaldson–Komunjer (2012) spirit and finds it correlates 0.96 with the baseline.
The measure
Importer ’s dependence on exporter in year is a sum over sectors of ’s import share from , scaled by the inverse of the sector’s trade elasticity:
(eq. 10 in the paper), where is the value of imports of sector from and the sector’s trade elasticity, so that hard-to-substitute goods count for more. Power is the difference in dependence in the two directions:
(eq. 11). The denominator is total imports rather than total expenditure, a data constraint the appendix relaxes with Eora expenditure data (Lenzen et al. 2013). Two things follow from the construction. Power is not size: Taiwan has power over many countries through semiconductors, not gdp, and Brazil’s exposure to China runs through minerals it cannot source elsewhere, not through the size gap. And power is directional and sums to zero across a pair, so the interesting variation is in the sectoral composition of trade.
 and by year (series). The highlighted lines are China, Japan, Australia and Taiwan; China is the one below zero.’)
The United States’ map is darkest over the Americas, Japan and Australia; over China its power is small and, in the time series, negative and falling, from roughly zero in 2001 to about −0.015 by 2021, with most of the decline in the first five years. Its power over Japan, Australia and Taiwan is flat and mildly positive. Appendix Figure A.3 pushes this further: against almost every partner, us trade power sits below what the gdp gap alone would predict — the paper’s phrase is “punching below its economic weight” (p. 20).
 and by year (series). The highlighted lines are the United States, Japan, Australia and Taiwan, all rising.’)
China’s map is darkest over Mongolia, parts of Africa and South America, and its four highlighted series — the United States, Japan, Australia and Taiwan — all climb from about zero to between 0.015 and 0.025 by 2021; the paper credits wto accession and growth. Two asides. Regressing China’s power over a country on us power over the same country gives −0.14 (p. 17): the two great powers’ dependents are largely different countries. And the figure captions say the measure ranges over [−1, 1], which is the theoretical range; the plotted values sit between −0.02 and 0.08, so do not read the scale as the story.
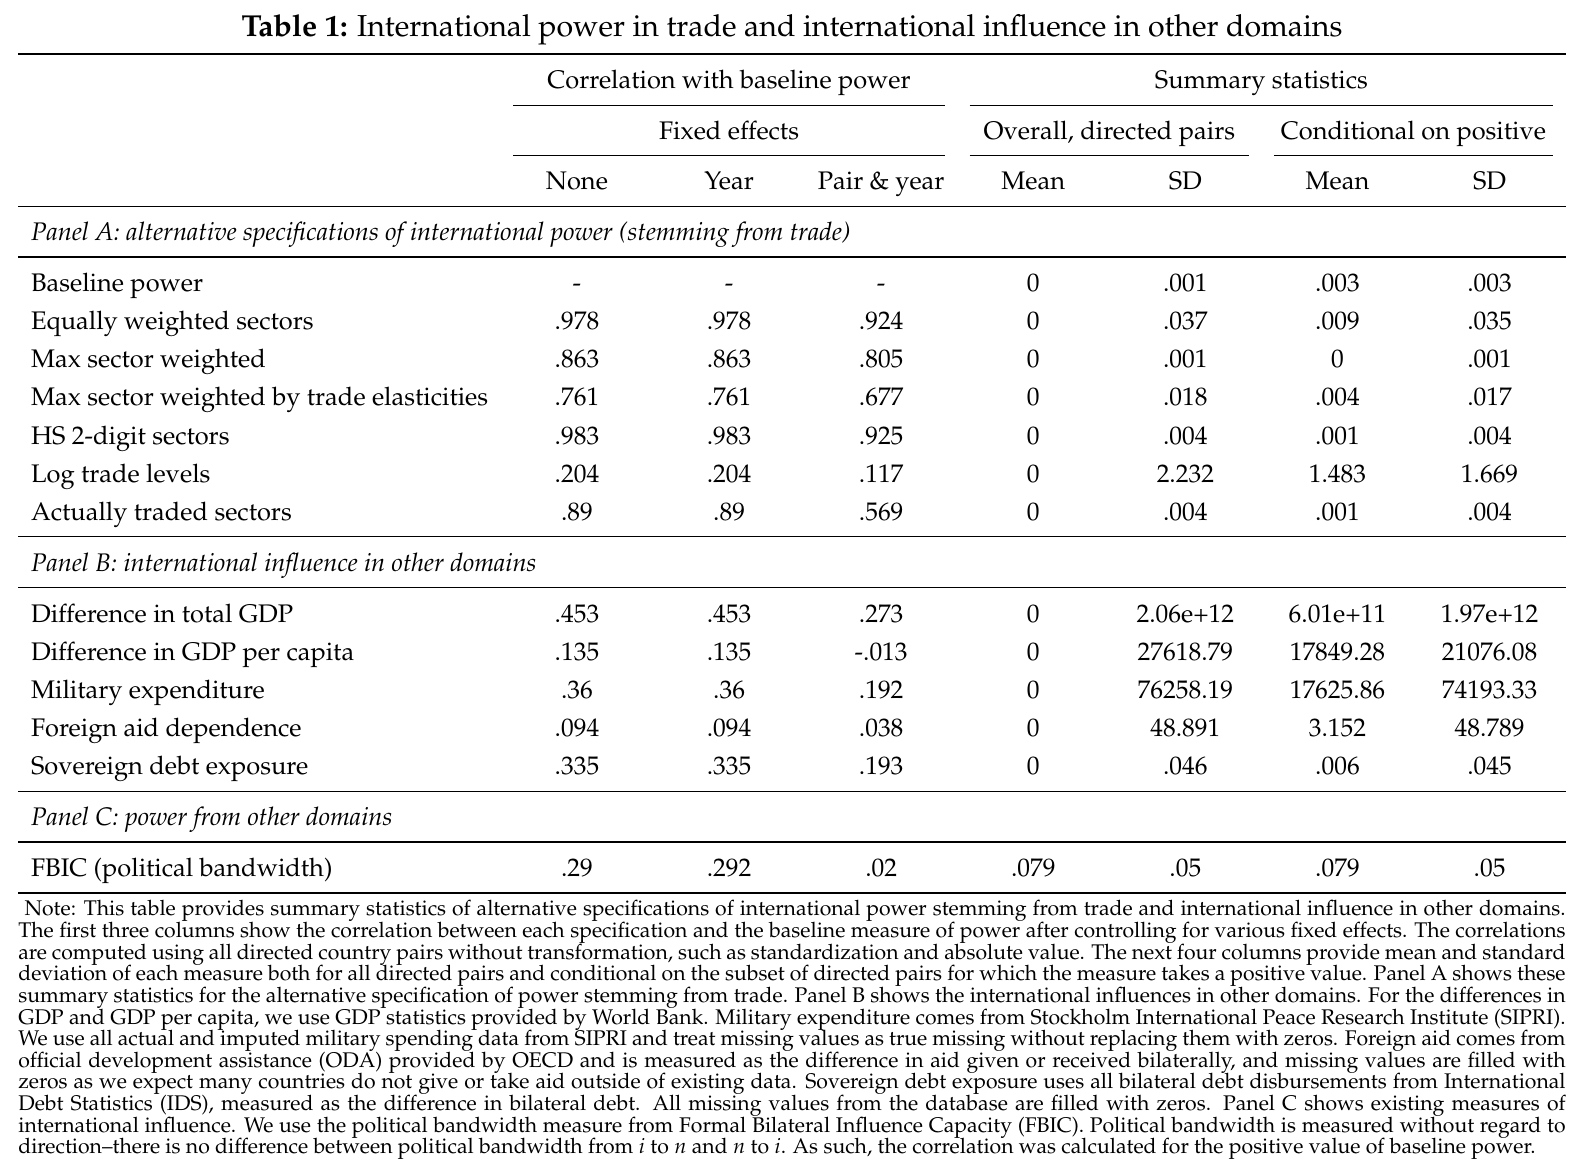
Panel A of Table 1 is where the measure is stress-tested against itself. Equal sector weights, a single worst-sector threat, hs-2 sectors and actually-traded sectors all correlate with the baseline at 0.76 to 0.98. The exception is the level-based measure, which replaces shares with log trade values: its correlation is 0.204, and 0.117 once pair and year effects are removed. That is not a footnote. The paper’s own interpretive note (p. 13) says the right normalisation depends on whether the cost of conceding scales with size, and when the level measure is used in the alignment test below it produces a null (p. 45). So the results are about share dependence, and the authors read the null as evidence that “power build-up may indeed scale with size”. Panels B and C answer the question of whether trade power is just influence by another name. The baseline correlates with differences in total gdp at 0.45, gdp per capita at 0.14, sipri military spending at 0.36, aid dependence at 0.09 and sovereign-debt exposure at 0.34; with the fbic political-bandwidth index, which counts diplomatic representation and shared igo memberships, at 0.29, falling to 0.02 within pair. The paper’s own words are “positive, though often weak” (p. 19). Trade power is related to the other kinds and is not a proxy for them, which is the point.
Power provokes engagement
The first prediction is that when the power gap between two countries widens, the credibility of a trade threat rises, and with it the stakes of bargaining — so the pair should engage and negotiate more. Engagement comes from the icews event database, which codes newspaper reports into bilateral events with an intensity score: expressions of intent to meet, appeals for economic cooperation, acceptance of mediation, threats. The introduction speaks of 19 million events; the analysis sample is 6.7 million events across 23,516 pairs from 2001 to 2021, restricted to non-violent events, and the paper does not reconcile the two figures. Most of these events, the paper says, are not about trade at all. With pair and year fixed effects and controls for the gdp gap and total trade, a one-standard-deviation rise in lagged power raises engagement by 0.236 standard deviations, which is 38 percent at the mean and 19 percent at the median (column 3; the bare coefficient in column 1 is 0.107).

The instrument matters because engagement could cause trade rather than the reverse, or a third factor could drive both. The shift is the exporter’s global market share in each sector; the share is the importer’s 1995–99 sectoral import mix, rebalanced by inverse elasticities. A leave-one-out version that drops the specific importer from the shifter, following Autor, Dorn and Hanson (2013), is a robustness check and changes nothing. The IV coefficients are larger than ols, which the paper takes as attenuation in the ols rather than as a warning. One honest wrinkle: the over-identification tests reject homogeneous effects across the 21 hs sections, though the sectors with the largest Rotemberg weights all cluster around the baseline estimate (p. 28). The relation survives dropping every pair involving the United States, China or Russia, and it vanishes inside the eu-15.
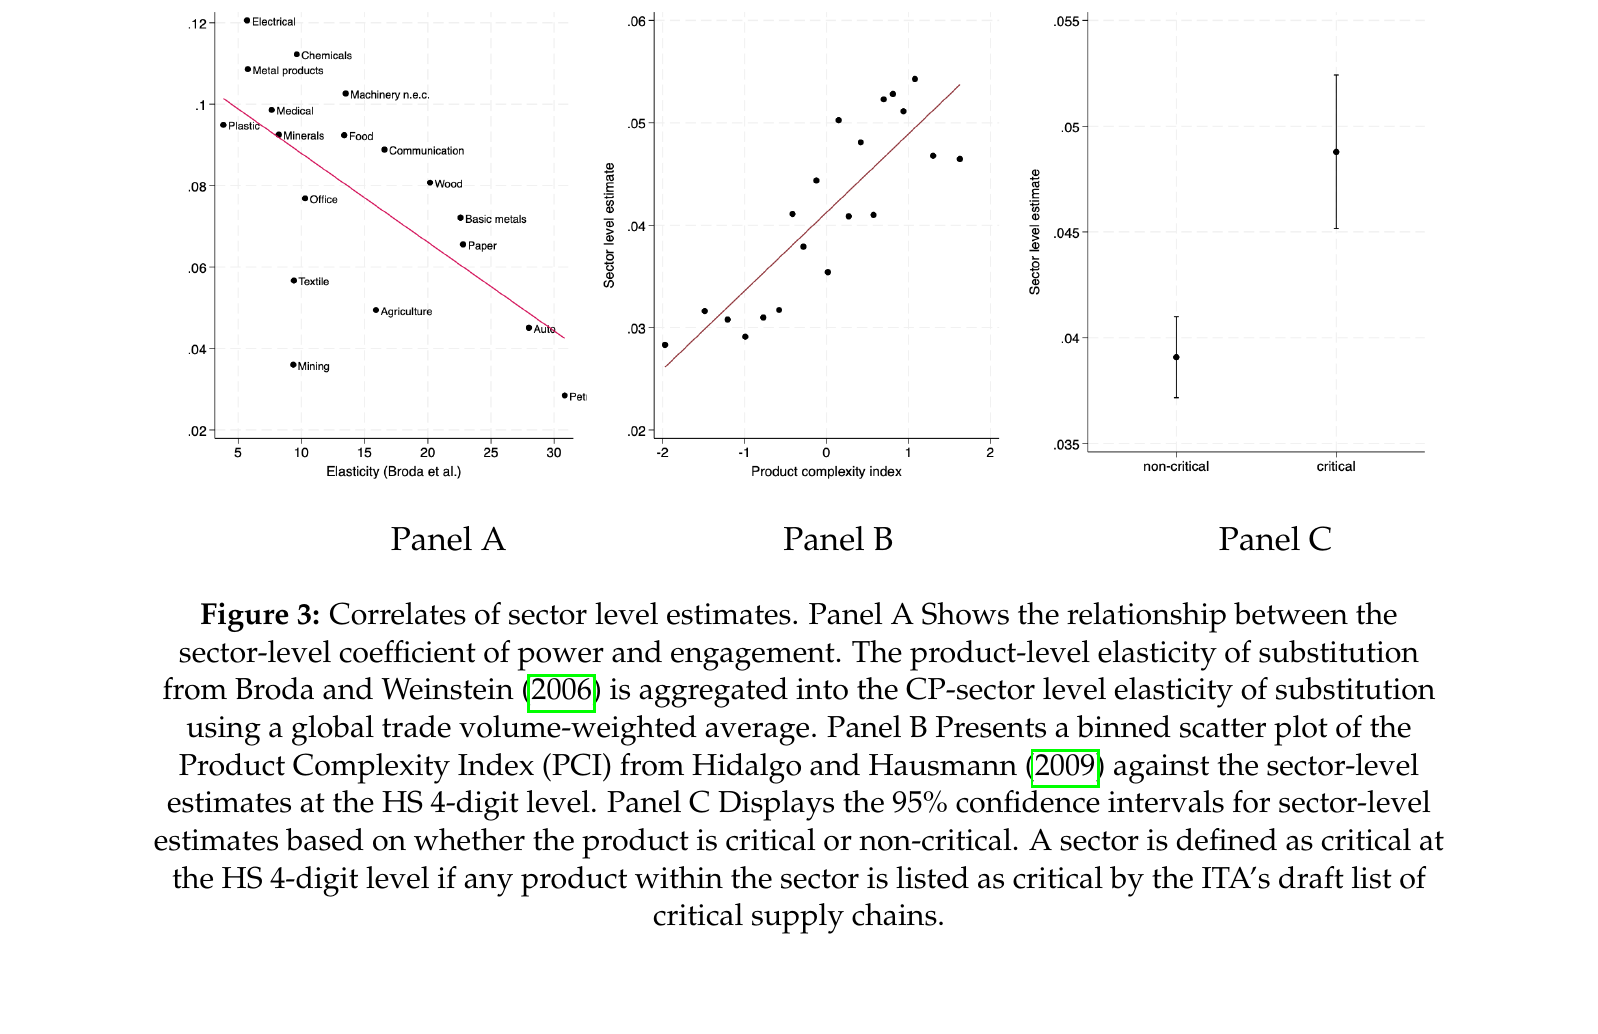
The sectoral decomposition is the part that speaks to the theory. Power from chemicals, optical and medical instruments, and electrical machinery moves engagement most, and across sectors the coefficient falls with the trade elasticity (electrical, chemicals and metal products at the top left of Panel A; petroleum, autos and mining at the bottom right), rises with product complexity, and is higher for sectors containing a good on the International Trade Administration’s critical list, with confidence intervals that do not overlap. This is the model’s inverse-elasticity weight showing up in the data without being imposed.
Adversaries build power
The second prediction is that countries accumulate power toward partners who have become adversarial. Alignment is measured at annual frequency by placing every country in a two-dimensional space using Gallup World Poll disapproval of us, Russian and Chinese leadership — the three great powers act as satellites, and a country’s position is triangulated from its distances to them — then averaged with the difference in Polity scores (eq. 17). Identification comes from close elections: Marx, Pons and Rollet’s (2025) data on 155 presidential and 170 parliamentary elections in 177 countries from 2012 to 2018, with a five percent winning margin as the cut-off. When country A’s government turns over, its alignment with each partner B reverses its prior trend (Table 3, Panel A), and the paper asks how B’s power over A moves in the two years after. The design choice — B’s power over A rather than the reverse — is what makes the prediction sharp: A cannot respond to all its partners at once, since the shock pushes them in different directions, but B can respond to A alone. A one-standard-deviation worsening of alignment raises B’s power over A by 0.39 standard deviations, which moves a pair from the median to the 85th percentile.

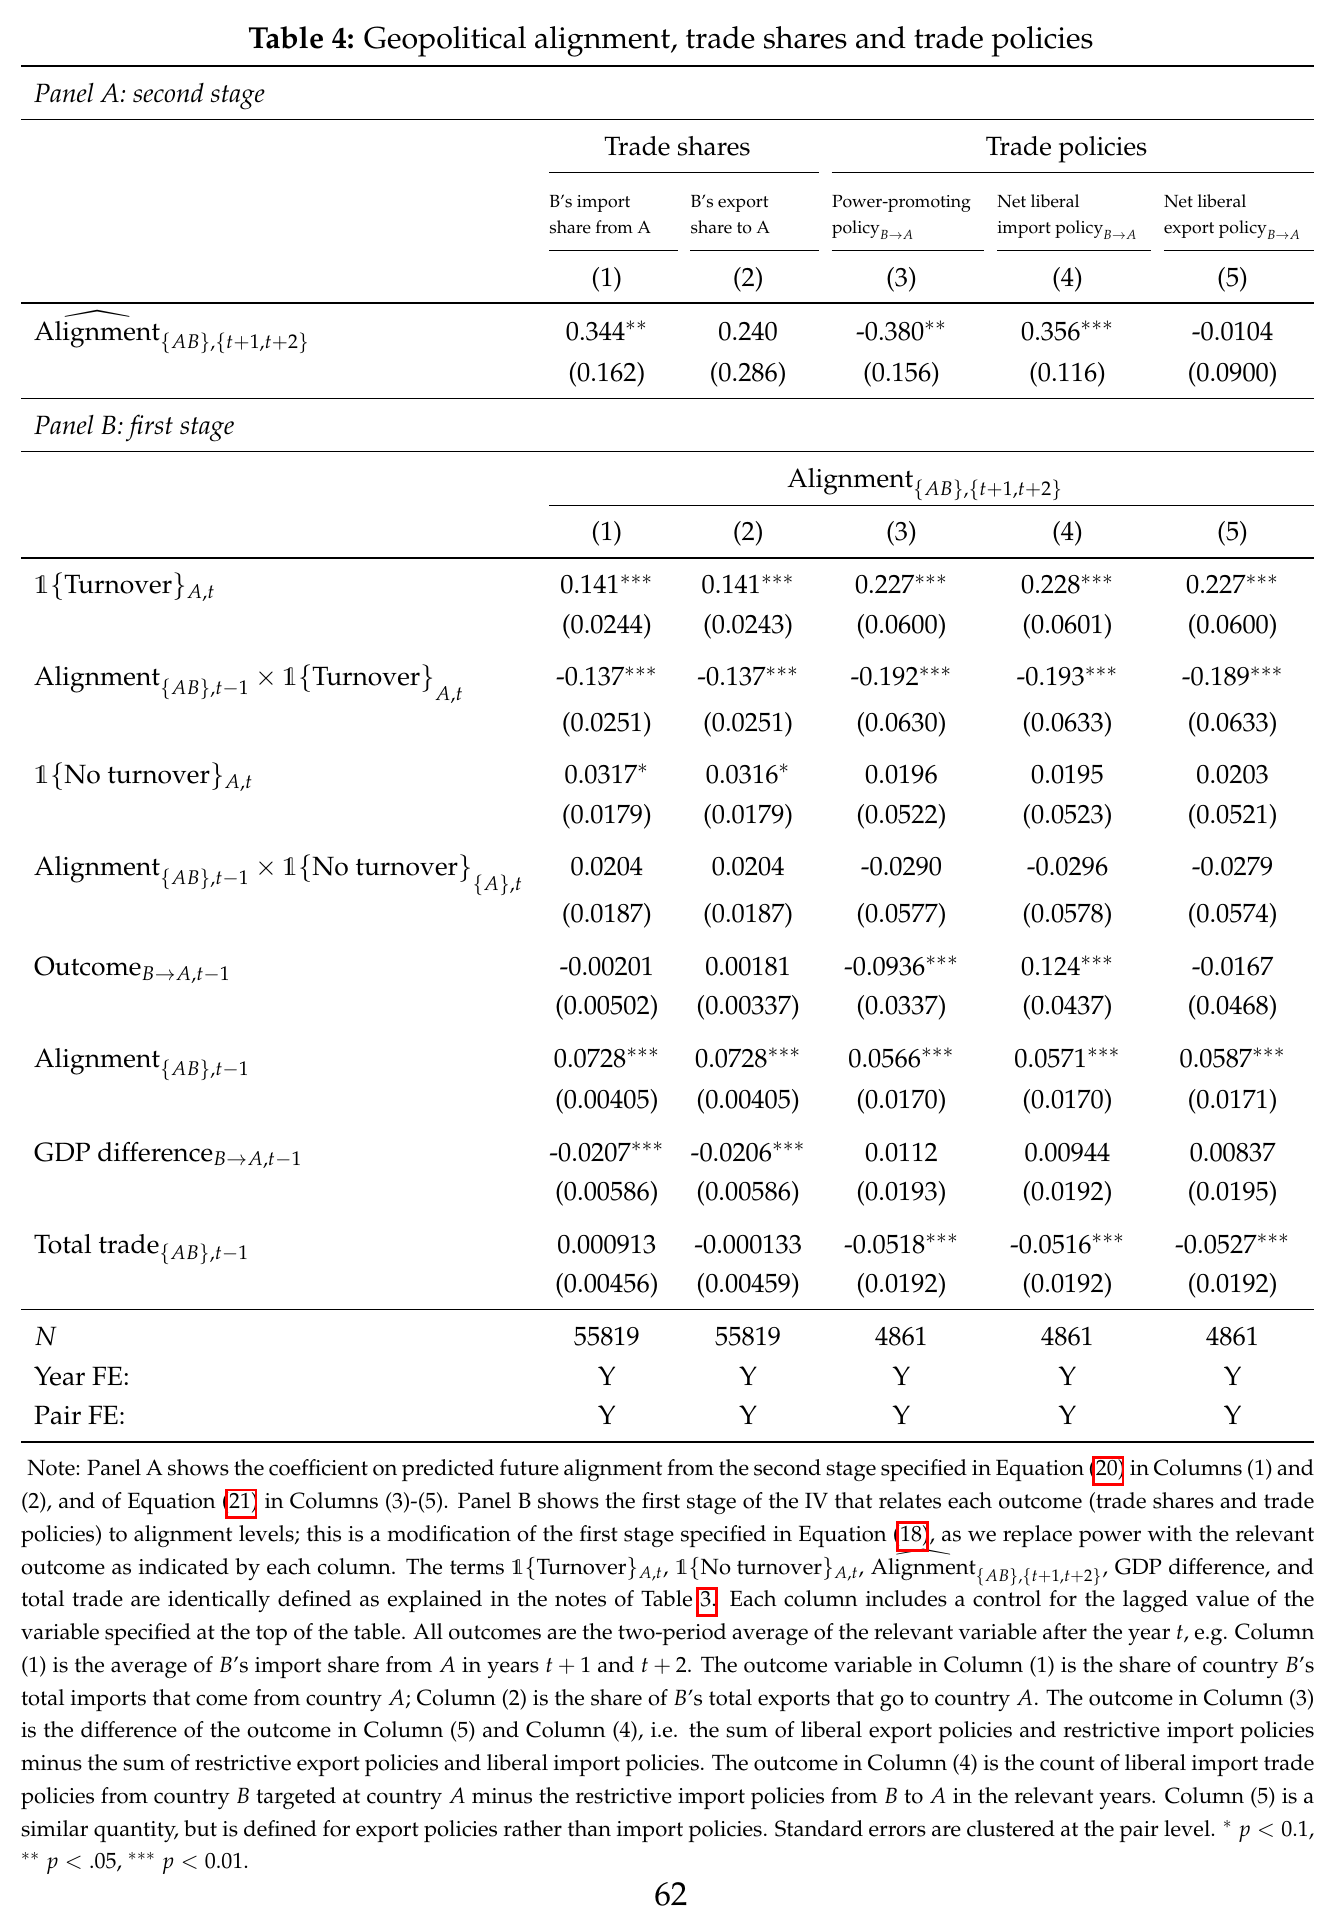
Then the decomposition, which is the finding I would carry away. The model says a threatened country should both import less from and export more to the adversary. Table 4 says what countries actually do: B’s import share from A moves with alignment at 0.344 and is significant; B’s export share to A moves at 0.240 and is not. Global Trade Alert records tell the same story on the policy side, with significant changes in B’s import policies toward A and nothing on the export side, while A does little in return (Appendix Table A.24). The build-up is defensive. Countries facing a newly hostile partner do not push exports to acquire leverage; they cut imports to deny the partner leverage. The paper’s gloss is that diversifying suppliers is cheaper than ramping up exports on demand, which is surely true, and it is worth noticing that this is a result and not a prediction.
What the discussant wanted
Iacoviello’s (2025) slides are a fair-minded list of what a reader at the Fed would want before believing the paper, and they should be read against the draft he saw, whose second result was framed as engagement leading countries to seek power through exports. Hence his complaint that the paper treats export volumes and trade surpluses as things policy can move, when running a surplus is hard; replace them, he suggested, with tariffs and export restrictions. The March 2026 draft has changed the second result into the alignment-shock design above, and the Global Trade Alert analysis in Section 5.4 is the tariffs-and-restrictions test he asked for — with the twist that the action is on the import side, which rather agrees with him. His other points: define power, alignment and engagement up front; put the alternative influence indices in the main text, since the United States holds power over many Western countries through Nato and aid rather than trade balances (the draft’s answer is Table 1 Panels B and C and Section 4.9, which finds the trade-power coefficient unchanged when military, aid and debt asymmetries are controlled for, and larger where they are present); consider a dynamic specification such as a panel var, since the paper’s story is shocks to power to alignment to power; check that the icews series pass a smell test, given that the us–Saudi series spikes for an arms deal and for the Khashoggi killing; and label as model statements the two concluding claims that trading on comparative advantage exposes countries to coercion and that power accumulation is negative-sum. Those two sentences survive verbatim in the new conclusion (pp. 49–50), so that last point stands.
Where it sits
Read this alongside A Theory of Economic Coercion and Fragmentation. cms’s power statistic is a closed form in nested-ces expenditure shares and is nonlinear in the hegemon’s share of an input; Liu–Yang’s is linear in import shares, weighted by elasticities, and directional. The two are built for different jobs — cms to price a hegemon’s hold over a sector, Liu–Yang to run a panel regression across all pairs — and the group should see both and notice that the same parameter, the trade elasticity, sets fragmentation costs in block 1 and coercive capacity here. Becko and O’Connor’s Strategic (Dis)Integration (2025, working paper) is the theory of optimal trade and industrial policy when countries anticipate future conflict, which is the ex-ante incentive this paper’s second result measures. For the group’s own interests, the measure is computable from baci and published elasticities, and the close-election design is reusable. (Footnote 49 is a nice coda: China has positive power over every individual eu member, but the eu treated as one country has positive power over China. Whether you are a coercer or a target depends on who is doing the counting.)