Notes on:
External Sector Report 2026, Chapter 2: 2025 Individual Economy Assessments
External Sector Report: Amid Rising Imbalances, the Case for Rebalancing (Washington, DC: International Monetary Fund, July 2026), Chapter 2
2026
current account · exchange rates · China · IMF · global imbalances
Paper · PDF
Written by Opus 5
International Monetary Fund, “2025 Individual Economy Assessments,” Chapter 2 of the External Sector Report 2026: Amid Rising Imbalances, the Case for Rebalancing (Washington, dc, July 2026), read alongside Chapter 1 and Annex 1.1 of the same report. No accompanying talk or discussion; this is a document-only reading.
There is a number going around that the renminbi is undervalued, and the number is doing a lot of work. It gets cited in op-eds about tariffs, in arguments about whether Beijing is cheating, in the general background hum of the trade debate. The number is roughly twenty percent, and it comes from the imf, and almost nobody who quotes it has looked at how it is made. It is worth looking, because the construction is much stranger and much more honest than the citation makes it sound.
Start with the thing the imf actually believes in. A country’s current account is not, in the first instance, a fact about its exchange rate. It is an accounting identity about saving and investment:
A country that saves more than it invests must lend the difference abroad, and lending abroad is the same thing as running a current account surplus. That is not a theory; it is bookkeeping. So if you want to know why China runs a surplus, the question is why Chinese households and firms save so much and invest so little, and the answers are things like a threadbare social safety net, a housing market that has been correcting since 2022, and a corporate sector that stopped building.
The imf’s External Balance Assessment takes this seriously. It regresses current account balances on fundamentals — demographics, income levels, growth prospects, net foreign assets — and on policies, to produce a norm: the current account this country ought to be running, given who it is and given the policies staff think it ought to have. Subtract the norm from the cyclically adjusted actual, add whatever hand-adjustment the country team can justify, and you have the current account gap.
For China in 2025 the arithmetic is unglamorous. The surplus was 3.8 percent of gdp; cyclically adjusted, 3.6; the norm, 0.6; the model gap, 3.0; the staff adjustment, zero. Staff gap: 3.0 percent of gdp. Everything up to this point is a statement about saving and investment, and it is the statement the imf stands behind.
Anyway. Then comes the sentence everyone quotes, and it is one line further down the same table:
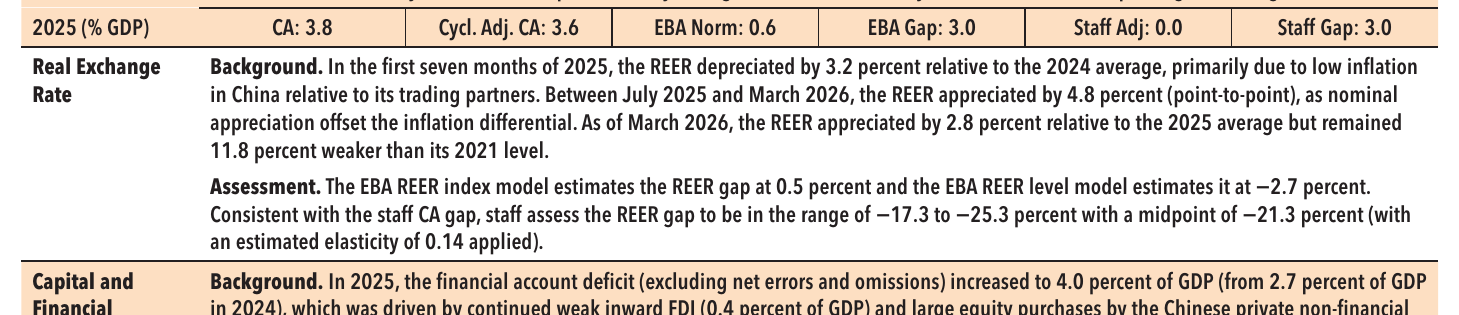
Read that again with the parenthesis in mind, because the parenthesis is the whole thing. The renminbi is not measured and found to be 21.3 percent cheap. The 3.0 is divided by 0.14.
Here is the semi-elasticity of the current account, in percent of gdp, with respect to a one percent real effective appreciation — how much of the surplus a stronger currency would eat. Three divided by 0.14 is 21.4, and the report says 21.3, and the uncertainty band is the current account band run through the same division: 2.4 and 3.6 become 17.3 and 25.3. There is no separate exchange rate measurement anywhere in this. It is one number and one long division, and the long division is the dual of the saving–investment story, not an independent check on it. The report is not claiming that the exchange rate is the problem. It is answering a counterfactual nobody would ever actually face: if the entire gap had to be closed by the currency alone, with no change in Chinese saving, no change in investment, and no feedback from the exchange rate back to demand, how far would the currency have to move?
And now the fun part, which is that the denominator is a choice. Because the mapping is a division, the same current account gap becomes a completely different currency headline depending on which economy you divide it in. China’s 0.14 is among the three lowest in the report; only the United States (0.11) and Brazil (0.13) come in under it. At the other end, Belgium gets 0.67 and the Netherlands 0.64, because those are small, wildly open economies where a real appreciation actually bites. So:
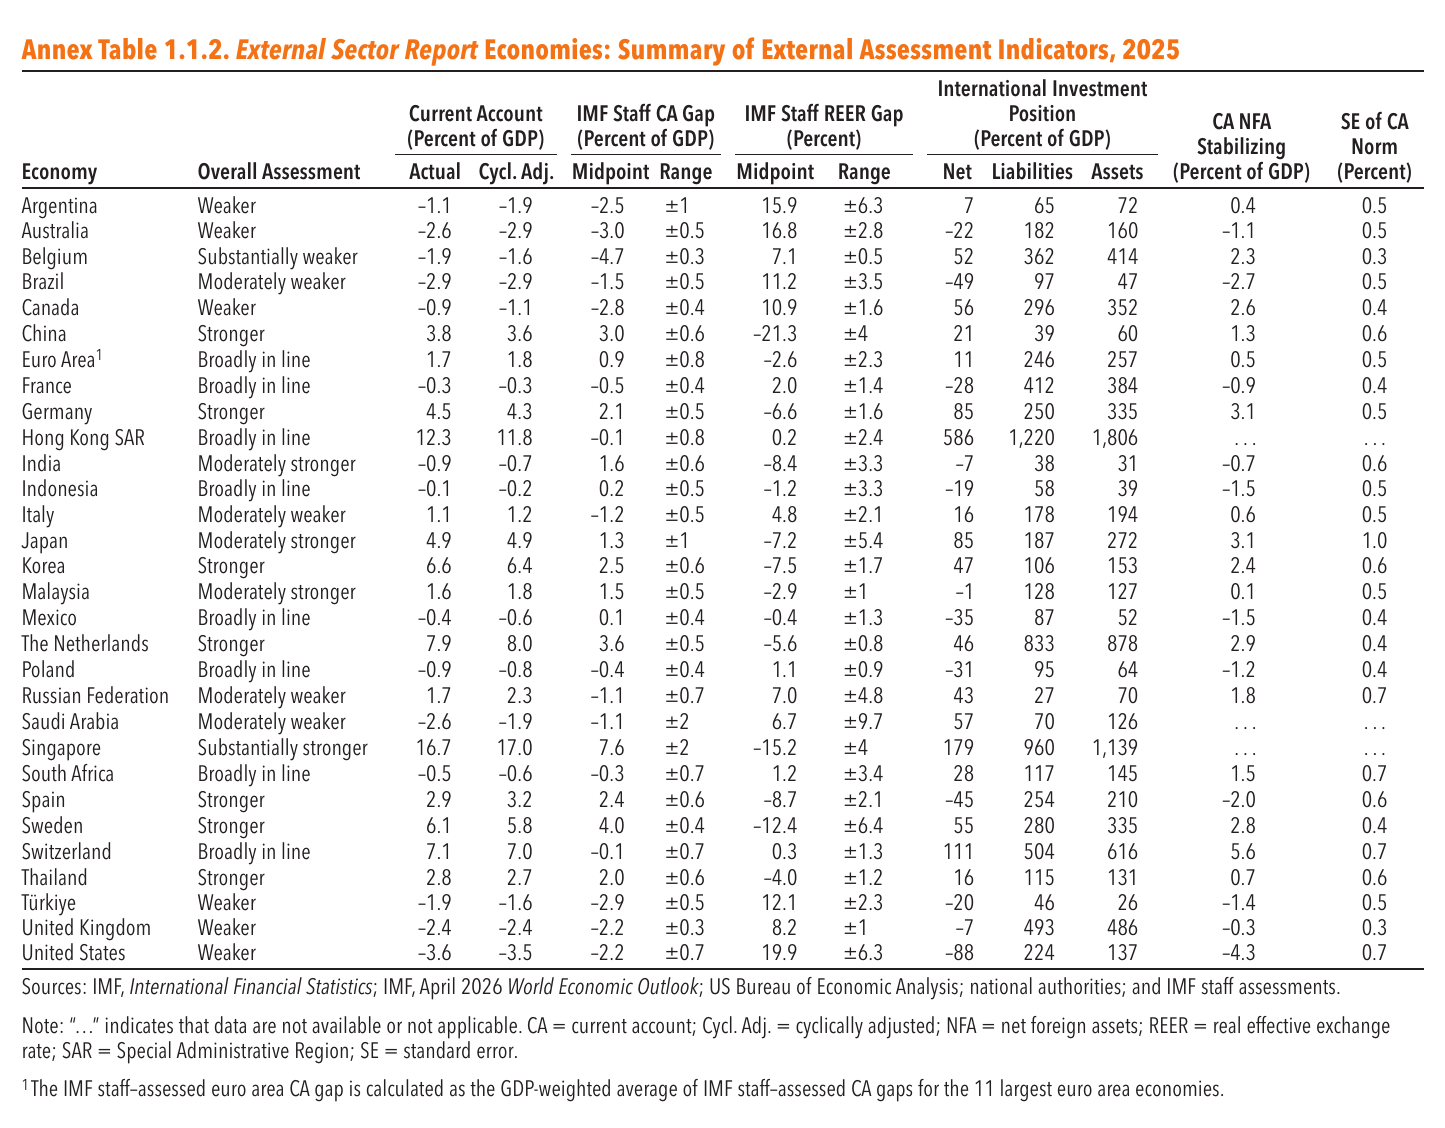
Singapore has a current account gap of 7.6 percent of gdp — two and a half times China’s — and its currency is judged 15.2 percent undervalued, comfortably less than China’s 21.3, because Singapore’s elasticity is 0.5. The Netherlands has a larger gap than China, 3.6 percent of gdp, and its real effective rate — the euro deflated by Dutch prices — comes out 5.6 percent cheap:
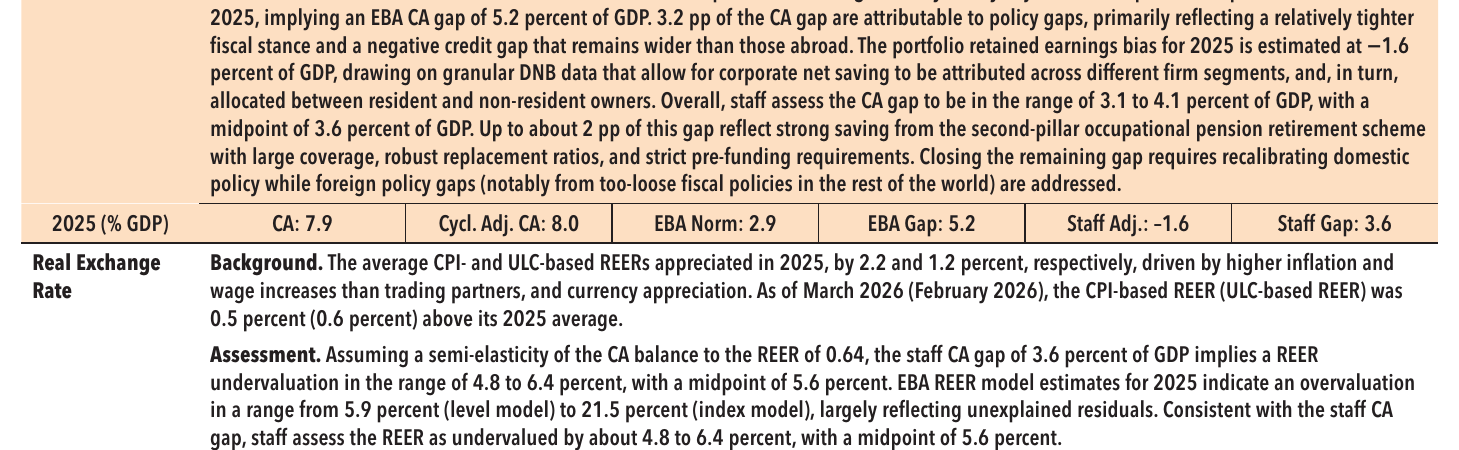
A bigger imbalance, a quarter of the currency headline. Note also the sentence after: the Netherlands’ own exchange rate models say the currency is overvalued, by somewhere between 5.9 and 21.5 percent, and staff overrode them in favor of the divided-out number. The sign flipped and the assessment did not.
The report knows what it is doing here. It publishes an illustrative table that converts current account gaps into exchange rate gaps at a flat elasticity of −0.2, which is a real elasticity for approximately none of its members, and the labels it assigns — “stronger,” “substantially stronger” — are pinned to the current account column, not the currency column:
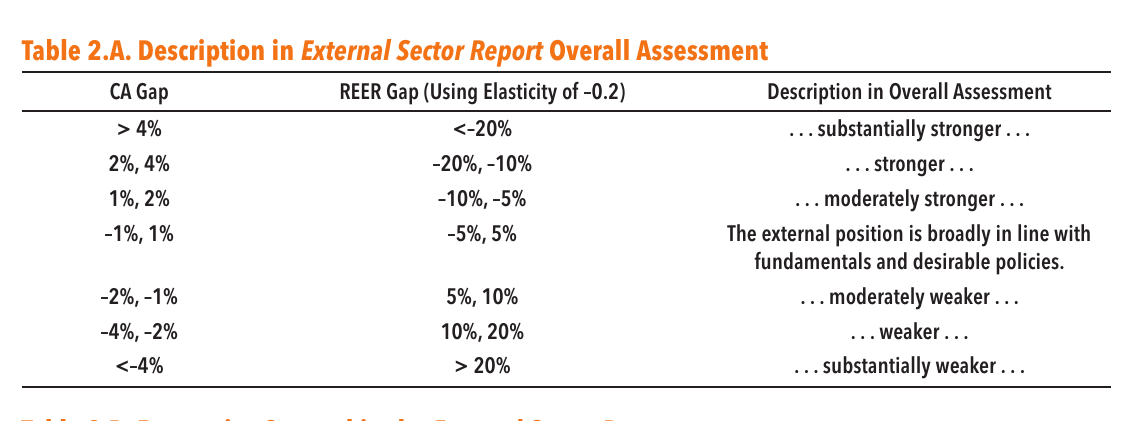
China’s 3.0 percent gap puts it in the “stronger” band. Its 21.3 percent currency gap would, on the same table, put it one band further out, in “substantially stronger.” The report goes with the current account, and says why in Chapter 1: the assessment “places more weight on the current account model because real exchange rates are more volatile and difficult to explain econometrically.” That is a flagship publication telling you, in its own methodology section, that the exchange rate number is the softer of the two.
What happens if you measure the currency directly. You get roughly nothing. The eba has two exchange rate models that do not go through the current account at all — an index model, which is a price regression of the real effective rate on fundamentals, and a level model, which is a variant of the purchasing-power-parity relation. For China in 2025 they return +0.5 percent and −2.7 percent. Which is to say: by the two methods that actually try to price the currency, the renminbi was somewhere between fairly valued and three percent cheap. The twenty-one comes from the method that does not price the currency.
One more layer down, the three itself is mostly a residual. Of China’s 3.0 percent gap, the identified policy gaps contribute −0.1 percent of gdp — an accommodative fiscal stance netting out against insufficient health spending. The rest is the error term, which staff interpret, plausibly, as precautionary saving against a weak safety net and a long housing downturn.
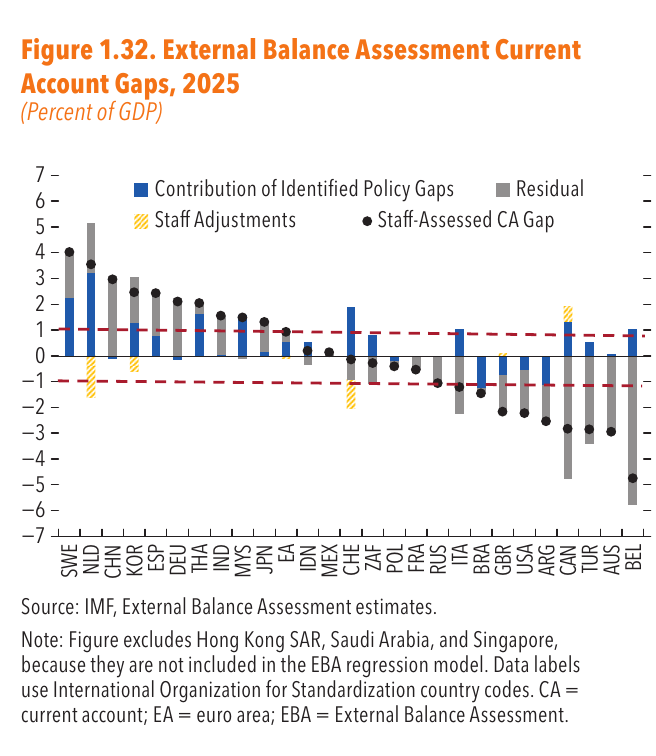
So the chain runs: a residual the model cannot explain, divided by an estimated elasticity, converted into a currency number the report itself downweights, which then appears in a newspaper as evidence of deliberate manipulation. Each link is defensible. The composition is not load-bearing.
And what does the report recommend China do about it? Not appreciate. Read the policy paragraph and it is fiscal stimulus aimed at consumption, a faster property-sector cleanup, hukou reform to let households stop saving so hard, deregulation to get investment into services, and less industrial policy. Exchange rate flexibility appears, but as shock absorption, and the appreciation shows up at the end of the causal chain rather than the beginning: a package of macro and structural reform “would close the output gap and reflate the economy, while also facilitating further real appreciation and a narrower current account surplus.” The currency moves because the saving rate moved. That is the direction of the arrow in the document.
The tell. If the twenty-one percent were a statement about Chinese currency policy, you would expect the same table to be quiet about countries that let their currencies float freely. It is not. Right there at the bottom of the same annex is the United States, at 19.9 percent — overvalued, and by essentially the same construction, a 2.2 percent of gdp deficit gap divided by the smallest elasticity in the book.
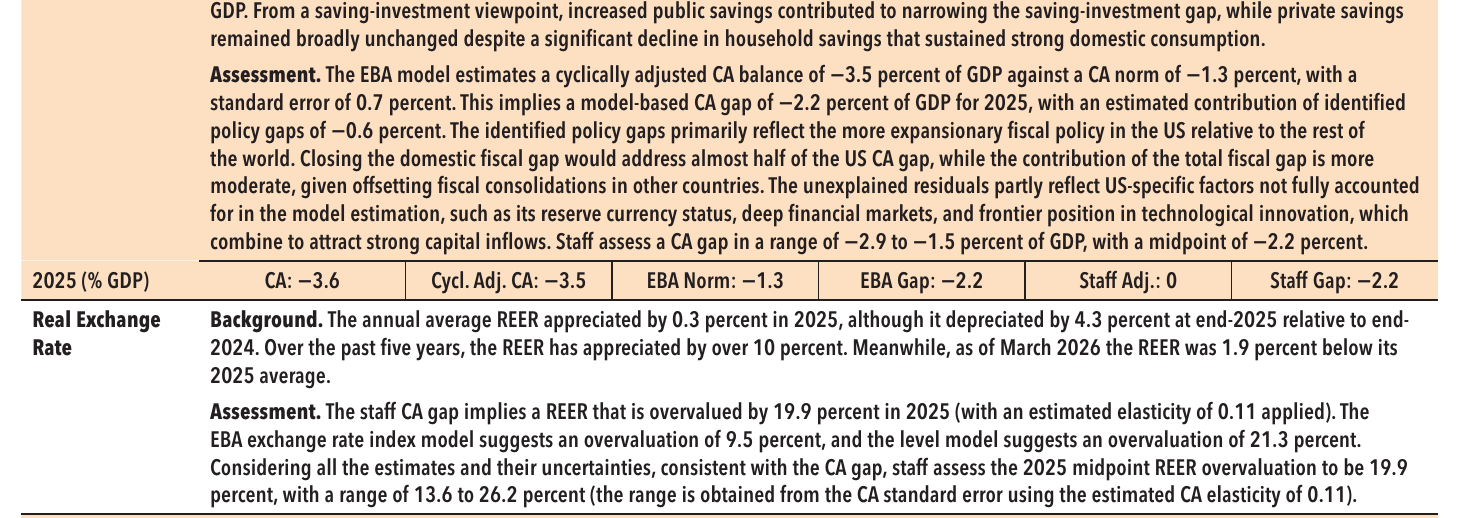
Nobody quotes that one, though it is the same number, produced by the same division, in the same table, about a currency that no one accuses of being managed. It is the dual of the American fiscal deficit, and it is telling you that closing the American saving gap by exchange rate alone would take a twenty percent dollar depreciation — which is not a plan, and is not offered as one.
(A smaller thing, offered without much weight: the sign convention on flips between country pages — China’s is written as 0.14 and Sweden’s as −0.41 for the same object. And Sweden is the one economy where staff visibly refused the arithmetic: the division gives −9.8 percent, and staff published −12.4 with a range from 6 to 18.7, guided instead by a unit-labor-cost index and its standard deviation. Which is a reminder that the mapping is a convention that country teams are allowed to override when they think it is lying, and that they exercise the option.)