Notes on:
Managing Innovation in Firms
Work in progress
2 October 2026
managers · innovation · multinationals · personnel economics
Talk · Paper · Transcript
Made with AI: Haiku 4.5 (research), Opus 5.5 (reading and writing), Fable 5.1 (adjudication), Sonnet 5.5 (verification)
Part of Economics of Talent Conference, Fall 2026
Ingrid Haegele, Isabela Manelici, Jose P. Vasquez and Francis Wong
Presented by Jose P. Vasquez at the nber Economics of Talent Conference, Cambridge ma, 2 October 2026 (video). No discussant.
Source note: there is no public paper. This is work in progress, and the piece is written from the talk and its slides only. The firm is anonymous by agreement, and the authors may not name it in any setting until publication, so it is “the firm” throughout. Every number below is one the speaker said or a slide showed, and where they differ the text says which it is quoting.
Who gets to kill your idea
Vasquez opens with Gary Starkweather at Xerox. Starkweather woke up one morning wanting to print with a laser, and his manager thought it was the most stupid idea ever. Years later a different manager backed it, and the laser printer became one of Xerox’s main sources of revenue. The point is not that managers are sometimes wrong. It is that in a large firm the manager is the first filter on an early idea: he screens it, funds it or kills it, and argues with you about its technical substance. So it matters a great deal which kind of person sits in that chair.
The candidates are the usual ones: a PhD, years at the firm, rank in the hierarchy, experience managing inventors, and the one the paper cares about, which is having actually turned ideas into inventions yourself. The speaker’s analogy for the room was having published a paper versus not. The finding is that only the last one shows up. So this is really a paper about thesis advisors, run on German engineers because a German manufacturer keeps better records than an economics department does. (Vasquez added that this is the team’s first paper in the economics of innovation, so they were keen on comments.)
The firm and its paperwork
The firm is headquartered in Germany, has over 200,000 workers, and makes technologically sophisticated intermediate goods. The speaker says it is “not among the group of superstar firms” and is comparable to the top multinationals on R&D and patenting. The sample is its engineers in Germany, who produce 90% of the firm’s patents.
The data trick is the invention disclosure. German law requires an employee with an idea that might become a patent to register it with the employer. The worker gets a paper trail that pays off if the idea is later patented or earns royalties, and the firm learns who is working on what. So compliance is high, and you observe ideas at birth, not only the ones that survive. The firm has about 43,000 of them. By the speaker’s account, 58% become a patent application (about eight months after disclosure), 30% are eventually granted (about 50 months after that), and 3% are commercialized, meaning they earn royalties or go into a product. He suspects many granted patents are defensive. Courtesy authorship is the obvious worry with a “co-invented with the manager” variable. The evidence against it is anecdotal: engineers asked whether they add their manager “just because” answered, more or less, “why would I do that?”
Treatment is a manager’s average number of inventions per year, counted only from disclosures made before the manager supervises the worker. Slide 9 says 35% of switching managers have at least one prior invention. Among those, the mean is 0.73 a year and the 90th percentile is 1.98, so “a top-decile manager” means someone who was producing about two inventions a year.
The design
About 5% of managers rotate to another team each year. The firm says it does this for their careers, so they see more of the company. That gives a manager-switcher event study, written on slide 11 as
where is worker ’s invention output in quarter , is the new manager’s invention experience minus the old one’s, and are worker and event-time fixed effects, is quarters since the switch, and traces the dose-response by event quarter. (The slide defines the first four symbols, and the last two are read off the plots.) Every worker in the 71,000 worker-quarter sample, for 2012–2022, gets a new manager. Only the size of varies.
Vasquez called the threat “the big monster”: a firm that knows which teams are about to take off and sends its best inventor-managers there. Against it he offers balance and timing. Pre-switch team characteristics do not predict , workers look alike across big and small switches, and manager tenure in a team is smoothly distributed after year three, so switches are hard to time. There are no pre-trends. Results hold for junior managers, who by interview accounts have less say over where they go, and for same-plant and lateral moves. Workers must be in the team four quarters before and at least four after. A team drops out when its new manager moves on, and every invention is dated at disclosure.
What happens to the team
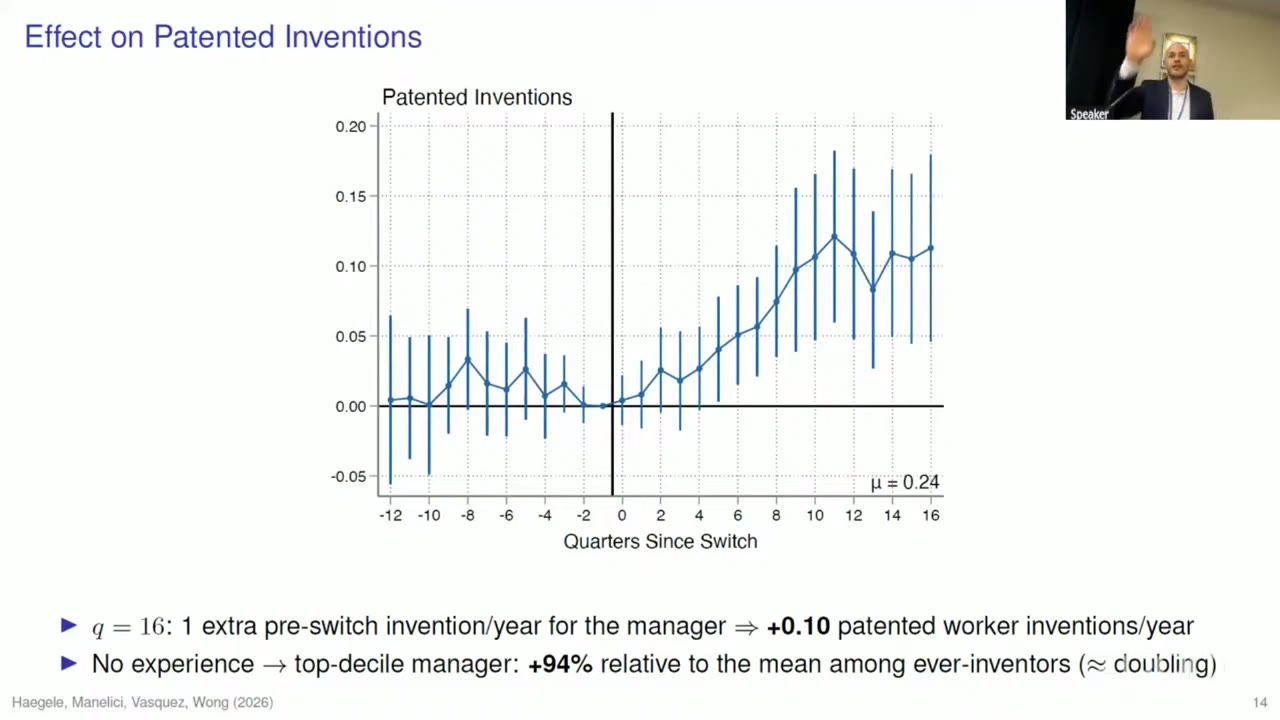
The patented-inventions plot is flat before the switch and climbs slowly after it, for about three years. The slide puts it as one extra pre-switch invention a year for the manager giving +0.10 patented inventions a year for the worker at quarter 16, or +94% going from no experience to the top decile. (That multiplication, 0.10 × 1.98 ÷ 0.24, gives about 83%. The plotted quarter-16 point is nearer 0.11, which gets you to the low 90s, so the “+0.10” is presumably rounded.) For all disclosures, filed or not, the speaker gives about 72%. That series stays near zero for two years and then steps up. He reads the gap between 94 and 72 as quality rising “a little bit more than quantity”. Raw and normalized citations rise too, and the conclusion slide puts citations at +92%.
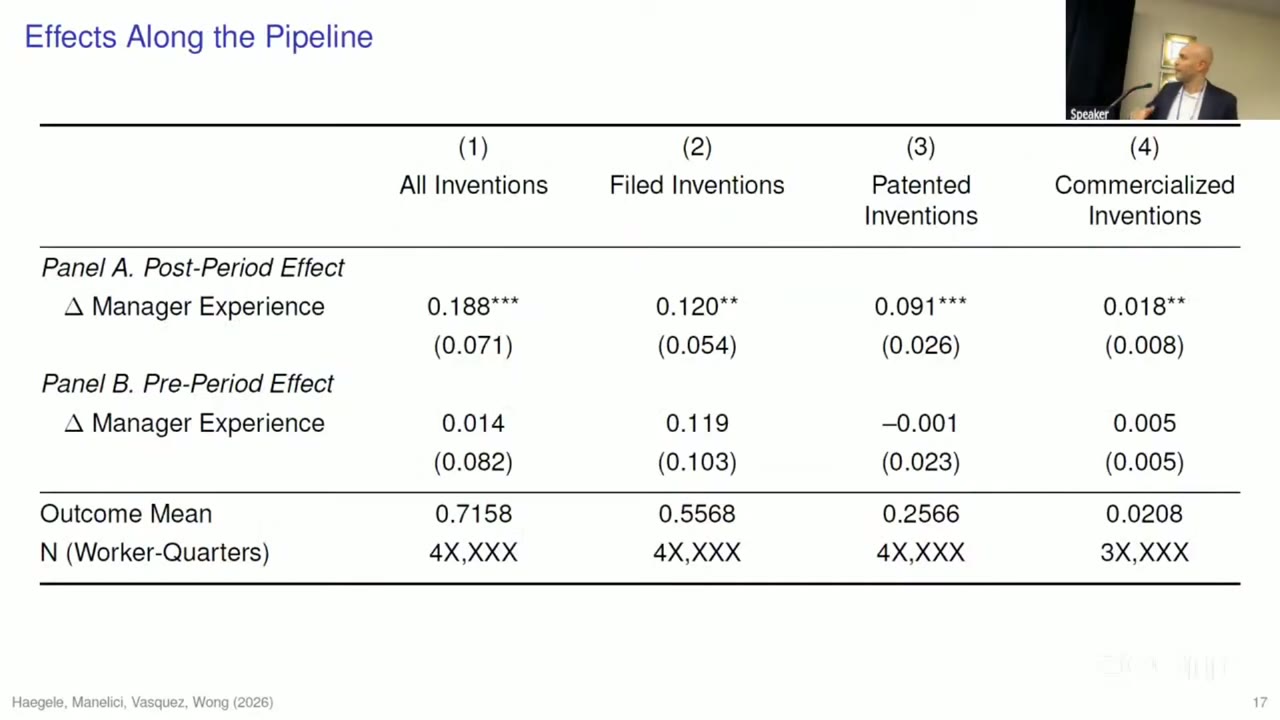
Then comes the pipeline table, the stranger result. In levels, the coefficient shrinks as you go downstream, from 0.188 on all inventions to 0.018 on commercialized ones. But the means shrink faster. Scaling each coefficient by 1.98 and dividing by its mean gives about 52% for all inventions, 43% for filed, 70% for patented and 171% for commercialized, which matches the conclusion slide’s “+173%”. Those match the dots on the horse-race slide below, which are averages over quarters 9–16. So the talk has two sets of magnitudes: 94% and 72% are the single quarter-16 point, while 70% and 52% are the two-year average. It quotes both without saying which is which. One cell deserves a glance. The pre-period coefficient for filed inventions is 0.119, the same size as the post-period 0.120. It is insignificant (s.e. 0.103), but it is the weakest spot in the no-pre-trends claim, and the talk did not discuss it.
Being one versus managing them
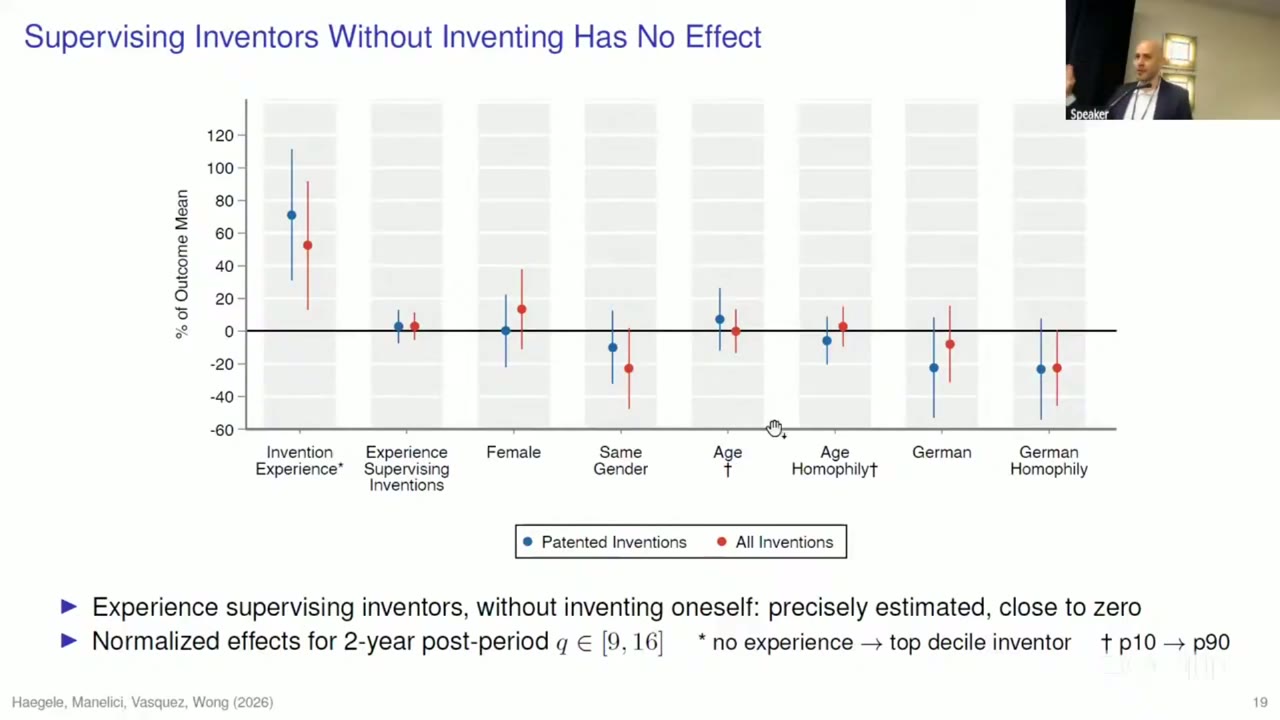
This is the surprising part. Run the same regression with the change in other manager traits as the treatment, and only invention experience comes out clearly. Experience supervising inventors, the thing you would call management-of-innovation skill if anything is, sits at about +3%. The slide calls that “precisely estimated, close to zero”, and Vasquez admitted “we thought this would be also a big thing”. Gender, age and nationality, and homophily on each, all straddle zero. Tenure, executive rank and a PhD, on a companion slide, give what the conclusion calls “no detectable effect”. That is the right phrasing, because those intervals are wide. The PhD estimate, in the speaker’s words, “seems to be a little bit lower”, but it is not significant. So the supervising result is a real zero, while the credentials are an imprecise nothing. The skill that transfers to the team is the manager’s own know-how, and watching other people invent does not seem to produce it.
Teaching, not cheerleading
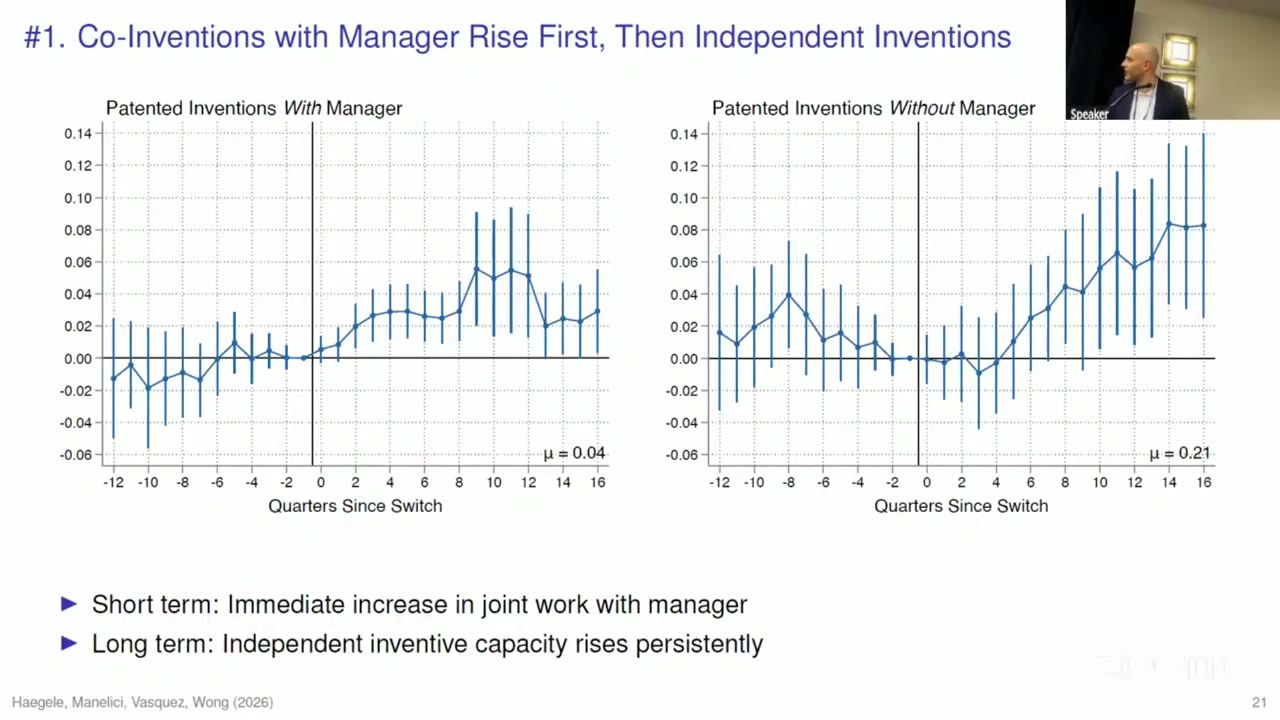
If the result were a star manager putting names on papers, it would sit entirely in the left panel. Joint inventions do jump at once, but inventions without the manager start rising about a year later and keep going. Vasquez reads this as “learning takes a little bit more of time”. The right panel is the cleaner test, since courtesy authorship cannot inflate it. (A loose end: earlier he said “around half” of disclosures and patents list the manager as co-inventor, while these means imply about one in six of a worker’s patented inventions lists their current manager. The denominators may differ, and the talk did not reconcile them.)
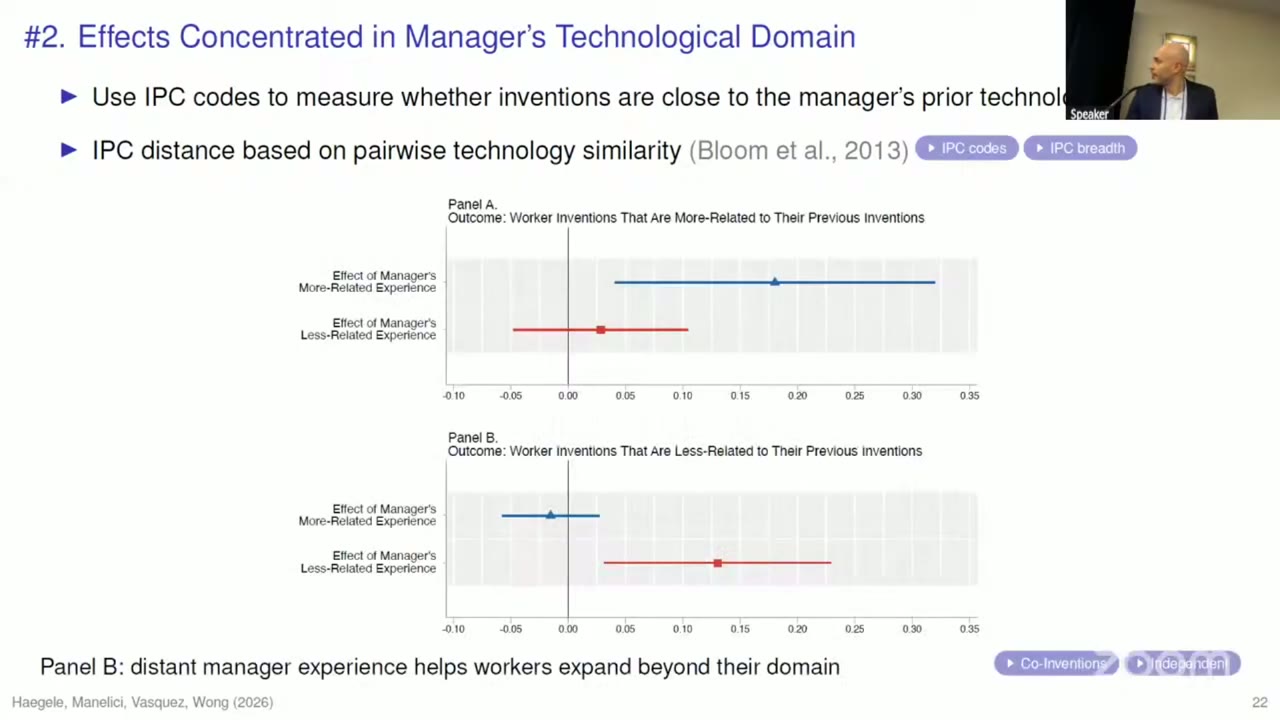
The evidence Vasquez likes best uses technology distance between patents at four-digit ipc codes, the Bloom et al. (2007) measure. He put it in seminar terms. If a trade economist gets a new advisor who also does trade, their trade papers go up and nothing else moves. If the new advisor is a micro theorist, the trade papers stay flat and the papers outside trade go up. That is what the plot shows. A manager’s experience close to the worker’s prior field raises work in that field by about 0.18. Experience far from it raises work outside it by about 0.13, and does nothing for the old field. An effort story, where a new boss just makes everyone work harder, would raise output in every field at once. The effect is also largest for workers who were already experienced inventors, which the slides label absorptive capacity, after Cohen and Levinthal (1990). The 360° ratings add a softer channel. Teams rate experienced managers higher on inspiring curiosity, supporting experimentation and finding time and resources for new ideas. They score no worse on other leadership items, and they rate themselves lower, which Vasquez called “a little bit humble”.
The other exits get a sentence each. The sample is incumbent workers, so the manager is not importing co-inventors, and retention and co-inventor networks do not move. On team size the speaker said “non-significant” and the slide says it “rises modestly”. The stable-team estimates that would settle this were in an appendix that was not shown.
What the room pushed on
All questions came mid-talk, and none of the questioners was named. On pay, about 60% of managers say inventions matter for promotion, but in interviews the money is “not that big of a deal”. On released disclosures, there is no text to check because of secrecy, but “probably quality has a lot a big component”. On workers moving with managers, he pointed to the before-and-after rule and an incumbent-only specification. On assortative matching, pre-switch team rank by invention output does not predict the incoming manager’s rank.
Two questions went at the late coefficients. The first was survivor selection: by quarter 16 only managers who stayed are left, and perhaps they stayed because things went well. Vasquez called it a fair concern. The effect is “a little bit attenuated” when teams are kept after the manager leaves, but “we cannot reject” equality. The second asked for an akm (1999) or Card–Heining–Kline (2013) symmetry check. He has not done it in that form, but splitting by the sign of gives “fairly symmetric” effects. Another questioner asked whether the firm places managers strategically to build up a technology. The team’s technology specialization does not predict which manager it gets. Effects are simply larger when the match happens.
The best exchange was about the pipeline. If a great idea gets approved by any manager, a larger percentage effect on commercialized inventions suggests experienced managers are waving through marginal ideas the others would kill. Vasquez disagreed. These are early-stage projects, and screening them is the skill. It is “like the advisor who receives the students and they pitch the idea”, and some have “a good smell test”. That is consistent with the table. It is also worth saying that +171% is a percent of a mean of 0.0208, on a coefficient significant at 5%, so the downstream number has a wider error band than its size suggests.
The firm rotates its managers so they will see the whole company. What their engineers seem to get from the move is the narrow thing each manager did before becoming a manager.