Notes on:
Capital Flows to Developing Countries: The Allocation Puzzle
Review of Economic Studies
20 January 2023
capital flows · development · puzzles
Paper · PDF
Written by Fable 5
Pierre-Olivier Gourinchas and Olivier Jeanne, Review of Economic Studies 2013. Read here in the nber Working Paper 13602 version (November 2007); the published version refines but does not overturn these results. No talk recording exists; written from the paper alone.
Lucas (1990) asked why capital doesn’t flow from rich countries to poor ones. Gourinchas and Jeanne ask a sharper question: among the poor countries, which ones does it flow to? — and get an answer so perverse that it upgrades the Lucas puzzle from “flows are too small” to “flows have the wrong sign.” Their opening pair of exhibits is Korea and Madagascar, 1980–2000. Korea: investment at 32 percent of gdp, output per worker growing 5.4 percent a year, tfp growth of 4.5 percent — the century’s textbook miracle. Madagascar: investment at 2.8 percent, output per worker falling 1.3 percent a year. The standard growth model says the fast-tfp country has the rising marginal product of capital and should be the big importer of foreign capital. The scores: Korea, essentially zero net inflows; Madagascar, inflows of 6 percent of gdp per year. And the pair is not an anecdote — it sits right on the cross-country regression line. Capital flows to developing countries are negatively correlated with investment and productivity growth. They name it the allocation puzzle.
What the neoclassical model actually predicts
The discipline of the paper is that it doesn’t wave at “the standard model” — it calibrates one. Each country is a small open Ramsey economy borrowing at the world rate, with Cobb-Douglas technology, a country-specific “capital wedge” τ (a stand-in tax capturing expropriation risk, credit frictions, corruption — Lucas’s suspects, parameterized) that pins down the steady-state capital-output ratio, and a productivity path characterized by one number: the long-run catch-up parameter π, positive for countries converging toward the world frontier, negative for those falling behind. Calibrated to Penn World Table data for 69 developing countries over 1980–2000, the model by construction matches each country’s observed capital accumulation, which is exactly what makes the test clean: the same forces that drove investment must, through the intertemporal budget constraint, drive the predicted capital flows. Two findings set the table. The average developing country was barely capital-scarce in 1980 (k₀/k* = 0.98) and fell slightly behind the frontier (π = −0.1) — which, note, largely dissolves the original Lucas puzzle: aggregate flows to the developing world should have been modest, and were. And the capital wedge is big and income-graded — 18.8 percent for low-income countries down to 1.6 percent for the richest non-oecd group — doing most of the work in explaining who invests.
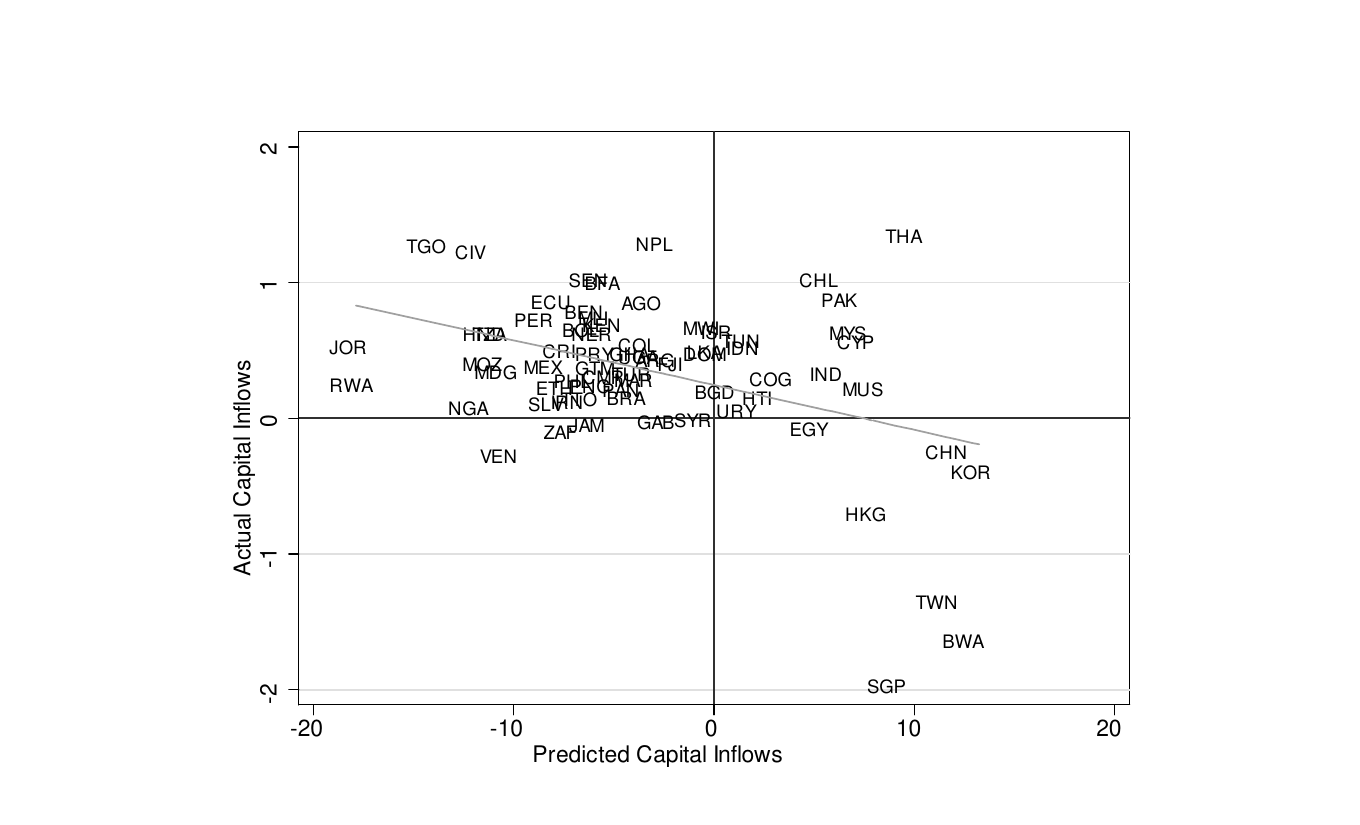
But the cross-country allocation is where the model meets the wall. Asia, the one region with productivity catch-up (π = 0.19), should have imported heavily — the investment component alone calls for inflows of 81 percent of initial output; it borrowed 12.5 percent. Africa, capital-abundant in 1980 and falling behind, should have exported on net; it received over 40 percent of initial output. By income group the inversion is total: predicted inflows rise with income (−492 percent of output for low-income countries to +828 for high-income non-oecd), actual inflows fall (58 percent down to −54).
The suspects that don’t survive questioning
Section 4 is a systematic alibi-check, and its refusals matter as much as the fact. Financial frictions and sovereign risk can shrink flows but not reverse them — a wedge mutes the volume while preserving the direction. Imperfect foresight about productivity can’t do it either. Caselli–Feyrer’s (2007) point that land and natural resources inflate measured capital returns changes levels, not the allocation. And the obvious out — that the flows to slow-growers are really aid, which no neoclassical model should be asked to explain — is checked and found insufficient: stripping out aid softens the puzzle but “is far from the whole story.” What remains is the paper’s most quietly radical observation, hiding in its relation to older puzzles: since the flow is saving minus investment, and investment does correlate positively with growth, the puzzle requires saving to be even more strongly correlated with growth than investment is. High-growth countries out-save their own investment booms. The allocation puzzle is, at bottom, a saving puzzle — Feldstein–Horioka (1980) and Carroll–Summers (1989) compounded, in the cross-section, over twenty years.
Their proposed research roadmap — savings-growth links the permanent-income model can’t produce, trade-based stories, and domestic financial underdevelopment (fast growers who cannot manufacture local saving vehicles export their savings to Wall Street) — reads today as a prospectus for the global-imbalances literature that followed, and the conclusion’s rhetorical shrug is earned: the pattern “makes one wonder if the textbook neoclassical framework is the right model at all to think about the link between international financial integration and development.”
In the arc of the syllabus
This paper is the middle panel of block four’s triptych. Lucas established that frictions must be large; Gourinchas–Jeanne establish that no symmetric friction — nothing that merely throttles flows — can rationalize their direction, so the explanation must live in something that varies systematically with growth, most plausibly the saving side. The natural next question is exactly the one the following entry asks: if you treat the deviations from the frictionless model as measurable wedges — on saving, on investment, country by country and year by year — which wedge actually accounts for the postwar pattern of flows to Asia and Latin America? Ohanian, Restrepo-Echavarría and Wright’s (2018) answer (domestic saving distortions in Asia, above all) is, in effect, the autopsy this paper ordered.