Notes on:
Is the Global Economy Deglobalizing? And If So, Why? And What Is Next?
Brookings Papers on Economic Activity
2023
geoeconomics · deglobalization · supply chain resilience · friendshoring · trade policy
Paper · PDF
Made with AI: Fable 5.1 (reading and writing)
Pinelopi Koujianou Goldberg (Yale, formerly chief economist of the World Bank Group) and Tristan Reed (World Bank, Development Research Group). Presented at the Brookings Papers on Economic Activity conference, 31 March 2023, and published in bpea Spring 2023 at pp. 347–396, with comments by Pol Antràs (Harvard, pp. 397–423) and Douglas Irwin (Dartmouth) and a general discussion. The version read for the paper itself is nber Working Paper 31115, April 2023, 51 pages, and page references below are to it; the published version restates a few numbers, noted where they matter. The discussion is read from the published session and the two discussants’ slides. The conference video is behind a Brookings registration wall; a Brookings podcast with both authors about this paper (11 May 2023, hosted by Gian Maria Milesi-Ferretti) has a transcript and was read, and is quoted once. Figures 1, 2, 4 and 6 and Table 1 are cropped from the working paper.
A ratio has two parts
In December 2022, at the opening of a chip plant in Phoenix, Morris Chang of tsmc said that “globalization is almost dead and free trade is almost dead.” The paper opens with this quote and spends fifty pages politely declining to find it in the data, which is a more useful exercise than it sounds, because it forces you to say what finding it would mean.
The usual exhibit is the ratio of world trade to world gdp, and the ratio does what everyone says: it peaked around 31 percent in 2008 and has wobbled between 26 and 30 percent since. But a ratio has a numerator and a denominator, and Figure 1 plots both. World imports of goods and services in constant 2018 dollars trended up after 2009, with dips in 2015–16 and 2019, fell in 2020, and in 2021 rose to a new high of roughly 27 trillion dollars. The numerator never reversed; the denominator grew faster, and Figure 2 shows where. China’s and India’s exports as a share of their own gdp fell from their peaks to about 20 percent each, as two very large formerly poor countries started selling to their own consumers, while Germany’s went to 50 percent, the United States sat at 10 and the rest of the world at 30 (35 in the published version). Capital and labor, in the paper’s summary, “suggest the opposite”: inward fdi stocks in the United States and the rest of the world are near 60 percent of gdp with no downward trend, and migrant stocks in Germany and the United States rose. (Germany’s inward fdi has not regained its pre-2008 peak, and China’s fdi stock relative to gdp has been falling since about 2000, so “the opposite” is a summary, not a law.)
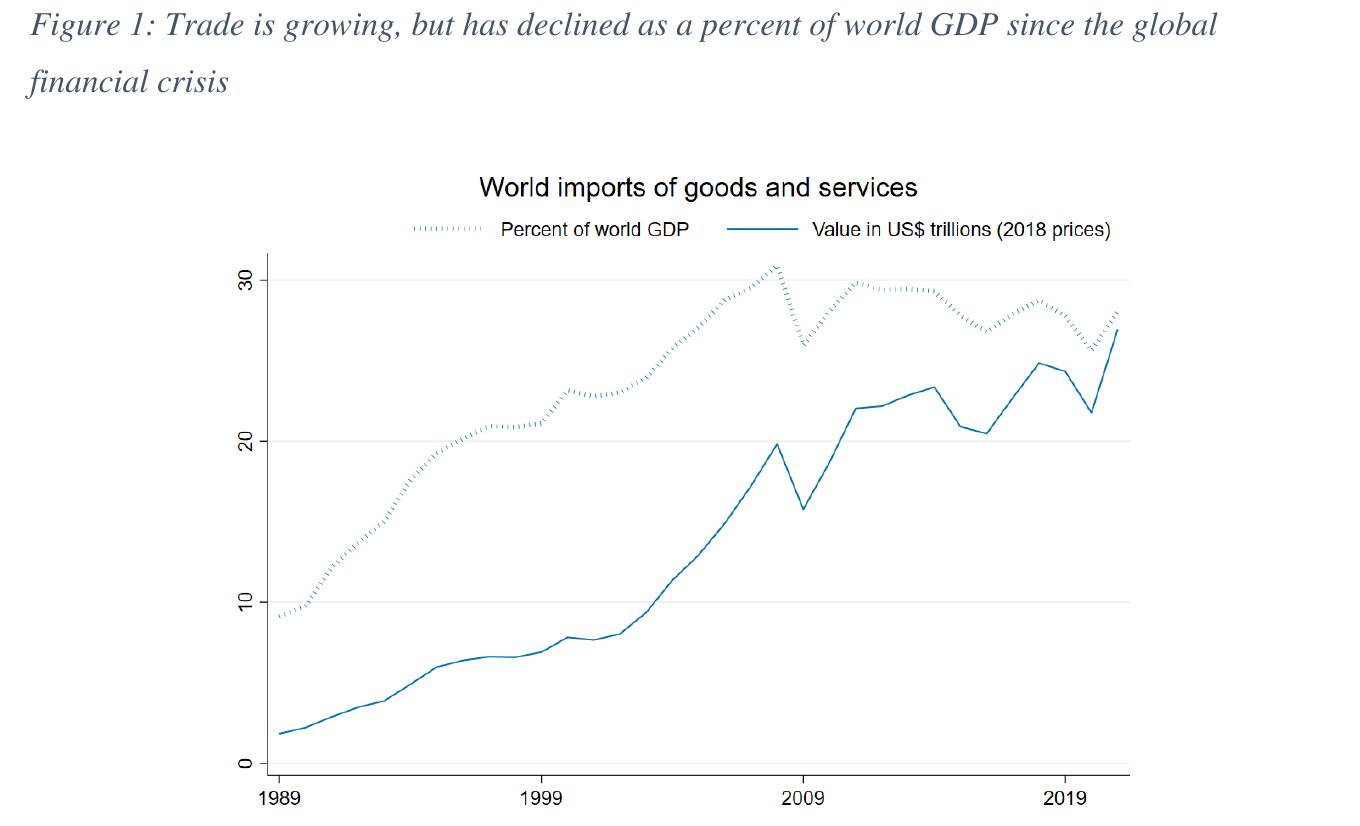
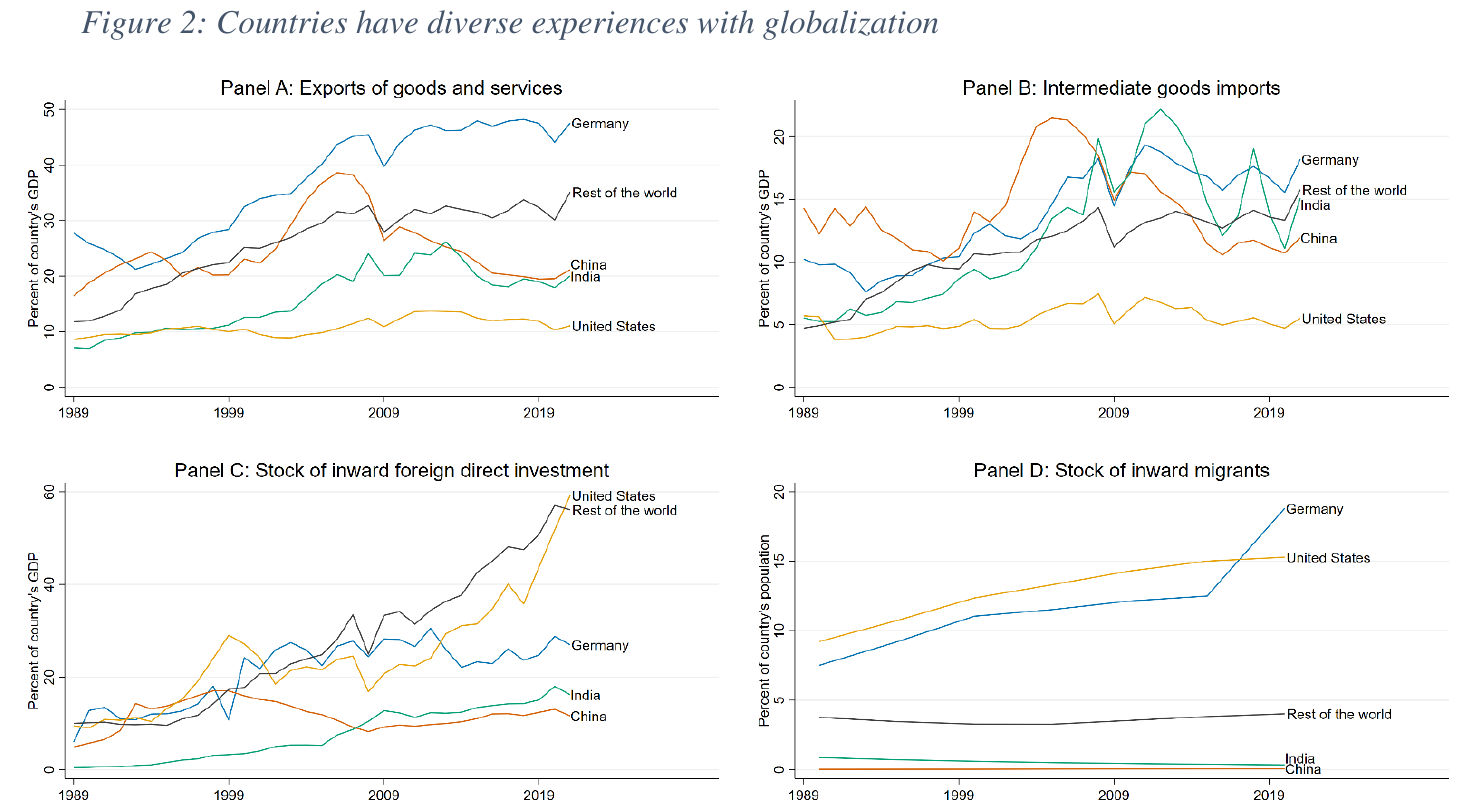
So the aggregate evidence for a reversal is a flat share whose flatness is partly the arithmetic of China and India growing up. “Slowbalization,” the paper allows, is the honest word. Its own summary is blunter than its title:
Overall, to date, there is no hard evidence in the data that we have entered a new era.
What changed is the policy, and the words
The paper’s other two metrics are not flows but the environment flows respond to, and there the picture is the opposite. Most of the 2018 tariffs are still in place under a new administration; the wto Appellate Body has lacked a quorum since the end of 2019, so when a panel found the steel tariffs illegal in December 2022 the United States could not even appeal. October 2022 brought the Trade Representative’s industrial-policy speech, a National Security Strategy that opens “The world is changing,” and export controls that require any third-country fab using us tools to obtain a us license before selling advanced chips to China. Meanwhile rcep entered into force and the cptpp is taking applications: the rest of the world is not turning inward so much as routing around one country that is.
The third metric is Factiva. “National security” now appears in a larger share of news articles than it did after September 11; “reshoring” entered common use in 2010, well before the administration usually blamed for it; “friendshoring” was coined by a commerce secretary in 2021. The paper’s reading is that flows lag policy and policy lags sentiment, so the data are the last place a regime change would show up, and the first two links have already moved. Its verdict: “we may be entering an era where the future of trade and globalization is shaped top-down by politically motivated governments rather than by market forces.”
Three phases and a whodunit
Section II rules out the tidy suspects. Technology fails: automation-heavy sectors imported more intermediates, not fewer, and offshoring involved sunk costs, so reshoring is not its mirror image. The 2008 crisis fails on timing, since trade recovered within a year and the backlash arrived in 2015. What is left is politics, in three phases: the China shock and the labor-market anxiety it produced in specific communities; the pandemic and the resilience argument; and the invasion of Ukraine and the national-security argument. Each supplied a new reason to dislike trade. The first already produced policy, and the paper calls the 2018 tariff war “a major departure” from decades of American liberalization; what is new in the third phase is the argument, national security rather than jobs, and the export controls that the paper says “can plausibly be considered the markers of a new era.”
Bent, not broken
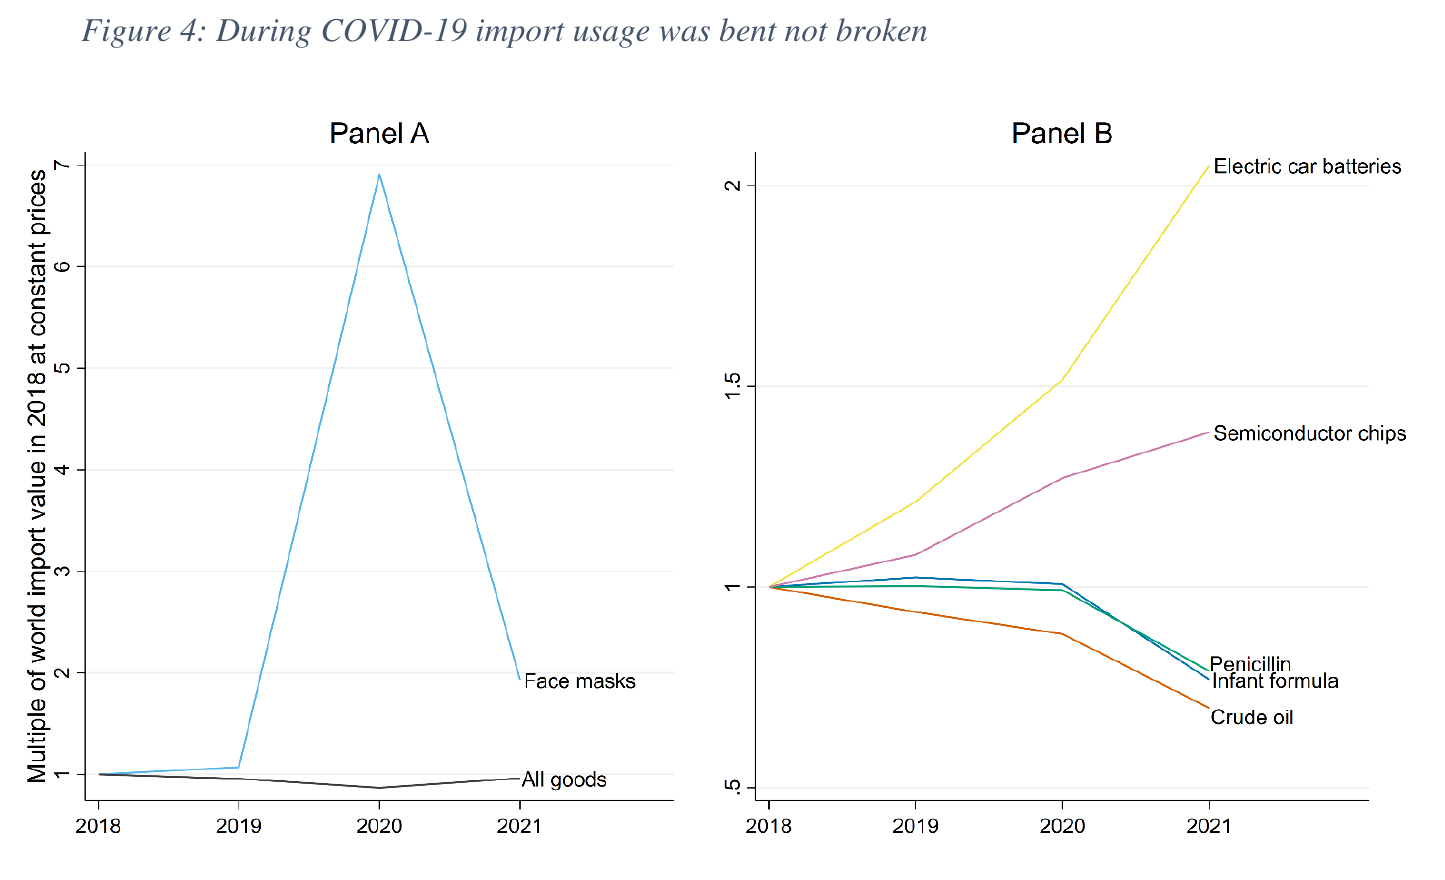
The pandemic is where the paper does its own empirical work, and it matters because “supply chains failed during Covid” is the premise of most of the resilience literature. Figure 4 plots world imports of six products as multiples of their 2018 value. All-goods trade dipped negligibly in 2020 and was back in 2021. Face-mask imports rose to nearly seven times their 2018 level in 2020, from China and Korea, which is the opposite of a chain breaking: domestic producers could not have met that demand, and trade did. (On the podcast Goldberg puts the shortage at “two weeks” before imports “filled the gap,” and adds the intuition the paper formalizes later: the shock was global “but not synchronized across countries,” so having foreign sources was the resilience.) Batteries and chips kept growing. Penicillin, infant formula and crude oil fell, but, in the paper’s phrase, “supply is not broken.”
The finer test uses Panjiva bills of lading, which name the us consignee and the foreign shipper on every container entering a us port. For each importer the authors compute an entry rate (share of its suppliers that are new this quarter) and a separation rate (share of last quarter’s suppliers that are gone), both averaging about 35 percent. In the March–May 2020 quarter, with real imports down 13 percent on the year, the entry rate spiked to 42 percent and the separation rate fell: firms kept their old suppliers and went looking for new ones. To isolate the supply side they build a firm-level exposure to foreign lockdowns,
where is firm ’s pre-pandemic share of container volume from country and stringency is the Oxford index, and regress
with firm and quarter fixed effects (the equations are unnumbered in the paper, p. 24). The quarter effects absorb us demand, so is the supply-side response alone.
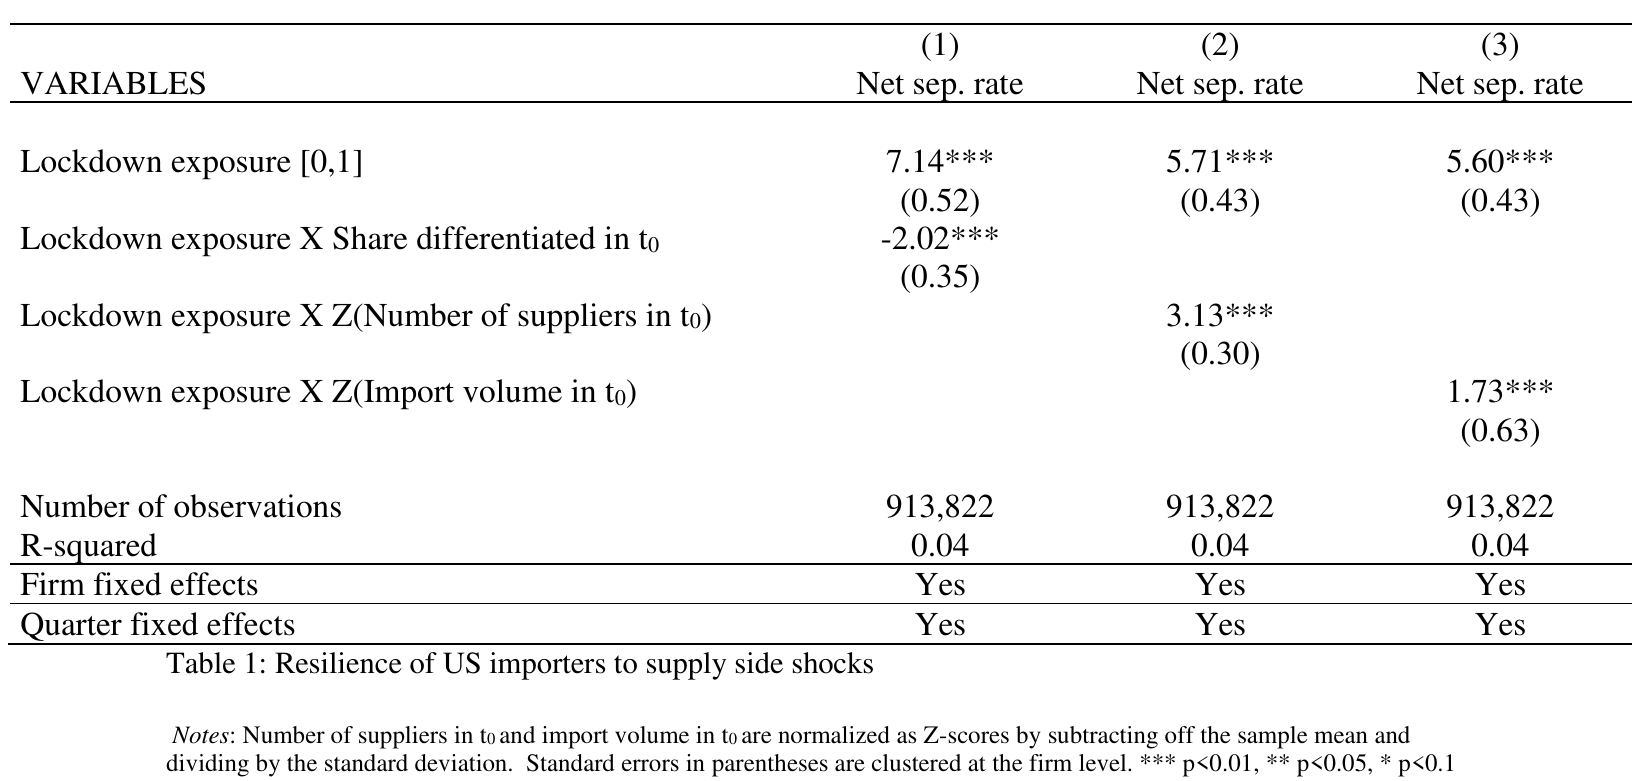
There is no column without an interaction, so the headline needs reading with its partner. Column (1) interacts exposure with the share of a firm’s imports that are Rauch-differentiated, a share between zero and one, so its 7.14 (standard error 0.52) is the effect for a firm importing no differentiated goods at all. Columns (2) and (3) interact with standardized supplier counts and volumes, so their 5.71 and 5.60 (both s.e. 0.43) are the effect at the mean firm. Either way: a firm whose suppliers all went into full lockdown saw its net separation rate rise by something between five and a half and seven points. So the supply shock did sever links, and the aggregate fall in net separations was demand, firms adding suppliers to chase durables and masks. Importers of differentiated goods separated less (interaction −2.02), which the authors call “perhaps surprising” before rationalizing it as relationship-specific investments being worth protecting; firms with more suppliers or more volume separated more (3.13 and 1.73), presumably because they had spares. Chains were hit, they bent, and the firms with the most to lose from breaking did not break. Bonadio and coauthors’ (2021) 64-country network model, cited in support, finds the 2020 contraction would have been worse without foreign inputs, since domestic inputs were locked down too.
Resilience has no unit
Here is the methodological contribution and the reason the paper is on this list. “Resilience” is the stated objective of most of the new policy, and nobody has said what it is. Brunnermeier’s “bend but not break” is the going definition, and the paper takes it seriously enough to show it does not operationalize: strictly, anything that survived a shock was resilient; loosely, anything that took “a long time” to recover was not, and how long is long? What one can do is list what the answer depends on. Whether the shock is to supply or demand (against a demand shock the structure of the chain is irrelevant). Whether it is idiosyncratic or correlated across locations (a pandemic is correlated, so diversification buys little). Where it originates (a shock at home makes a reshored chain less resilient, not more). Over what horizon and for whom. The sentence to memorize is on page 30: “it is impossible to think about resilience without specific reference to the type of shock to which resilience is sought.” The elasticities that would settle it exist only at levels too coarse to matter: at hs-10, Fajgelbaum and coauthors (2020) cannot reject an infinitely elastic export supply curve facing the United States, but Taiwan has 10 percent of us chip imports and, per the industry report the paper cites, “dominates” logic chips at 10 nanometers and below, and at that node the technology may simply be Leontief.
The upshot, in the conclusion, is that “there is not yet a quantitative benchmark for how much ‘resilience’ is optimal,” and that national security “can be difficult to verify without security clearance.” When globalization was justified by efficiency, you could run the model and argue about the number. The new policies are justified by objectives with no number, which is convenient for the policy and inconvenient for anyone trying to score it.
America was already friendshoring, by accident
The paper’s quietly funny exhibit is Figure 6. Along the bottom, on a log scale with China set to one, is each country’s 2022 share of us imports; up the side is the share of Americans who told YouGov in 2017 that the country is a friend or ally. The fitted line climbs from about 50 percent friendly at the smallest suppliers to about 70 at China’s size, a slope of 4.04 points of friendliness per unit of log import share (standard error 1.87): the United States already buys more from countries it likes. China is the outlier, at about a third friendly (the working paper says 35 percent; the published version splits it into 26 percent “friendly” and 6 percent “ally”) and the largest share. The trouble is that the same survey puts Malaysia, Vietnam and China, the countries the foundry model routed chip supply through, on the wrong side of its line, and the line is generous: “non-friendly” means fewer than half of respondents said friend or ally, and for many countries the modal answer is “unsure.” The non-friendly share of us semiconductor imports nonetheless fell from about 80 percent in 2020 to 55 percent in 2022, on gains by Taiwan, Ireland and Israel. On what did it, the paper is two-minded and the reader should be too: it introduces the number with “import shares for some goods appear responsive to policy,” dating the fall to the year “the U.S. articulated a friendshoring policy with regard to the sector,” and three pages later reads the same fall as the private sector decoupling “even without government intervention.” Friendship, the paper notes, is a volatile classification; two of America’s closest friends today were its main enemies in the last world war.
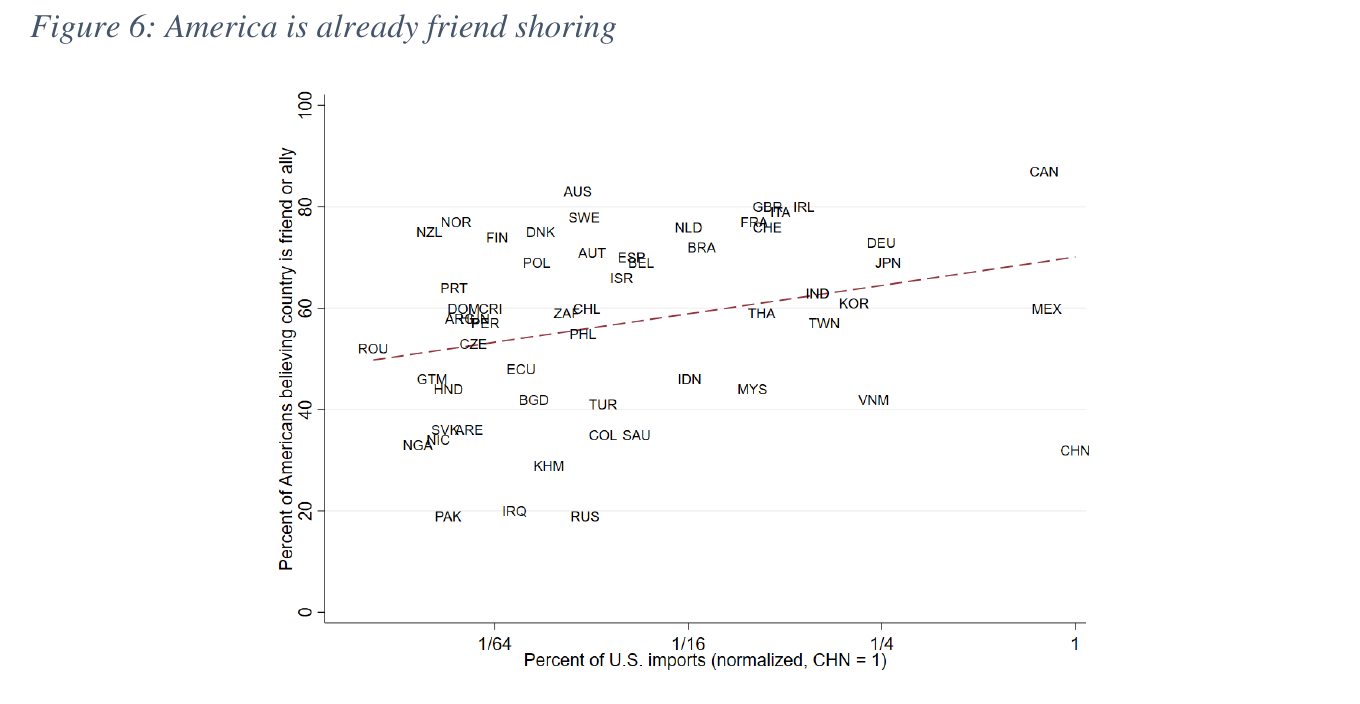
The more durable point is concentration. Non-friendly sourcing is low in most critical goods (under 20 percent of penicillin, under 5 percent of infant formula; face masks at 73 percent from China are the exception, and the product trade rescued in 2020). But concentration is high everywhere: 75 percent of formula from Ireland and Mexico, because most other sources pay a 14.9 to 17.5 percent tariff; 70 percent of crude from Canada and Mexico. Concentrated among friends is not vulnerability to geopolitics, the paper says, “at present!”, but it is vulnerability to everything else, and to friendship changing. On the security argument the paper is careful: the chip controls were not lobbied for (the industry was told to comply or lose us tools), so “deglobalization is not market-driven”; and it offers, without endorsing, the reading that they are containment rather than security, quoting Jake Sullivan on keeping “as large of a lead as possible.”
Section III, on consequences, is flagged as speculation and reads as such: resilience could go either way, growth is the worry, and on peace the paper cites de Bromhead and coauthors (2019) on the 1930s, when the Empire’s share of British imports went from 30 to 42 percent in nine years and the era acquired the name “pre-belligerency.” The resemblance, the authors say, is eerie.
The discussants think the reading is too comfortable
Both discussants sign the headline. Antràs (2023) opens with the line the paper deserves, that “you can see the deglobalization age everywhere but in international trade statistics,” and unlike Solow’s (1987) version this one is not mismeasurement: “as of today, the world is simply not deglobalizing.” He calls the pandemic finding “uncontroversial” and the Panjiva work “novel micro-level evidence.” Then, having been “asked to provide a critical discussion,” he dutifully complies, and the complaints are the interesting part.
The first is that the paper’s sunk costs are too small. Antràs, Fort and Tintelnot (2017) found that the average us importer sources each product from 1.11 countries, the median from exactly one, and the 95th percentile from 1.61. That is what “lean and mean” sourcing looks like when a firm has paid to find, qualify and build trust with a supplier, and it makes “China plus one” a much more expensive slogan than it sounds. He is “skeptical” that firms will do it, on the grounds that the people who chose single sourcing were not making a mistake. The second is a variable the paper leaves out: hyper-globalization happened alongside a secular fall in real interest rates, with about half of world trade crossing more than one border by the Great Recession, and cheap capital is what makes a multi-year sourcing relationship worth starting. Higher rates raise the cost of reorganizing a chain in either direction, which is an argument against reshoring and friendshoring as much as against the chains they would replace.
The third goes at the paper’s third phase. Goldberg and Reed call the invasion of Ukraine the “catalyst” of the national-security turn; Antràs thinks that gives Russia a role its trade cannot carry. Russia’s share of world exports is below half a percent in every sector where value chains are dense (vehicles, electronics, machinery), below 10 percent in every two-digit industry, and 11.5 percent in crude and 9.1 percent in gas (18.7 percent by the iea’s pipeline data). A Russian decoupling is a European energy problem, not a global trade one, and the things the paper dates to 2022 mostly predate it: Section 232 tariffs, the chip-shortage panic, Raimondo pitching the 52-billion-dollar chips package to Congress in 2021. A counterfactual without the invasion, he says, “would have still witnessed rising geopolitical tensions.” What worries him is China, and specifically with whom China would decouple. China is the top trading partner of Australia, Japan, Korea, Chile and Brazil, so in a bloc scenario those countries face a real choice, and “the United States might end up being left more isolated than many commentators currently expect.” (Hold that thought for the Gopinath (2025) paper, which has to draw the blocs before it can measure the gap between them.) He is more pessimistic than the authors on migration, where he thinks the costs of closing up would be “orders of magnitude” larger than in goods, and he closes on method: quantitative trade models have “too high a ratio of calibration to estimation,” and none of them contains a government that behaves like one. Trade economists can price any set of trade barriers; they cannot say which set is coming.
Irwin, who presented “Is Globalization Today Really Different from Globalization a Hundred Years Ago?” at Brookings in 1999 and finds it a little rich to be back for the sequel, supplies the long series. Trade shares have plateaued before, in the 1880s and the 1960s, and reversed once, between the wars, when “policy can act not just as a brake on integration but can also throw the whole vehicle into reverse.” Baldwin’s point that part of the post-2011 fall is commodity prices coming off the super-cycle, not volumes, and that services and data trade keep growing, gets his endorsement: “globalization is evolving and changing, not declining.” Then the sentence this digest most needs, because it bears on the benign arithmetic above. The fall in the export share “can be observed in two large countries, China and India,” and “whether the recent decline is due to some natural rebalancing or to active policy measures to limit trade is unclear and deserves further study. But a case can be made that these two countries have been turning inward under President Xi Jinping and Prime Minister Modi.” If it is policy, it has a price, and he quotes the imf’s range: around 1 percent of gdp for trade fragmentation alone, 8 to 10 percent with technological decoupling. He agrees with the authors that economists now have to argue about national security rather than file it under non-economic objectives, citing Adam Smith on defence being “of much more importance than opulence.”
The floor pushed on the same seam from several sides. Obstfeld argued that friendshoring “reinforces negative sentiment” and “perpetuates a cycle of fragmentation,” and that a United States inside tpp would have had more leverage to bring middle-income countries onto the Russia sanctions. Acharya and Haltiwanger asked whether the goods focus is measuring the wrong thing, since services trade is undercounted and what looks like deglobalization may be “a restructuring”; Goldberg’s reply is that services trade is smaller and more restricted, and that ai policy is heading the wrong way for it. Steven Davis offered the Cold War case that rivalry buys innovation, and may buy more than trade loses; Goldberg said there are cheaper ways to buy innovation, and Reed cited Jia and coauthors (2022) on the China Initiative cutting publications and citations of us scientists with Chinese collaborators. Pingle noted that trade rebounded after the First World War too. Goldberg drew the distinction the essay leans on, level versus direction, and Reed closed on Blackwill and Harris’s (2016) War by Other Means, a book about why economists are losing the argument to the people with clearances.
So the session’s net position is roughly: the flows say no, everyone agrees; the reasons the flows say no may be less benign than the paper’s arithmetic (Irwin), the reasons they will keep saying no may be structural rather than political (Antràs on sunk costs and rates), and the shock the paper picked as the turning point is the wrong one (Antràs on Russia). None of that contradicts the paper’s verdict. All of it complicates the story a reader would tell about the verdict.
Where it sits
Context in 1.2, read directly after the imf note (Aiyar et al. 2023) that defines geoeconomic fragmentation as a policy-driven, strategically motivated reversal of integration. That note supplies the definition; this paper supplies the null. Its answer to its own title is: not in the flows, yes in the policy, and flows follow policy with a lag, so ask again later with a better instrument than a ratio. The better instrument is the rest of the sub-block. A geopolitical line in trade cannot be seen in Figure 1, because Figure 1 cannot tell China selling to its own consumers from China being cut off, and after Irwin it cannot tell either of those from China deciding to sell to its own consumers; it needs a pair-level comparison of between-bloc and within-bloc trade against a pre-period, which is what Gopinath, Gourinchas, Presbitero and Topalova run, estimating in that paper that between-bloc trade has run 11.4 percent below within-bloc since 2022, and what Alfaro and Chor (2023) do at the product level. Those papers are in part answers to this one, and should be held to its standard: a relative gap of that size is consistent with an aggregate that never falls, and rerouting through countries fewer than half of Americans call friendly is not obviously the friendshoring anyone announced. Mayer–Méjean–Thoenig (2025), at the end of the sub-block, is the attempt to give the objective a unit; this paper is the record that in 2023 it had none.
What Goldberg and Reed would need to see, on their own terms, is a decline within a trading pair that survives controlling for what each side was doing with everyone else, a rerouting that changes who bears the risk rather than relabeling it, and, before any of it is called a success, a statement of the shock the policy was meant to survive. The lag between policy and flows, they said, would be a while. It turned out to be about two years and one gravity regression.