Notes on:
The Nonemployee Workforce
NBER EMRI conference paper
18 September 2026
nonemployee work · tax data · gig economy · employment measurement
Talk · Paper · PDF · Transcript
Made with AI: Opus 5 (reading and writing), GPT 5.6-Sol (reading), Fable 5.1 (adjudication), Sonnet 5 (verification)
Part of Innovations in Measuring Employment, Fall 2026
Every self-employment statistic the United States publishes is built from something a worker told the tax authorities about themselves. Census has run Nonemployer Statistics for decades: an annual count of businesses with no employees, assembled from business income tax returns — mostly the Schedule C a sole proprietor staples to their 1040, plus partnerships and S and C corporations — with a $1,000 receipts floor. It is a census of filings. If you supply labour for money and never file, you are not in it, and you are not in the employer frame either, because nobody issued you a W-2. The paper’s own phrase for these people is “out of scope from both the employer and nonemployer frames.”
What Martha Stinson brought to the second day of the conference, on behalf of eight Census co-authors, is the fix, and the fix has a nice structural property: it stops asking the worker. irs Form 1099-nec is an information return. The firm buying your labour files it, reports what it paid you, and files it whether or not you ever tell the irs anything at all. So it is testimony by the counterparty, which means it can see people whose own testimony is missing — and, because it carries both the issuer’s ein and the recipient’s ssn, it is the first administrative record in American statistics that links a nonemployee to the specific firm buying their labour. That link is the whole product. Hold onto it; the discussant spends her best minutes on the ways it breaks.
The draft is dated 14 September 2026 and was presented four days later. Section 4 calls its own numbers “proposed empirical tabulations” for a work in progress, and Stinson opened the results by saying the statistics “were cleared through census and released this spring. They’re not our final numbers. These numbers are very much in flux.” Take that seriously — and also note, below, that the draft contains a number that is simply wrong, in a way its own slide corrects.
Why there were no dynamics, and why one Schedule C is not like another. The existing series is a stock. “It does not provide us any information about any kind of transitions of people in and out of this type of work,” Stinson said; what is missing is “the opening and closings of these non-employer businesses… movement of people in and out of self-employment jobs.” There is no nonemployer analogue of the Quarterly Workforce Indicators or the Business Dynamics Statistics, which is a strange gap given how much of the last decade’s labour-market argument has been about exactly these flows.
The second defect is subtler. Because a single form absorbs every kind of independent work, the frame cannot tell the categories apart: “contractors, rideshare drivers and piano teachers, teaching piano lessons at their house can all be filing this same type of Schedule C. And so it makes it hard to distinguish them.” The team’s answer is a spectrum running from W-2 workers who own nothing, through routine contractors who “may even go and sit in the office next to the employees, they don’t get a W2,” through transitory freelancers and gig workers, to owners with no employees and then owners who employ. Today the three middle boxes collapse into one orange Schedule C triangle. The 1099-nec is supposed to split out the first of them; the 1099-K is supposed to split out the second, and is not yet linked. This is a retreat from last year’s framing, which treated all 33 million Schedule C filers as business owners and drew, in Stinson’s telling, a lot of pushback.
The form is mostly not about workers. Before the labour story, the accounting. In tax year 2022, 6.4 million issuing eins filed 69.0 million 1099-necs reporting $5,726.3 billion. Of that, $5,131 billion went to other businesses — recipients identified by ein, not by a person. The paper’s own gloss is that “nearly 90 percent of all 1099-nec dollars flow to other business entities rather than to people.” Individuals receive 53.8% of the forms and 10.4% of the dollars, and the skew is worst exactly where you would expect the labour story to be strongest: multi-unit employers send 55% of their forms to individuals and 7% of their dollars.
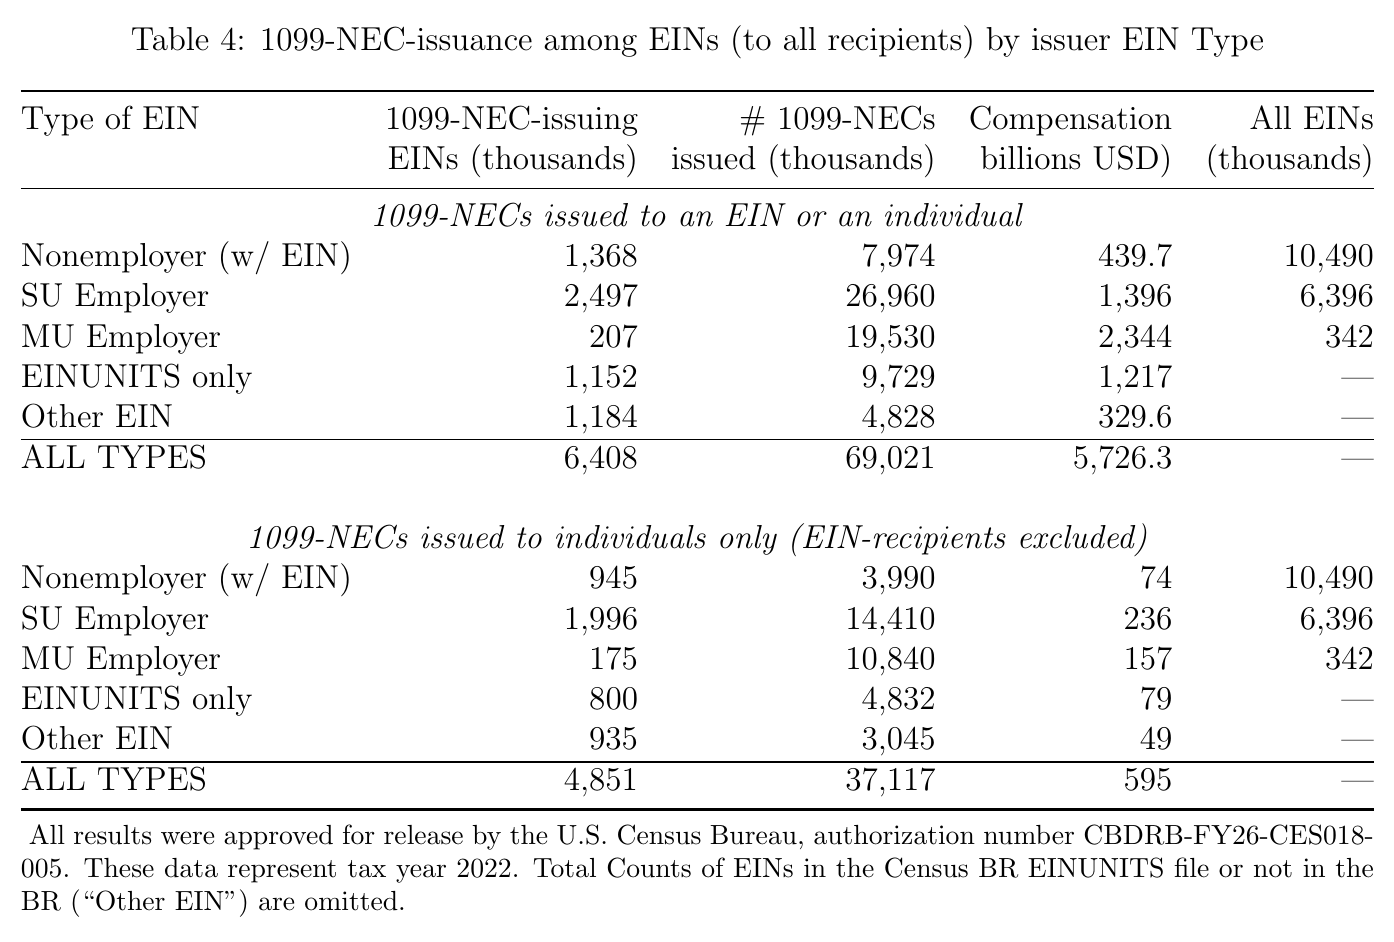
This is not a flaw — the paper is about the tenth of the dollar volume that reaches people, which is the right slice — but it does mean any headline quoting 1099-nec dollars without the pik/ein split is off by an order of magnitude. Keep the two individual-recipient totals apart, too: the tables report $595 billion topcoded, the prose $823 billion untopcoded, and Table 11 reconciles them exactly. Neither the discussant nor the floor raised any of this.
The reconciliation. Now the part the talk was built for. Take everyone who received a 1099-nec in 2022 and everyone who filed a Schedule C, and match them person to person — “a straight simple pik-to-pik match,” no cleverness. About 25.5 million recipients, about 25.6 million filers, and slightly more than half of each in the overlap.
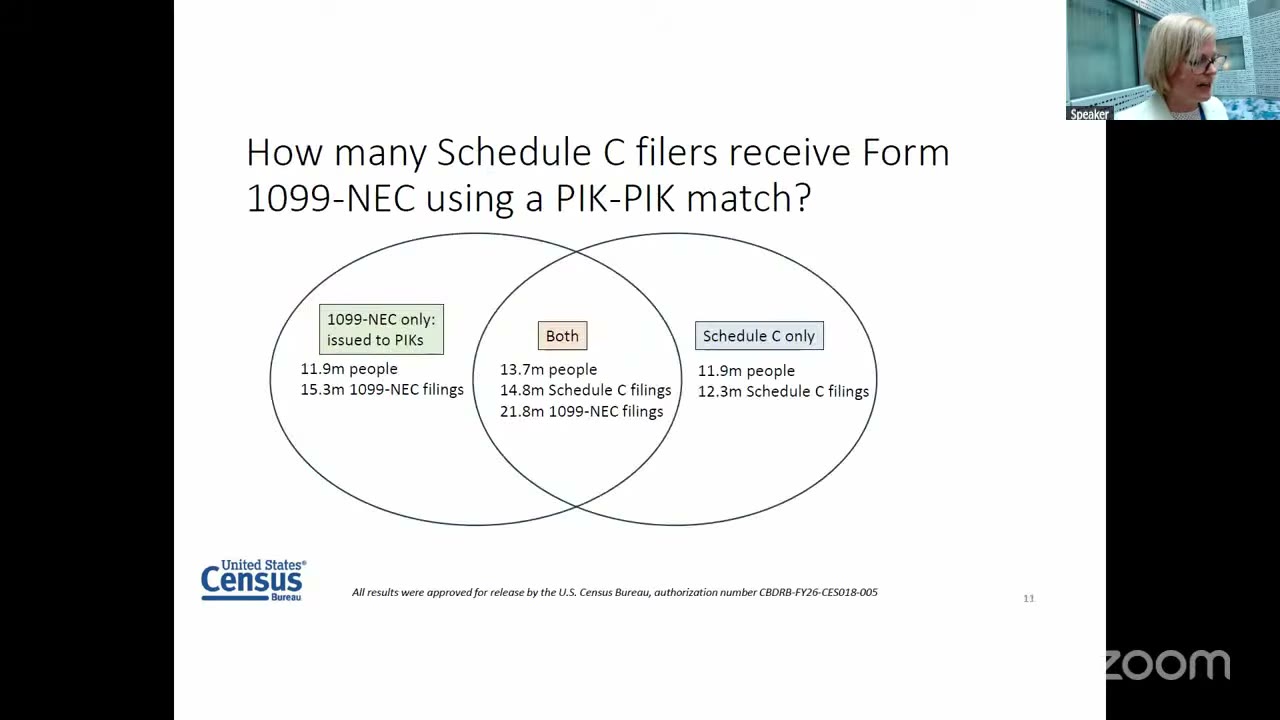
Here is where the draft trips over itself, and it is worth being exact because the correct number is on the authors’ own slide. The prose on p. 33 reads: “Of these, more than half (15.3 million) both received a 1099-nec and filed a Schedule C.” That is not what the overlap is. Table 11 puts 13.7 million people in the overlap; 15.3 million is the count of 1099-nec forms received by the group that filed no Schedule C — the adjacent cell, one column over. The slide prints 13.7m; Stinson said “just over 13 million workers”; and the arithmetic only closes with 13.7, since 13.7 + 11.9 = 25.6 matches the totals in the same paragraph and 15.3 + 11.9 = 27.2 does not. Two smaller slips ride along in the same draft: the ~$1.8 trillion of Schedule C revenue is called 2021 in one sentence and 2022 in the next, and Table 12 prints a mean income of “13.375” where it means 13,375. A four-day-old draft is allowed a typo; this one happens to sit on the paper’s headline reconciliation, which is why it is worth saying out loud.
Who the missing eleven-point-nine million are. The two non-overlapping wings are the same size, which is a tempting symmetry and a false comfort, because they are not the same people. Among 1099-nec recipients with no business filing, 40.0% are under 35, against 29.0% of nonemployer sole proprietors, 13.9% of owners of other nonemployer entities and 11.1% of employer-firm owners. The Black share is 22.1%, against 13.4%, 6.1% and 6.7%. From the podium: these people are “disproportionately not female, so male, they are disproportionately black and not white, and they’re disproportionately Hispanic, us-born and very young,” and “Almost 40% of this type of nec recipient falls in the under 35 age category.”
Stinson’s list of why the match fails is worth having, because each failure is a different kind of invisibility. The paying firm may issue to the worker’s ein rather than to a person — “totally legal and fine,” and it just requires another bridge. The family may file jointly, so that the Schedule C owner “is not always the recipient of the 1099… sometimes the person who gets the nec is actually the partner or even a dependent.” The family may file a 1040 and put the money on the other-income line. Or the family may file nothing at all: “if they have no income tax obligations… and they either don’t know or are choosing not to know that they owe self-employment income tax.” That last category is the one with consequences beyond measurement, and Stinson drew the measurement one: “these 1099s who are not filing any 1040 or any Schedule C, they lead us to a miscount of the self-employed.” Note what the paper does not do with that: it publishes no revised headline count of self-employment. It publishes the size of the hole.
The churn. And then the thing that only an information return with a date and a counterparty on it could ever have shown you.
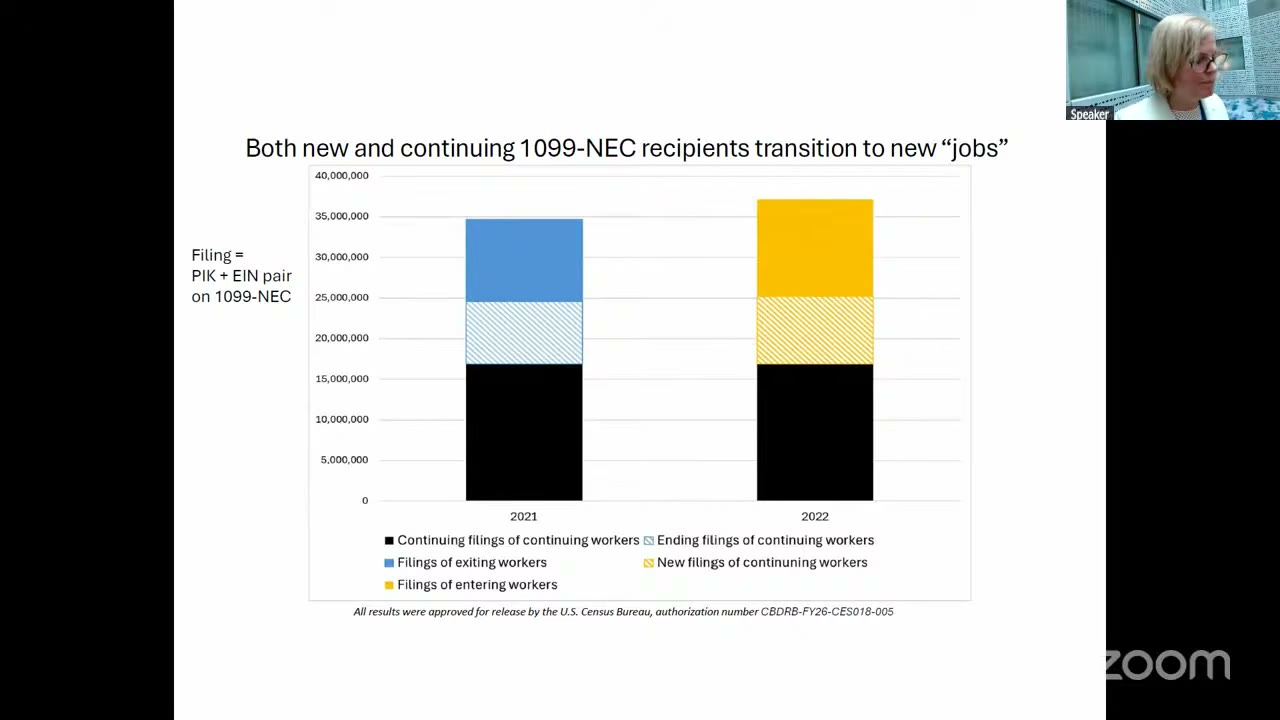
A filing is a pik–ein pair: one contractor, one client, one year. There were 34.7 million of them in 2021 and 37.1 million in 2022. Only 16.9 million pairs — 45.4% of the 2022 total — existed in both years. Of the rest, 32.0% (11.9 million filings) went to somebody who received no 1099-nec at all in 2021, and 22.5% (8.3 million) went to a continuing recipient who had found a new issuer. Person-level entry runs at the same order: 10.4 million entrants averaging $11,000 against 15.1 million continuers averaging $32,000, so roughly two-fifths of nonemployees were not observed as nonemployees the year before. “I want you to think of a filing for a minute in your head as a job,” Stinson said, and later, “there’s all this churn in the 1099 world and in fact, maybe much more than in the employment world.”
Two guardrails, both of which the talk supplied itself. The first is accounting: 37.1 million filings against a stock of roughly 25.5 million recipients, so this is relationship churn, not worker churn — a contractor with three clients generates three of these. The second is that no comparable W-2 statistic was shown, so “maybe much more than in the employment world” is a conjecture with an honest “maybe” in front of it, and should stay one.
Houseman, who found the load-bearing wall. Susan Houseman took this paper and the Garin–Jackson–Koustas–Miller gig-worker paper in a single discussion, and she opened generously: this is “an incredibly important new resource for research and policy,” the fix for the lehd’s “major shortcoming… that the analysis is limited to workers in employee W2 employment arrangements.”
Her most actionable comment was a word. The draft calls the 1099-nec recipients with no Schedule C “latent businesses.” Houseman: “I might suggest that they drop the latent business owner language. These are people who are probably most likely working as independent contractors for businesses and don’t think of themselves as business owners and probably will never set it up.” Stinson had already reported taking pushback on calling all Schedule C filers business owners; Houseman simply noticed that the new category had inherited the same assumption under a new adjective, and the term is load-bearing in the draft.
Her sharpest comment was structural, and it goes at the link. Workers paid through a third-party payer — “PayPal, Stripe, Venmo or large platform companies like Uber, Lyft, Upwork that issue 1099Ks” — are largely absent, and “in most states the threshold for the 1099K is much higher, $20,000.” That much is the reporting-threshold problem everyone at this conference already knew about, and the paper concedes it: the routing rule is that a payment settled through a card network or a tpso is reported on a 1099-K by the processor instead of a 1099-nec by the firm, “even if the payment constitutes nonemployee compensation,” so the 1099-nec “does not represent app-based workers.” But Houseman’s version is worse than a coverage gap, because where a processor issues the form, “we can’t link the worker to the business sector.” Census will still see the worker somewhere in the tax records and may not know who they are working for. As businesses increasingly pay through systems like PayPal, “we’re just going to miss that link” — and the link is the entire novelty of the product. She noted the mirror image on the employee side: staffing and temp agencies issue the W-2, so “we don’t know where their labor services are actually provided.” Her question, which nobody had an answer to, was “how big is this phenomenon?”
The rest came fast. Annual frequency is “insufficient for much policy making.” Without job sequences the paper’s “moonlighting” label is unsupported — “we actually can’t tell if people are moonlighting because we don’t know the sequences of jobs. It may be a main job for some period of time” — which lands, because the pie charts showing 48% of 1099-nec recipients earning more in wage work, and Stinson’s gloss that “this contract gig is something very much on the side,” are entirely annual. And the finding that these people are not business owners “underscores the need to improve worker class questions in government household surveys”: Houseman, Katharine Abraham and Upjohn colleagues have been testing questions with Gallup, one study ongoing, and “we think we’re capturing a lot of these people with better questions” — people who, exactly as in the Census tabulations, are “non-white, younger, less educated and the like.” The administrative frame’s best argument for itself turns out to be an argument for fixing the survey.
Thirty seconds a side. The session ran late, so the chair rationed. Stinson: “The 1099k is actively being linked this summer,” and the reason it is not in this draft is a bureaucratic option value rather than a technical one — “It’s called disclosure review. And as soon as you do one, you have to be very careful of what you release next. So anyway, we opted not to release our 1099k’s in a hurry.” She then conceded, gracefully, a fact about her own instrument: “this is something I did not know, that the 1099 necs and Ks are sometimes issued by the same company. So thank you for bringing that to our attention.”
Andrew Garin used his thirty seconds to argue for the Census build against his own body of work. The irs research he and his co-authors have done is “not a kind of sustainable research infrastructure. It’s not what the irs jsrp was made for.” More pointedly: “most of the tabulations that you guys present today, we have put out in various forms and in a way that we won’t be able to do going forward” — demographic cuts for 2016, comprehensive cross-tabs for 2018 — so the valuable next step is not new tabulations but reconciliation. “It should be the same universe. What decisions matter and documenting that in a sustainable way.” He also pointed them at a working paper by Katie Lim, Eleanor Wilking and Max Risch (the surname is indistinct on both tapes) with “almost like 100 tables and graphs” on the dynamics of these relationships in 2016, including “do people go and come back?” — which bears directly on the churn number, since a contractor who takes a year off and returns shows up in that 32.0% as an entrant.
Nobody challenged the churn number, the dollar split, or the decision to treat a 1099-nec filing as a job. Which is a little surprising, because the presenter did. Stinson’s own closing slide asked “does an information return like a 1099 nec constitute a job? Do we want to measure that?” — and she had already flagged that “making a longitudinal time series of tax data is not for the faint of heart,” with the $600 threshold rising to $2,000 for tax year 2026 under last year’s legislation, which will make the 2026 vintage of this series incomparable to the 2022 one by construction. The public-use tables are promised for the January statistics session. The conference spent two days on the proposition that the United States is losing the ability to count its workers; this is the rare paper that proposes counting a group nobody was counting at all, which means its first published number will have no benchmark to be revised against, and nobody in the room will be able to say whether it is right.