Notes on:
Global Supply Chains: The Looming "Great Reallocation"
NBER Working Paper 31661
21 May 2024
geoeconomics · supply chains · US-China · friendshoring
Talk · Paper · PDF · Transcript
Made with AI: Opus 5 (reading and writing)
Laura Alfaro (Harvard Business School) and Davin Chor (Tuck School of Business, Dartmouth). Commissioned for the Federal Reserve Bank of Kansas City’s Jackson Hole symposium of 24–26 August 2023 and never published in a journal: it remains a working paper. The text used here is nber Working Paper 31661 (September 2023, 51 pages), which is the later of the two circulating copies; the same paper also goes around as Harvard Business School Working Paper 24-012, whose body is word-for-word the same apart from one footnote the nber version adds. The paper’s discussant at Jackson Hole was Kadee Russ. The video used here is a separate occasion with a different discussant: Alfaro presenting this paper, along with a newer companion work in progress on the bank financing of the reallocation, at the Atlanta Fed’s Financial Markets Conference on 21 May 2024, discussed by Julian di Giovanni (New York Fed) and moderated by Camelia Minoiu (Atlanta Fed); 60 minutes. The tables and charts below are crops from the nber working paper; the one slide image is a frame from the video. The transcript is YouTube’s auto-captions, so wording attributed to the speakers is close but not verbatim.
The paper’s job was to look
Jackson Hole 2023 asked Alfaro and Chor a plain question: with five years of tariffs, a pandemic and a war behind us, what do the data say has actually happened to supply chains? The answer has to be given with the data that exist, which is the paper’s first honest point. The proper object — value added traced through world input-output tables — is unavailable for the window that matters, because the World Input-Output Database stops in 2014 and the oecd inter-country tables in 2018, and the episode starts in 2017. So the paper works with gross product-level trade from un Comtrade at the four-digit level, supplements it with an upstreamness index (Fally 2012; Antràs, Chor, Fally and Hillberry 2012) to say where in the chain a product sits, and adds earnings-call text and greenfield-fdi announcements to get at intent. The paper’s self-description is “an early assessment,” and Alfaro’s first sentence at the Atlanta Fed was that nobody should be extrapolating 1990s growth rates and calling the difference deglobalization.
The headline fact sits inside a non-fact. World goods and services trade has held at just under 60 percent of world gdp, and the value of U.S. goods imports hit all-time highs in 2022. Underneath, China’s share of U.S. goods imports fell from a 21.6 percent peak in 2017 to 16.5 percent in 2022 (Alfaro added at the conference that it was close to 13 percent by 2023, and that real U.S. imports grew 6.7 percent over 2017–22 and about another 10 percent in 2023). The gainers are Vietnam, up about two percentage points; Mexico; a high-wage Asian group (Korea, Taiwan, Singapore); a group the paper calls low-wage Asia and Alfaro calls middle-income Asia (India, Thailand, Malaysia, Indonesia); and Ireland and Switzerland, which are in the table only because of Covid pharmaceuticals. That is the “great reallocation”: not less trade, different partners.
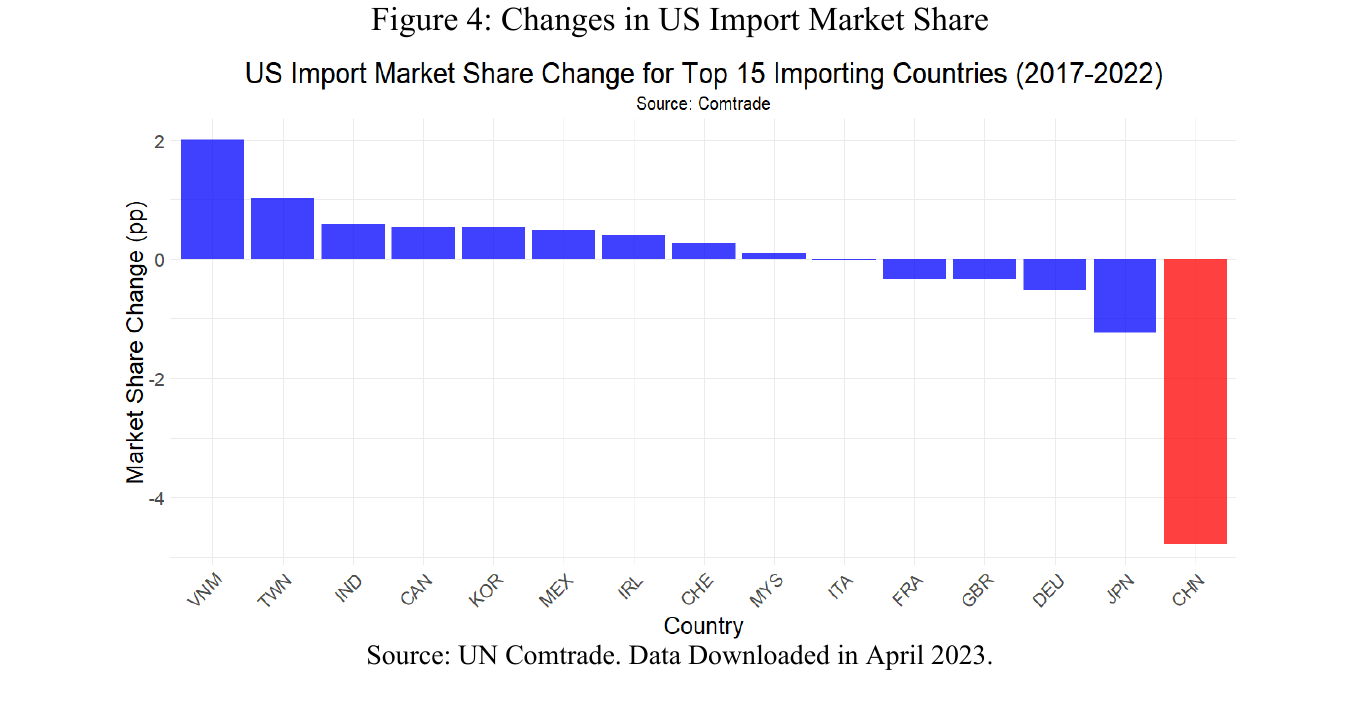
It is worth staring at the ranking before accepting the slogans, because the slogans do not survive it. Vietnam is first, at about two points. Then Taiwan at about one, India at about 0.6, Canada and Korea at about 0.55 — and only then Mexico, at about half a point. Mexico, the country that gave the world “nearshoring,” is sixth, and picked up roughly a quarter of what Vietnam did. The rich, high-tech end of Asia quietly took more of the reallocation than the poster child for cheap-labour friendshoring.
Product by product, not anecdote by anecdote
The analytical core is a single cross-product regression:
where is the 2017–22 change in China’s share of U.S. imports of HS4 product , is an outcome for some other source country (its import share, or later the log unit value of its shipments), the lagged 2012–17 change controls for pre-trends, and are HS2 fixed effects (eq. 2 in the paper). Weights are the 2017 value of imports from China, so the regression is about the products that mattered. It is explicitly descriptive: a five-year difference that bundles the tariffs and Covid together, asking only whether the products where China lost share are the products where someone else gained it.
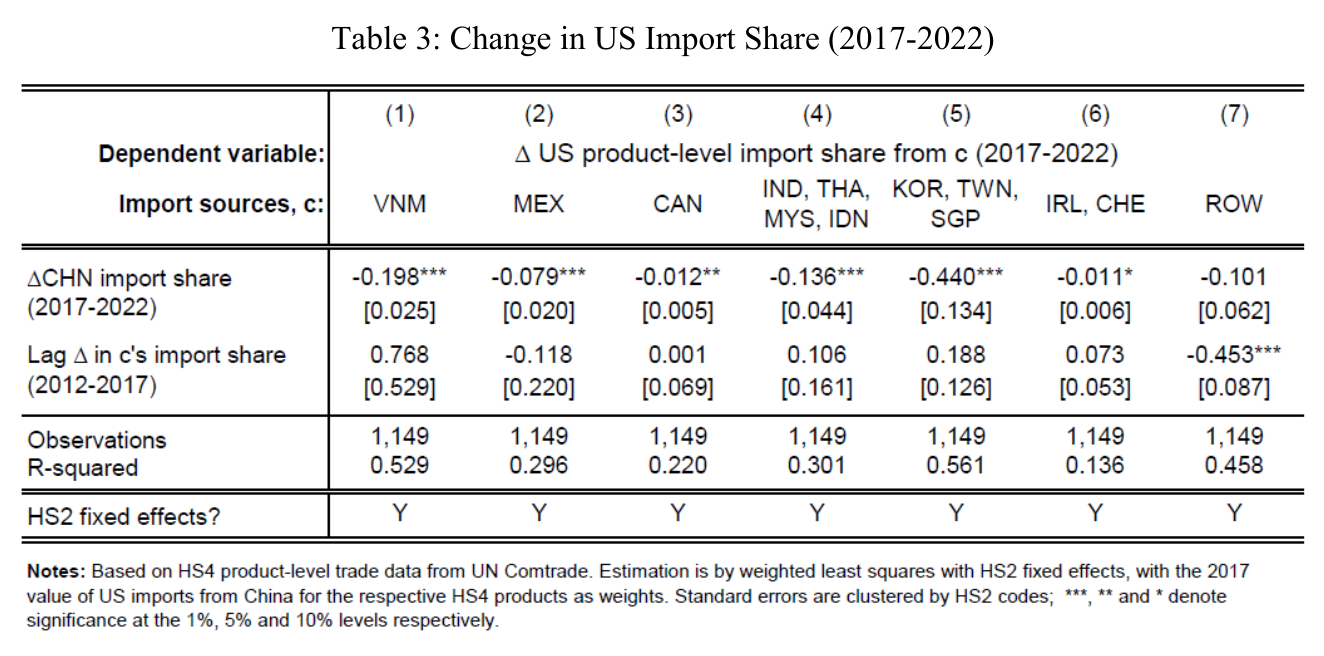
They are. A one-point fall in China’s share of a product is matched by a 0.20-point rise in Vietnam’s and a 0.08-point rise in Mexico’s; the rest-of-world residual is insignificant, so the named groups span the change. But the largest coefficient in the table belongs to nobody’s favourite narrative: Korea, Taiwan and Singapore come in at −0.440, more than twice Vietnam’s −0.198 and five times Mexico’s −0.079. The paper says this in a clause and moves on, which is a shame, because “we moved production to a cheaper place” and “we moved it to Taiwan” are not the same story, and if supply-chain risk is what you were hedging, one of the two answers deserves a second look. Alfaro’s description of the exercise is the right one: take a four-digit product that used to come from China and go looking for it, and you find it in these places and nowhere else.
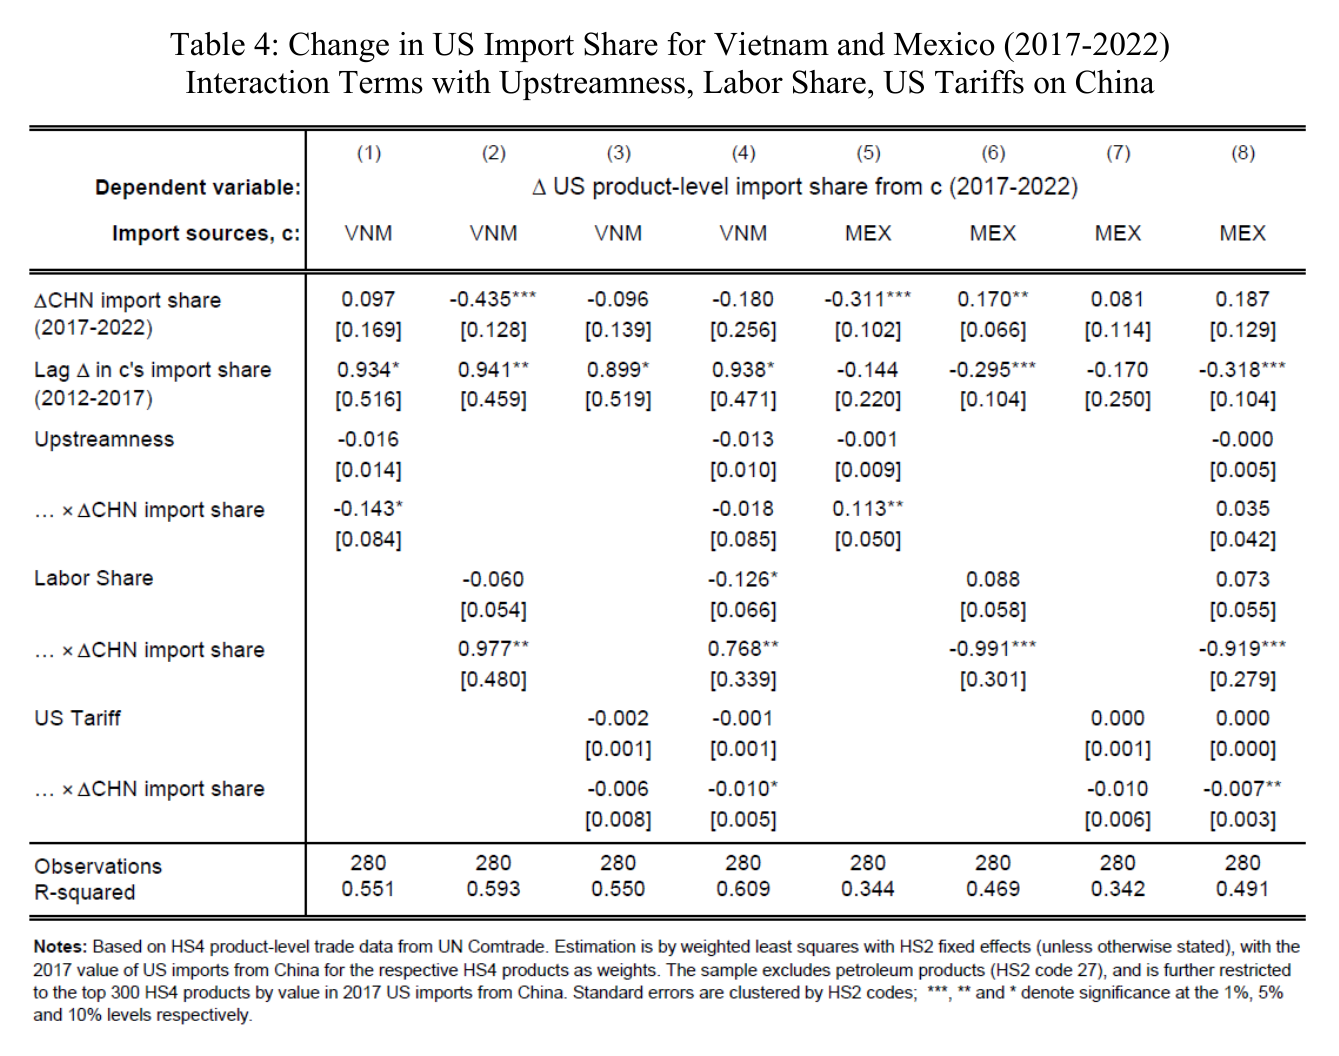
Table 4 then asks which products moved where, and gets a clean mirror image. Vietnam gained most in products that are more upstream and less labor-intensive; Mexico gained in products that are less upstream and more labor-intensive, which is what final assembly next door to the customer looks like. Vietnam shows up in microphones, generating sets, telephone sets, plastic floor coverings and apparel; Mexico in storage media, calculating machines, autos and parts, glass, iron and steel. Alfaro’s telling at the conference was that Vietnam has climbed from textiles and floor coverings into electronics, which is a fair reading of the trajectory but not quite what the table says, since floor coverings and apparel are among the lines where Vietnam’s share was still rising faster than average through 2022 — the old business is growing too. The one thread common to both countries is tariffs: the gain was larger where the U.S. tariff on China was higher. That interaction is significant only in the fully saturated columns; on its own it is not, which is a small crack in the paper’s tidiest sentence. Alfaro’s aside on Mexico was that its relationship with the U.S. is dense at every four-digit line, so dense that the paper had to stay at four digits, because at six digits Vietnam disappears and Mexico does not.
The bill
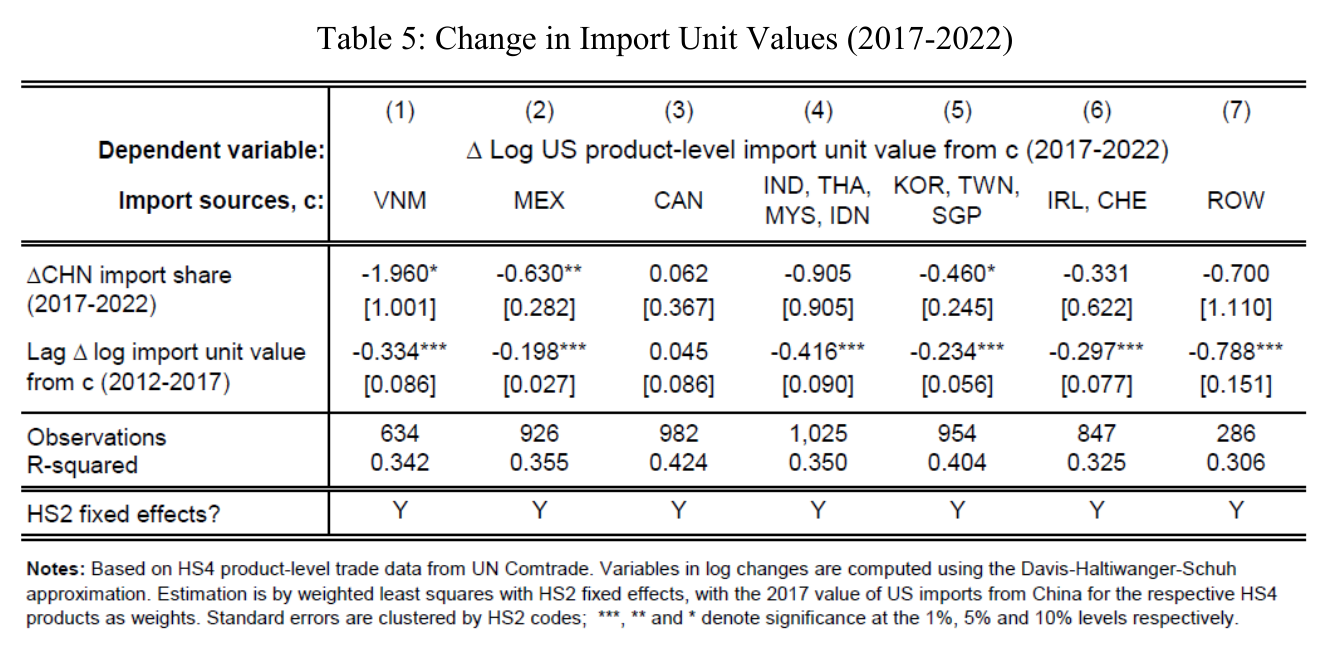
The paper’s first cautionary note is about cost. Running eq. 2 with log unit values on the left gives negative coefficients for Vietnam and Mexico: products where China lost share became dearer from the replacements. Scaled by the trade-weighted 5-point average fall in China’s share, the point estimates imply unit values about 9.8 percent higher from Vietnam and 3.2 percent from Mexico, and 2.3 percent from Korea, Taiwan and Singapore. The famous 9.8 percent deserves a health warning the paper does not shout: the Vietnam coefficient is −1.960 with a standard error of 1.001, significant at ten percent and no better, and it rests on 634 products rather than the 1,149 of Table 3, because a unit value needs a recorded quantity and many lines do not have one. Korea, Taiwan and Singapore are likewise a ten-percent result; only Mexico clears five. The authors are separately careful that unit values are value over quantity and could reflect quality, and that with trade data alone they cannot separate cost-push in the new locations from demand-pull by American buyers who, having already absorbed the tariff, had room to pay more. Alfaro’s conference framing was that the tariffs are known to have been paid by U.S. consumers, and the reallocation is likely to be paid by them too. Di Giovanni pressed on exactly this in his discussion: are the higher unit values factor costs in countries whose wages were already rising, transport costs, or one-off switching costs that will wash out, because the answer decides whether this is a level shift or a standing inflation worry.
The paper does not answer that, but in a Fed conference room both principals were made to. Asked whether the great reallocation produces relative price shifts that are not inflationary because they are one-time cost shifts, Alfaro said the work is about levels, that these are reallocation costs which may show up in the data as inflation because they need not pass through in a single year, and that if they pass over several years they will be counted as inflation — but that inflation, as we all know and as Latin America teaches, is always about printing, so what the paper is picking up is relative changes. She added the wrinkle that the tariffs keep coming and firms may pass costs through in anticipation. Di Giovanni’s answer was the mirror: if these are just one-time costs then they will not feed directly into inflation, in the short run you can imagine price hikes, in the long run it is hard to say, at the end of the day these are supply shocks, and if it is relative price changes it is possible that central banks can fight it, obviously with trade-offs. Which is roughly where a room full of central bankers would want to leave it.
The second caution: where did China go
The other cautionary note is the one the later literature has run with. The policy’s stated aim is to reduce U.S. dependence on China-linked supply chains, and the paper lists three ways the data already say it may not. China’s share of European imports rose 2.7 points to 20.9 percent in 2022 while its U.S. share fell, and the U.S. share of eu imports crept up only 0.4 points to 11.9 percent. Chinese exports to and fdi in Vietnam and Mexico rose over the same years, so the U.S. remains connected to China one step removed: China now supplies about 40 percent of Vietnam’s imports, up from 26 percent in 2010, and 20 percent of Mexico’s, up from 1 percent in 1994, while the U.S. share of Mexico’s imports fell from 69 percent to 44. And the paper’s own upstreamness measure shows Vietnam’s exports to the U.S. moving upstream, consistent with Vietnam assembling inputs that come from somewhere.
The fdi numbers want care, because they are easy to tell backwards. Chinese direct investment in Mexican manufacturing grew fivefold over 2017–22, from 31.6 million to 151.5 million U.S. dollars, and close to three-quarters of that Chinese money went into just two industries, computer and peripheral equipment and motor vehicle parts. But that is three-quarters of China’s own investment, not of Mexico’s inward investment: China’s share of all manufacturing fdi flows into Mexico in 2022 was slightly over one percent, against slightly more than fifty percent for the United States. The fivefold rise is off a very low base. Alfaro’s 2024 update at the conference sharpens rather than contradicts this — in autos and auto parts specifically, she said, 75 percent of all new fdi in Mexico is now Chinese, while in the aggregate it is still overwhelmingly American. She was blunter than the paper about the motive: China always treated Mexico as a competitor and stayed out, and that is changing. She also made two separate claims that are worth keeping separate, since they are often welded together: across the main U.S. trading partners, China’s market share is rising in every one except Japan (which is what the paper’s own appendix table supports); and across the G20, China is the number one or number two source in every single country.
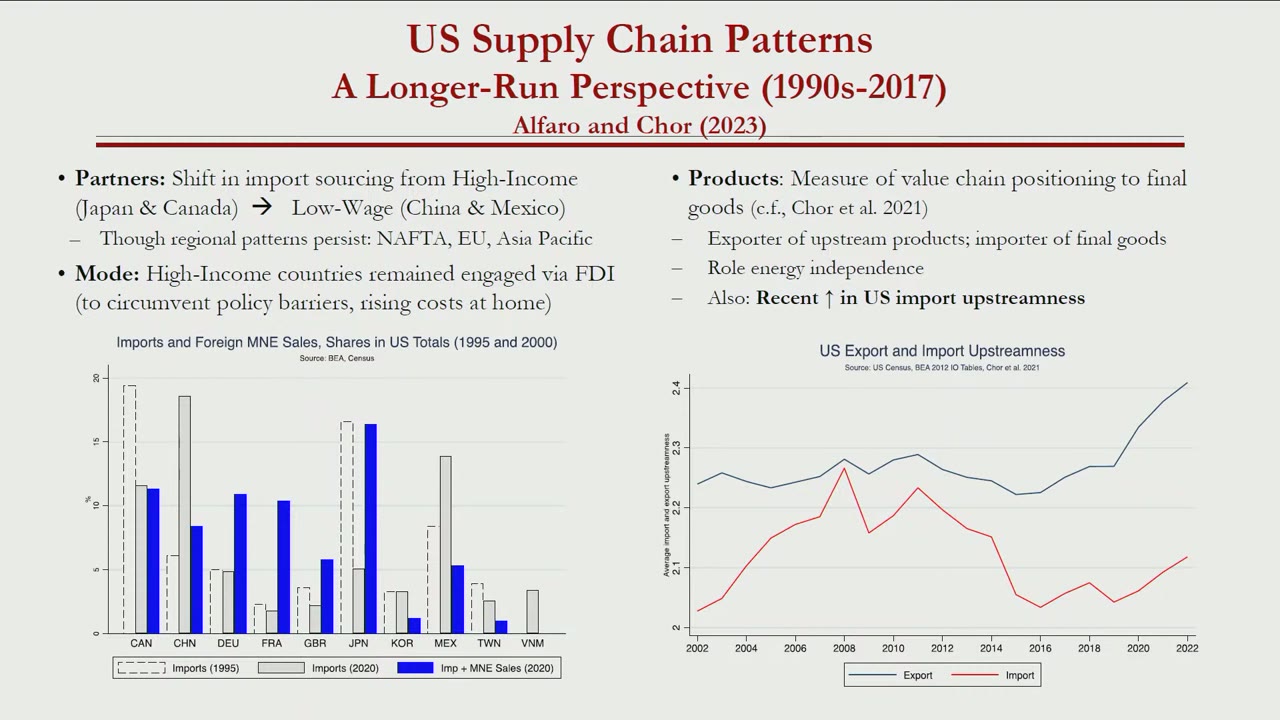
Her historical parallel was Japan in the 1980s, which answered American protectionism by building plants in the United States — Sony in 1971, nec’s first U.S. acquisition in 1978, the “voluntary” auto export restraints that followed. The arithmetic of that is the paper’s best single point. Japan’s share of U.S. goods imports fell from 18 percent in 1994 to 5 percent in 2022, which reads like disengagement; count the sales of Japanese-owned affiliates operating inside the United States and goods of Japanese origin are about 14 percent of the U.S. market. Japan is roughly 15 percent of the stock of U.S. inward fdi, the largest single source, and up to 40 percent of U.S. trade happens inside multinational ownership boundaries. Import shares, in other words, are a lossy way to measure dependence, and China cannot run the Japanese play inside the United States. So it is running it in Mexico and Vietnam.
The paper’s reshoring evidence is deliberately thin: a slight rise in the upstreamness of U.S. imports, which would be what you see if finishing stages moved home, and a bottoming-out of establishment and employment counts in a few subsectors, semiconductors among them. The four policy sectors — autos, auto parts, electronics and semiconductors — were 19.8 percent of manufacturing employment in 2022 against 19.5 percent in 2017, which is not a lot of movement for the money, and autos and auto parts had already been growing in 2012–17, before there were tariffs to explain it. Alfaro’s word for the reshoring evidence was “perhaps.”
What the room pushed on
Di Giovanni’s discussion was a macro-networks view. His first question — how many Vietnams does it take to replace one China — is a way of asking whether a partial-equilibrium reading of U.S. import shares can say anything about resilience when the global production network is as dense as it is; his own model work (with Kalemli-Özcan, Silva and Yıldırım, 2022) on Covid-era transmission is the kind of thing he wants the facts fed into. He also doubted that diversification is what firms are doing: from French data he knows the typical importer has one supplier, and even the ones that look diversified lean on one. Alfaro agreed with the premise and turned it around: the typical importer has one foreign supplier, so it is not the Apple world, and there are not many network externalities to worry about, but there are logistics and who-knows-whom externalities, and the striking thing about the episode is how fast firms switched despite the fixed costs everyone writes down. That speed is the question the companion paper — with Camelia Minoiu, Mariya Brussevich and Andrea Presbitero (2025) — takes up with Panjiva shipment data matched to credit registers, where banks with country specialization lent to the switching firms at lower rates. Di Giovanni’s worry there was selection, that specialized banks cherry-pick good firms; Alfaro’s answer was about timing rather than levels, that financial constraints govern when a firm can switch and not whether, and the tariffs meant firms had to move faster than self-financing allowed.
The moderator’s questions went elsewhere: to the data, to inflation, and to ai. The data one is the most unsettling thing in the hour. An audience member had noticed that U.S.-recorded imports from China run about 130 billion dollars — nearly 25 percent — below China’s own recorded exports to the United States, and that the gap only opened as the tariffs expanded. Are U.S. firms simply under-recording? Alfaro’s answer was that the residual, unclassified “everything else” line in the U.S. trade data has been growing, that many people think some of this is going there, that the paper controls for it a little, and that if it is not classified it is very hard to fix. Which is a striking thing to concede from a podium about a literature built on 21.6 percent falling to 16.5. Services was Alfaro’s own closing thought in her reply to the discussant, not a question put to her: there is an obsession about goods, but the U.S. is a service economy running a services surplus, and the four sectors the paper examines are 20 percent of manufacturing, which is itself 9 percent of U.S. employment. Nearly everyone works in services and perhaps we should think about them. The India remark came later, answering the moderator on ai: at a panel on India, she said, the worry was what ai does to traded services — the data has not picked it up yet, but it is coming.
Where it sits
Between Gopinath et al.’s (2025) gravity evidence that a geopolitical line is appearing in world trade and fdi, and Fajgelbaum et al.’s (2024) elasticity evidence that bystanders on downward-sloping supply curves gained export share in the products the giants taxed, this paper is the one that opens the U.S. import basket and shows what moved where and at what price. It established the vocabulary (the great reallocation, Vietnam as friendshoring and Mexico as nearshoring) and the two cautions that everything written since has had to address: the substitutes cost more, and the thing you were trying to get away from is now your supplier’s supplier.