Notes on:
Living in a Ghost Town: The Geography of Depopulation and Aging
CEPR Discussion Paper 21447; conditionally accepted, Journal of Monetary Economics
18 September 2026
depopulation · population aging · spatial economics · Japan
Talk · Paper · PDF · Transcript
Made with AI: Haiku 4.5 (research), Opus 5 (reading, figures, diagram and writing), GPT 5.6-Sol (reading), Fable 5.1 (adjudication), Sonnet 5 (verification)
Part of Macroeconomic Effects of Population Aging, Fall 2026
When a 25-year-old leaves Kochi for Tokyo, Kochi does not lose one person. It loses her children, who will be born in Tokyo, and their children, who will be born in Tokyo too, unless someone pays a migration cost to undo it. A migration flow today becomes part of the birth distribution tomorrow, and the birth distribution is a stock that compounds. That is the core of the paper by Elisa Giannone, Yuhei Miyauchi, Nuno Paixão, Xinle Pang and Yuta Suzuki. Fertility and survival rates are identical in every prefecture of their model. Japan shrinks to about 15% of its 2015 population over two centuries. Tokyo’s share of it still goes from 10% to 26%. In the model nobody in Tokyo has more babies than anyone in Shimane. There are just more people in Tokyo of the age at which people have babies, and that is enough.
A note on versions. The public paper is the September 2026 draft, in the line of cepr Discussion Paper 21447 and conditionally accepted at the Journal of Monetary Economics. Miyauchi presented it on 18 September 2026 as the last paper of the nber virtual workshop on the macroeconomic effects of population aging. He explained early on that he had “recently … tried to contribute to slowing … population decline in Japan as a Japanese citizen,” and so had to leave early for daycare pickup (05:51:43). That is a nice piece of revealed preference, and it also means there was essentially no Q&A. Where the talk and the paper differ, I use the paper.
What forty years of municipalities show
The paper begins with an accounting exercise on Japan’s municipalities. Sort them by their 1980 elderly share. Between 1980 and 2010 the youngest quartile gained about 0.2 log points of population and the oldest quartile lost nearly 0.3 (Figure 4, p. 10; p. 12). The elderly share went from about 7% to over 20% in the young quartile and from about 16% to over 35% in the old one (p. 13). Divergence, not convergence, and it is accelerating. The decomposition then removes each margin in turn. With internal migration shut off, the oldest quartile would have lost less than 0.1 log points instead of nearly 0.3 (p. 12). With births redistributed according to 1980 birth shares, the gap narrows less, and Miyauchi was candid about why: that result is “a little bit … by construction,” since birth patterns move slowly, but the counterfactual drifts away from the data over time “because the reproductive age population is … moving toward Tokyo” (06:04:20). In the historical data the birth margin looks small. In the projections it does most of the work, and the rest of the paper is about why.
The second set of facts concerns what depopulation does to a place. The identification is a push–pull shift-share. A municipality receives an unexpected inflow of working-age people because the places that historically send it migrants grew, or loses them because the places its residents historically move to became more attractive. The shares are age-specific 1980 bilateral flows, so the instrument moves working-age population and the elderly share separately.
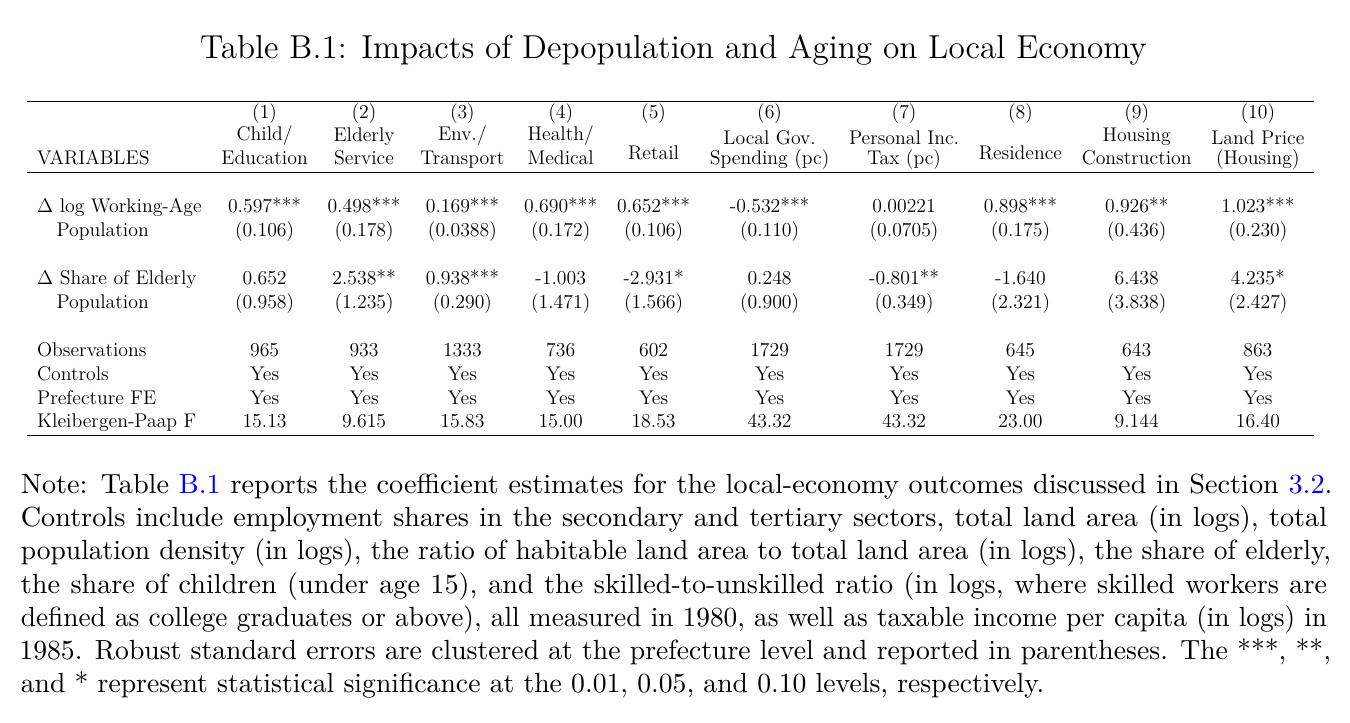
More working-age residents bring more amenities: 0.597 for child and education services, 0.690 for health, 0.652 for retail, with land prices rising roughly one for one (1.023). The column that matters for the model is the sixth. A 1% increase in working-age population lowers municipal spending per capita by 0.53% (−0.532, se 0.110), while personal income tax per capita does not move (0.00221, se 0.0705). Spending per head rises as a place shrinks and revenue per head does not, so, in Miyauchi’s words, “the depopulating areas are running … fiscal deficit” (06:11:14), which in Japan means relying on transfers from the national government (p. 18). The first stages are adequate for the fiscal columns (Kleibergen–Paap F of 43.32) and weak for two others, elderly services (9.615) and housing construction (9.144). The tax variable covers capital as well as labour income, because wages are not published below the prefecture, so the null is a statement about the tax base as a whole. Miyauchi raised that limitation himself (06:10:34).
The model: births happen where the young already are
The model is a dynamic life-cycle spatial general equilibrium model of the Caliendo–Dvorkin–Parro (2019) type. It has 47 prefectures, five-year periods starting in 2015, working life from 15, pensions from 65 and a terminal age group of 70 and over (p. 24). Each period households pick a location to maximise flow utility plus the discounted continuation value, net of a bilateral, age-specific migration cost and a type-I extreme value taste shock. This yields the usual logit migration shares μ (eq. 11, p. 20), with the shock dispersion ν = 0.4. Households are hand-to-mouth, which Miyauchi introduced as “somewhat apologetically” chosen so that location is the only margin (06:14:39). This is a spatial model with a life cycle, not an olg model with a map.
The equation that makes the paper is the demographic accounting identity (eq. 13 in the paper, p. 21):
Here L^n_t(a) is the number of age-a residents of location n, ϰ is the age-specific fertility rate, s the survival rate, and μ^{ℓn} the endogenous share of age-a people moving from ℓ to n. Demographers will recognise the balancing equation. The new part is the first line. Newborns in n are fertility times the reproductive-age people currently in n, and those people are there because of last period’s μ. Miyauchi put it more directly than the paper does: “People move to Tokyo and they’re going to have kids in Tokyo … The kids are going to be stuck there and … they’re going to have kids there” (05:56:06). Fertility behaviour is not endogenised. Only the location of births is.
Two amplifiers sit on top. Productivity and amenities both rise with the local working-age headcount, with elasticities γ^p = 0.1 and γ^a = 0.08 taken from the agglomeration literature rather than from the paper’s own iv (Section 5.1). The dispersion force is housing on fixed land. The third feature is fiscal (eqs. 21–22 in the paper, p. 23):
Per-resident public-service cost g falls with total local population at elasticity γ^g, and a single national labour-tax rate κ_t (not to be confused with the fertility ϰ) pays for those services plus a location-invariant pension T_t for everyone over a* = 65. The implication is that each resident of a small place raises everyone’s tax rate. Nobody chooses a location with that in mind, so it is an externality priced at zero, and it pushes in the same direction as agglomeration. γ^g is set to 0.72. That figure comes from a cross-prefecture regression with initial spending as a control, not from the −0.53 municipal iv (p. 26). The paper chooses the prefecture version to match the model’s spatial unit, which is reasonable, but the elasticity in the model is steeper than the one in the table above.
Calibration inverts productivity, amenities and migration costs from 2015 data, then holds everything fixed apart from 1% annual productivity growth and the official fertility and mortality projections (pp. 25–27). Fertility and survival are common across locations. That choice gives the paper’s headline its force, and it deserves a closer look below.
The loop
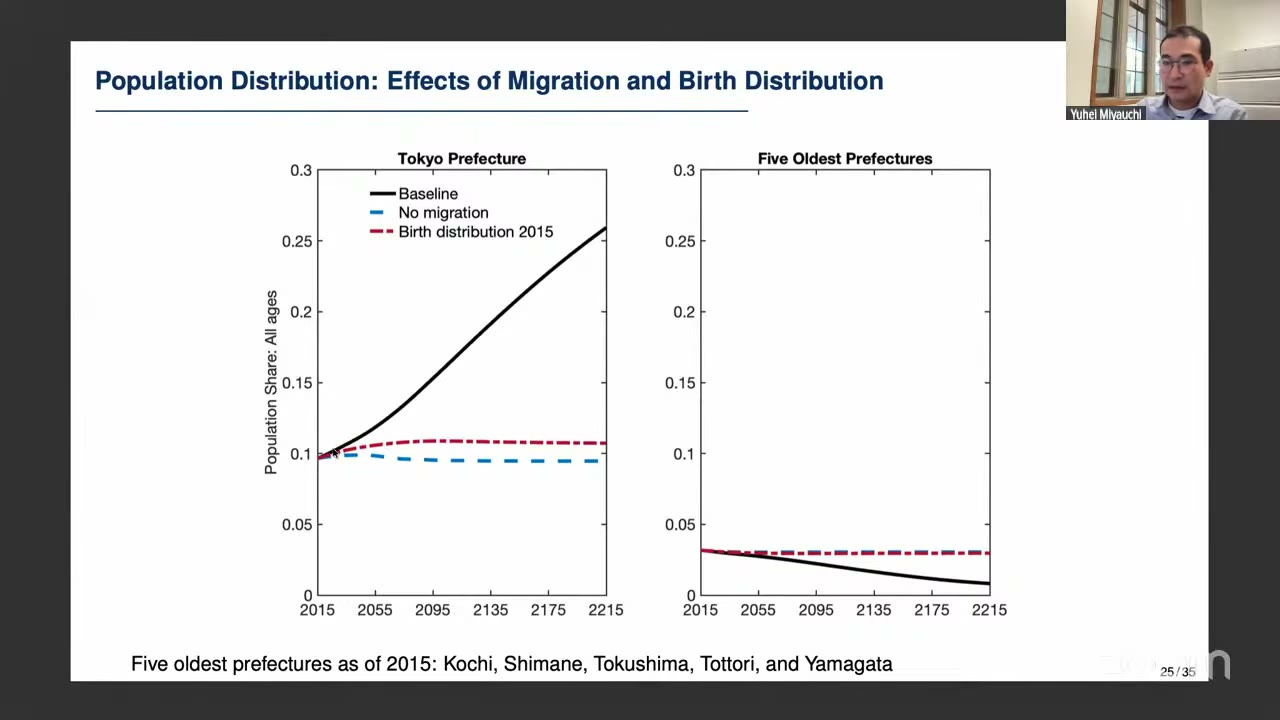
Here is the result. Under the baseline, Tokyo prefecture’s share of the population goes from about 10% in 2015 to roughly 15% by 2100 and about 26% by 2215. The five oldest prefectures fall from about 3% to below 1% (p. 29). The national population falls to under half its 2015 level by 2100 and to about 15% by 2215 (p. 28). Remove either leg of the loop and the divergence nearly stops. With no migration, both shares stay close to 2015 levels. With migration fully active but the spatial distribution of births frozen at 2015, Tokyo’s share “rises only modestly” and the oldest five stay roughly flat (p. 29). That second counterfactual is the striking one. Every migration decision is still made, yet most of the concentration disappears. So the divergence comes less from how many people move than from the fact that the next cohort is born where the movers went. Aging diverges too. Tokyo’s elderly share goes from about 23% to about 34% by 2215, while the oldest five go from about 30% to roughly half by 2100 and nearly 60% by 2215 (p. 29).
Now back to the common-fertility assumption. It is not neutral here. In the data, higher-income prefectures have lower fertility (fn. 12, p. 26), and Tokyo’s is the lowest in Japan. The appendix defends the simplification with a variance decomposition. Across municipalities, the reproductive-age distribution explains nearly all the cross-sectional variation in births. The covariance with local fertility is negative, which the authors note is what you would expect if dense places have below-average fertility, so a national schedule overpredicts births in them (app. B.5). I believe that for the cross-section. A projection, though, compounds a small per-period overprediction in Tokyo over forty five-year periods, and the paper’s headline number is exactly that compounded path. The main text does not show a run with Tokyo’s actual, lower fertility kept in. Tokyo’s real fertility disadvantage works against the loop, and I would like to know by how much.
The ghost town is efficient
The title suggests a tragedy, but the model does not treat the emptying as a loss for the country. Amenity-adjusted real income diverges between Tokyo and the oldest five, mostly for the working-age population. For the elderly the gap is small, since pensions pay the same everywhere (p. 31). The aggregates, though, favour concentration. Under the baseline, labour income per capita reaches slightly more than five times its 2015 level by 2215. With migration shut off or births frozen at 2015 it reaches about 4.6 times, because productive Tokyo holds a smaller share of workers. Fiscal spending per capita reaches nearly 3.3 times its 2015 level in the baseline and about 3.8 times in the counterfactuals, because fewer people live in places where services are expensive per head. By 2215 the counterfactual economies need a labour-tax rate 6 percentage points higher (p. 33). Miyauchi summed it up: concentration in Tokyo “may not be good for equality reasons but it’s good for efficiency reasons” (06:22:03).
Stop the ghost town from forming and you get a poorer country with higher taxes. The concern about Kochi is therefore distributional: the people still living there are worse off, while the country as a whole is better off than if they had stayed. That leads to the policy section.
Paying people to stay
Section 7 takes Japan’s Chiho Sosei regional-revitalisation programme, running since 2014, as its motivation (and Spain’s and Italy’s equivalents) without trying to model any of them literally (pp. 34–35). The experiment gives residents of the five oldest prefectures a transfer equal to some share of their combined labour and pension income. It is funded by a proportional labour tax on Tokyo residents, runs for 100 years from 2015, and outcomes are read off in 2065.
At a 5% transfer, Tokyo’s 2065 population share falls from about 12.5% to 10%, and the oldest five go from 2.5–3% to about 4.5–5%, which roughly doubles them (p. 35). Their elderly share falls from about 45% to roughly one-third. Run the policy in reverse, as a 5% tax on the oldest five, and the elderly share rises to about 80% (pp. 36–37). The asymmetry is the model’s age structure at work. The young respond because their income depends on the local labour market and their horizon is long. The old barely respond because their pension comes regardless of where they live. So a transfer that is formally untargeted works almost entirely on the young, and through them on births.
Real income responds by more than the transfer. Without the policy, the working-age population in the oldest five sits about 0.3 log points below Tokyo. A 5% transfer raises it by about 0.1 log points, which exceeds the transfer because the people who stay bring back some productivity and amenity spillovers (p. 37). The level is still about −0.2, well below Tokyo, so the policy narrows the gap by a third and does not close it. Tokyo’s working-age real income falls by about 0.05 log points. For the elderly, whose baseline gap is only about 0.01 log points, the transfer can put the oldest five above Tokyo.
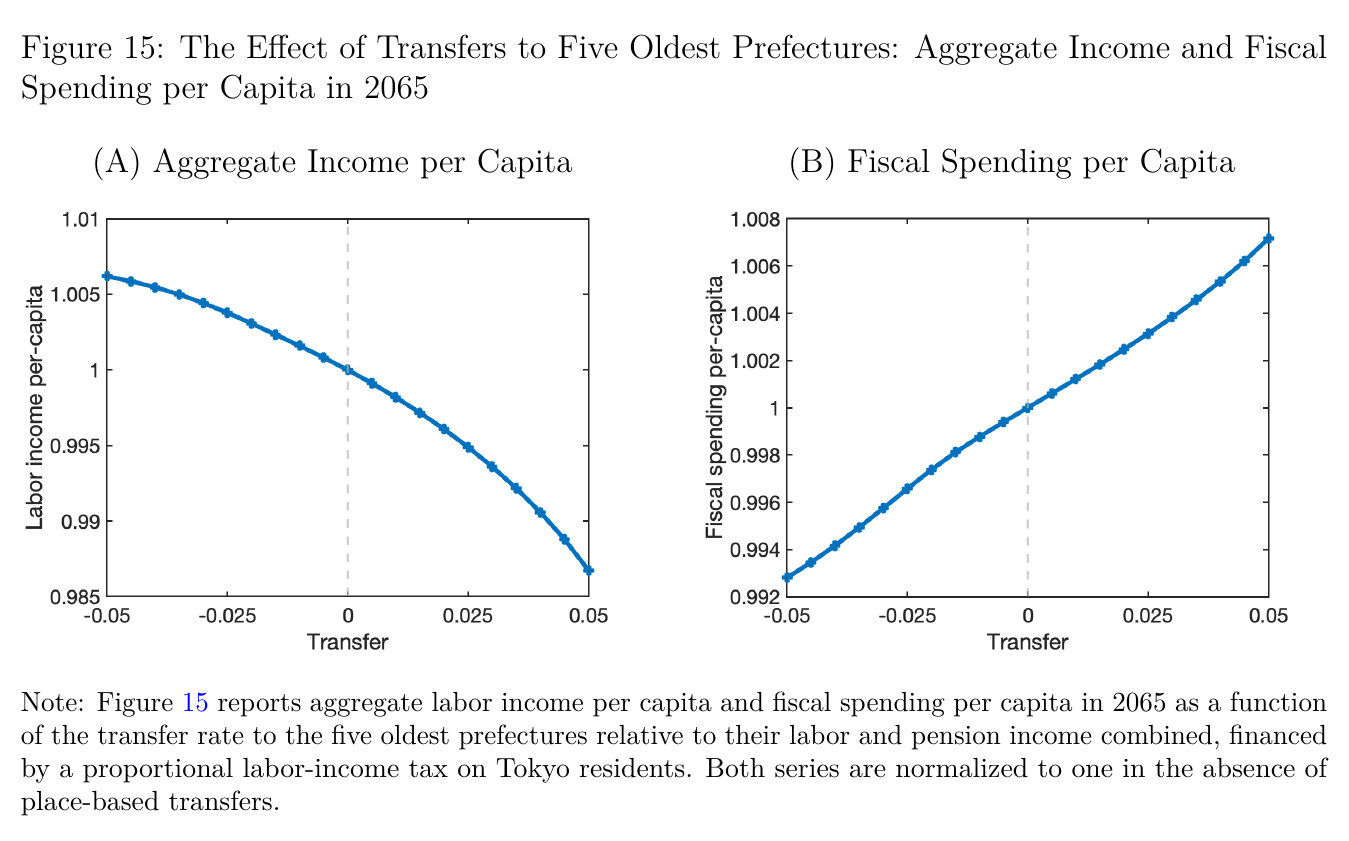
The cost is shown in Figure 15. At a 5% transfer, aggregate labour income per capita is about 1.3% lower and fiscal spending per capita about 0.7% higher (p. 37). The introduction gives different numbers for the same policy: Tokyo income “declines by about 3 percent,” aggregate income falls by “more than 1 percent” and fiscal spending rises by “0.5 percent” (pp. 3–4). The Section 7 text agrees with the figures, and those are the numbers I use. The introduction looks like it was written from an earlier run. The comparison matters because the introduction calls Tokyo’s loss “a much smaller effect due to its larger population base.” At 3% that description fits. At 0.05 log points, Tokyo loses half as much as the oldest five gain, even though Section 7 says the tax needed to fund the transfer is below 5%. My guess, which the paper does not state, is that Tokyo also loses some agglomeration as about 2.5 points of population share move out.
What the room pushed on
Not much, for reasons outside anyone’s control. Once the five-minute mark had passed, the chair told the audience that anyone could jump in (05:57:38). No one did. The one audience contribution to the talk came through the chat. When Miyauchi presented the spending-per-capita result, he credited “a comment by Ron along these lines,” presumably Ronald Lee, whose chat text the captions do not capture (06:10:20). The police-station example is Miyauchi’s: one station serves many people in a dense place, while a sparse place needs several to cover its area. He also mentioned that he had been asked for heterogeneous housing-supply elasticities of the kind the previous paper, by de Silva and Paron (2026), is built on, and said the two forces “reinforce each other” (06:11:44). The September draft includes that exercise in an appendix. With land and labour as complements in housing, population concentrates even more in Tokyo (p. 31). He then asked for questions by email and left (06:25:05).
The discussion that followed happened without him. The chair asked “Tim and James”, presumably de Silva and Paron, whether the two papers were complements. Their answer was that they are “totally complementary and they would totally amplify each other,” because the young do the migrating and the evidence here says the young are also the ones who drive amenity quality (06:26:18). A second voice made the point more specific. Their land mechanism matters in the long run, but “there’s a big chunk of that recent data that’s not explained by our mechanism,” and this paper’s transition dynamics, aging and young people moving, are probably what explains Japan in 2000–2020 and the near future (06:27:00). That is a gracious concession and probably an accurate one. The land channel works through the population level. The birth-location channel works through the age composition of whoever is moving, and that is what has been changing over the last two decades.
The closing roundtable touched this paper once. One participant counted four or five papers that day finding that slower population growth raises per-capita income (06:27:41). Another accepted the direction but not elasticities above one (06:28:35). Then the participant later addressed as “Ron”, again presumably Lee, cited Samuelson (1958): per-capita income is a poor welfare measure when societies arrange consumption across the life cycle differently (06:29:00). This paper has an unusually good answer to that criticism, although no one gave it. Fertility and survival are common across places, so the baseline and both counterfactuals share the same national population and age path (p. 28). The 5× versus 4.6× comparison therefore holds the age structure fixed and changes only where people live. Its gains are modest (roughly 9% of per-capita labour income after two centuries), well short of the magnitudes that worried the roundtable, and its distributional measure is amenity-adjusted flow utility by age and place, not a national average.
The upshot
The paper’s conclusion is uncomfortable. Depopulation does not spread evenly. Emptying places compound their losses through births, and the resulting concentration is, on the model’s own accounting, good for aggregate income and for the national budget. Stopping it costs efficiency. The transfer that stops it works almost entirely through the young, and some of its cost falls on Tokyo. Miyauchi’s last substantive point was about politics. Even if letting the periphery empty were right, it is “hard for the government to commit to a policy to kill these depopulated regions” (06:24:09). A 25-year-old in Kochi who expects a rescue package has good reason to wait for one, and in this model a delayed move out of Kochi also delays that person’s children. So a government that cannot commit to letting towns die slows the process by being expected to prevent it. Given the fiscal term above, it also raises everyone’s tax rate while it does so.