Notes on:
The Impact of Third-Party Reporting on Tax Compliance: Evidence from Gig Workers
Journal of Public Economics 260 (2026), 105697
18 September 2026
tax compliance · gig economy · third-party reporting · public finance
Talk · Paper · doi · PDF · Transcript
Made with AI: Opus 5 (reading and writing), GPT 5.6-Sol (reading), Fable 5.1 (adjudication), Sonnet 5 (verification)
Part of Innovations in Measuring Employment, Fall 2026
You are a company that pays people who are not your employees. The rule governing you is old and simple: pay someone $600 or more in a year for non-employee work and you tell the irs, on what used to be Box 7 of a Form 1099-misc and since 2020 has been a Form 1099-nec. Nothing is withheld — that is the worker’s problem — but the irs gets a number and the worker gets a copy, and across a long literature the number on the copy turns out to be most of what makes self-employment income appear on a tax return at all.
Then in 2008 Congress decided the net was too narrow. Small businesses were taking card payments that nobody reported to anyone, so the Housing Assistance Act created Form 1099-K, effective 2011, obliging payment-card processors and “third-party settlement entities” — PayPal and its kind — to report what they settled. Because the drafters were thinking about credit-card acquirers rather than about workers, they set the threshold at $20,000 and 200 transactions.
Now read that paragraph as a platform’s tax counsel. You are not paying a driver for services rendered to you; you are settling the passenger’s payment to the driver. That makes you a third-party settlement entity. Your form is the 1099-K, and your threshold is not $600 but $20,000. Several of the largest peer-to-peer platforms took exactly this view. For a while nothing visible happened, because through 2016 they filed 1099-Ks on everyone regardless of amount — the 2016 distribution has no break at $20,000 at all, which Koustas reads as platforms experimenting with the K while not wanting to “run afoul of any types of requirements on reporting.” From 2017 they stopped hedging, and by 2018 essentially no platform reported anything below $20,000. A statute written to widen third-party reporting had, through nobody’s stated intention, raised a driver’s effective reporting threshold from $600 to $20,000. Garin, Jackson, Koustas and Miller call the resulting hole the 1099-K gap, and their paper on it — the one piece of clean causal identification at this conference, now out in the Journal of Public Economics — is about what happens to a worker when the form stops arriving.
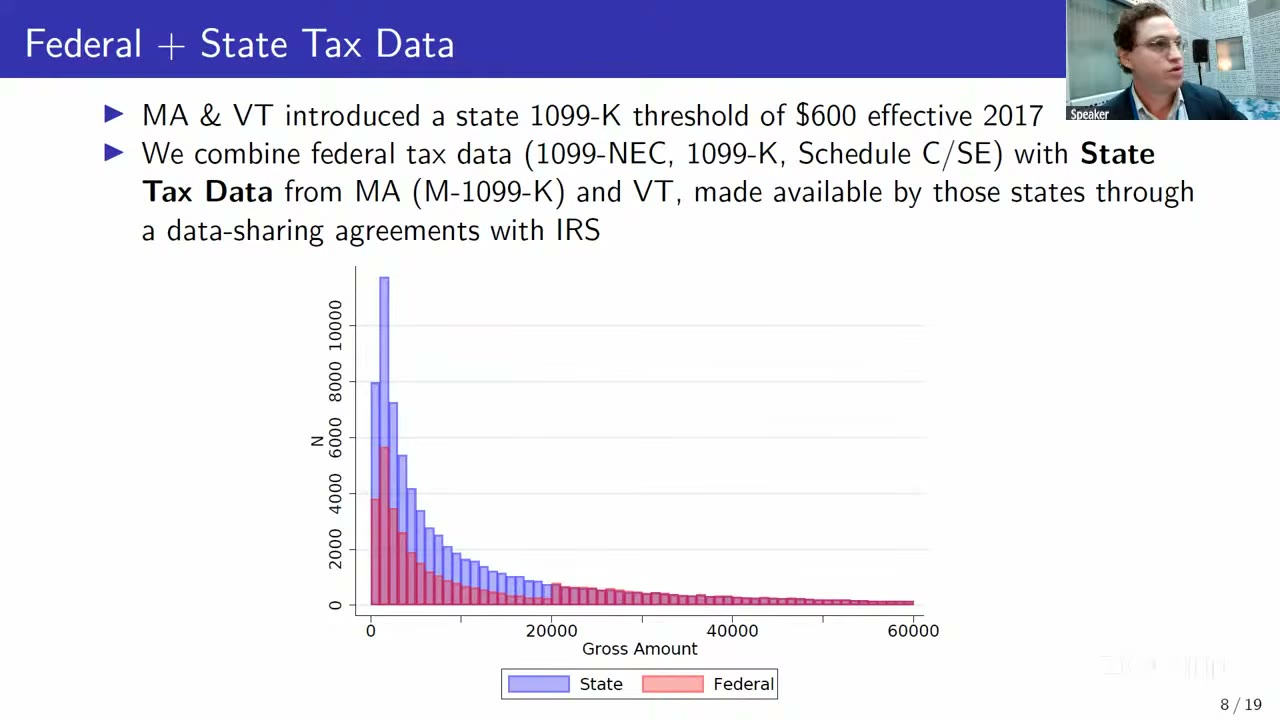
The state that plugged its own hole in the year the federal one opened. Massachusetts and Vermont, alert to the threshold mismatch, imposed their own 1099-K requirement at $600 with no transaction minimum, effective 1 January 2017. Through a data-sharing agreement at the irs the authors obtained those states’ 2017 and 2018 filings and linked them by tin to the federal universe. The picture that comes back is the missing mass, recovered: platforms complied with the state law in two different ways, some by issuing a federal 1099-K to residents of those states and some by filing only a state return, so you need both files stacked on top of each other to see a distribution with no hole in it.
The design. Incumbent platform workers on the Massachusetts side of the line are compared with workers just across it in Connecticut, New York, New Hampshire and Rhode Island. Massachusetts counties are inconveniently large — Worcester runs the full height of the state — so county-pair matching alone would be too coarse, and the sample is cut further to zip codes whose centroid sits within 15 miles of the border. Everyone in it was a platform gig worker in 2016 with under $20,000 on a federal 1099-K, followed in a balanced 2014–2018 panel: 10,363 individuals across 22 counties, treatment assigned by 2016 residence and held fixed. Vermont is left out of the baseline because too little platform work sits near its border; adding it changes nothing. The specification is equation (1) of the paper,
where is the outcome for individual in tax year , are individual fixed effects and are county-border-pair × year effects, so that every comparison runs within a pair of adjoining counties that straddle the line; standard errors are clustered on the individual. The design sees incumbents only — it cannot see anyone who entered gig work after 2016, because on the control side there would be no record of them to see.
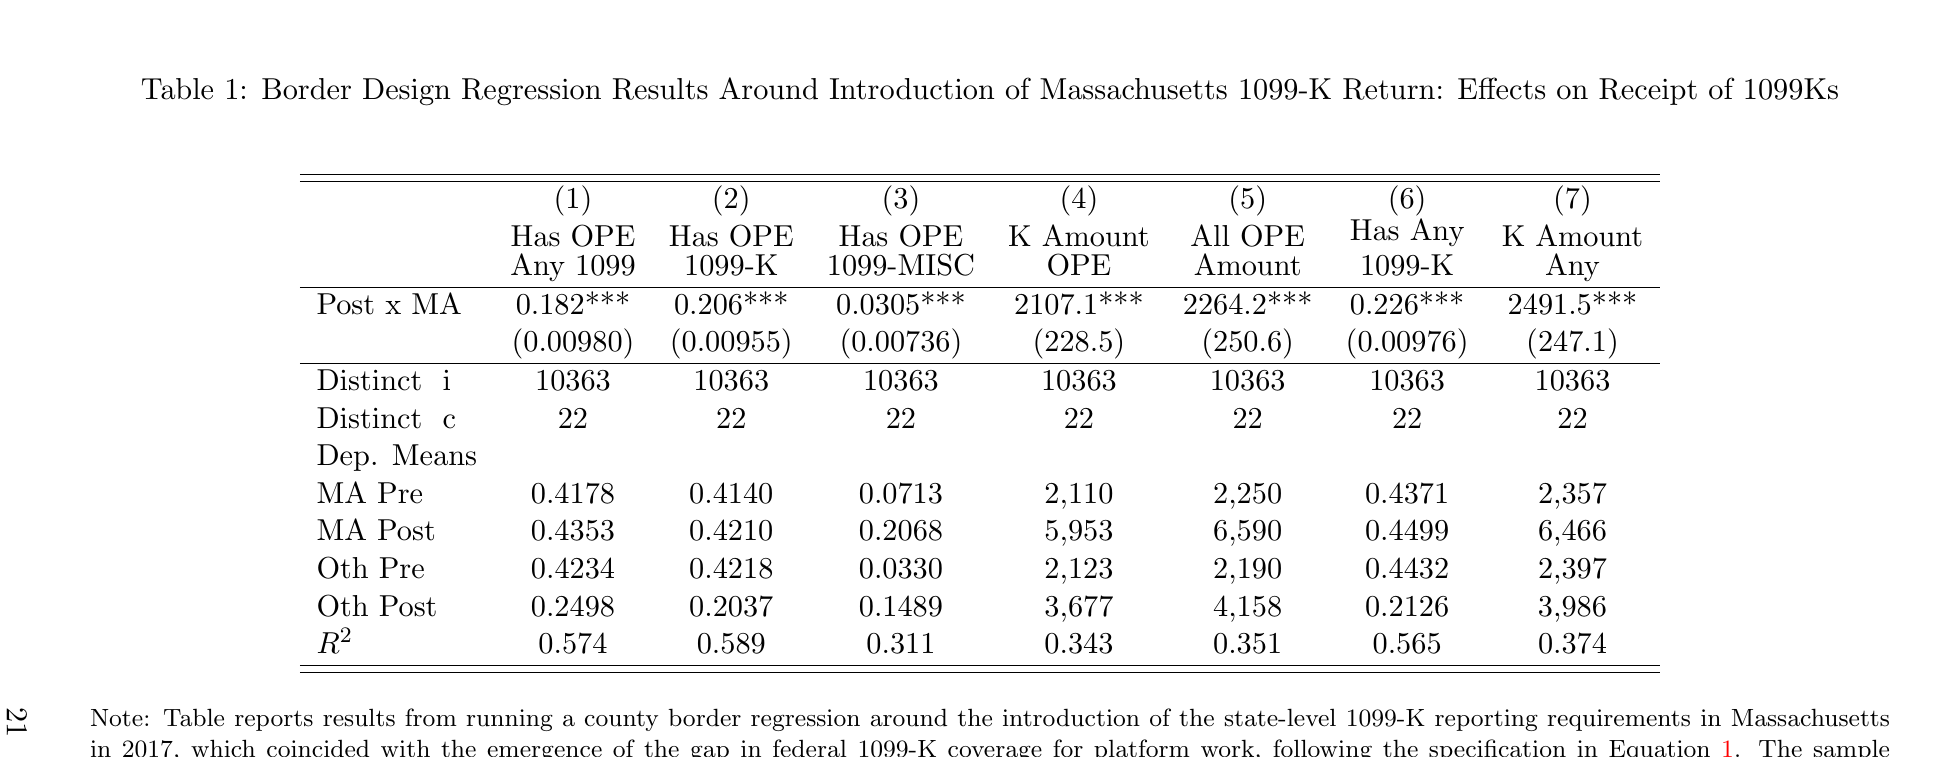
The first stage is a collapse, not a rise. Post × ma raises the probability of receiving any platform 1099 by 18.2 points and of receiving a platform 1099-K by 20.6 points, and adds about $2,264 of reported gross. But the means are the better story: on the Massachusetts side the probability of getting a platform 1099-K goes 0.414 to 0.421, which is to say it does nothing, while on the control side it goes 0.422 to 0.204. Nothing was done to Massachusetts. Something was done to everyone else.
What a dollar on the form is worth. Scaling the reduced form by that first stage gives the pass-through the paper is built on. Each additional dollar reported on a 1099-K raises Schedule C receipts by 27.8 cents (s.e. 0.141) and expenses by an insignificant 8.6 cents, leaving 16.9 cents (0.0513) of additional reported profit; Schedule se earnings rise 13.2 cents (0.0493), and 12.3 percentage points more of them file a Schedule se at all (s.e. 0.0366). Placebo W-2 wages move −$0.101 (0.163), which is to say not at all.
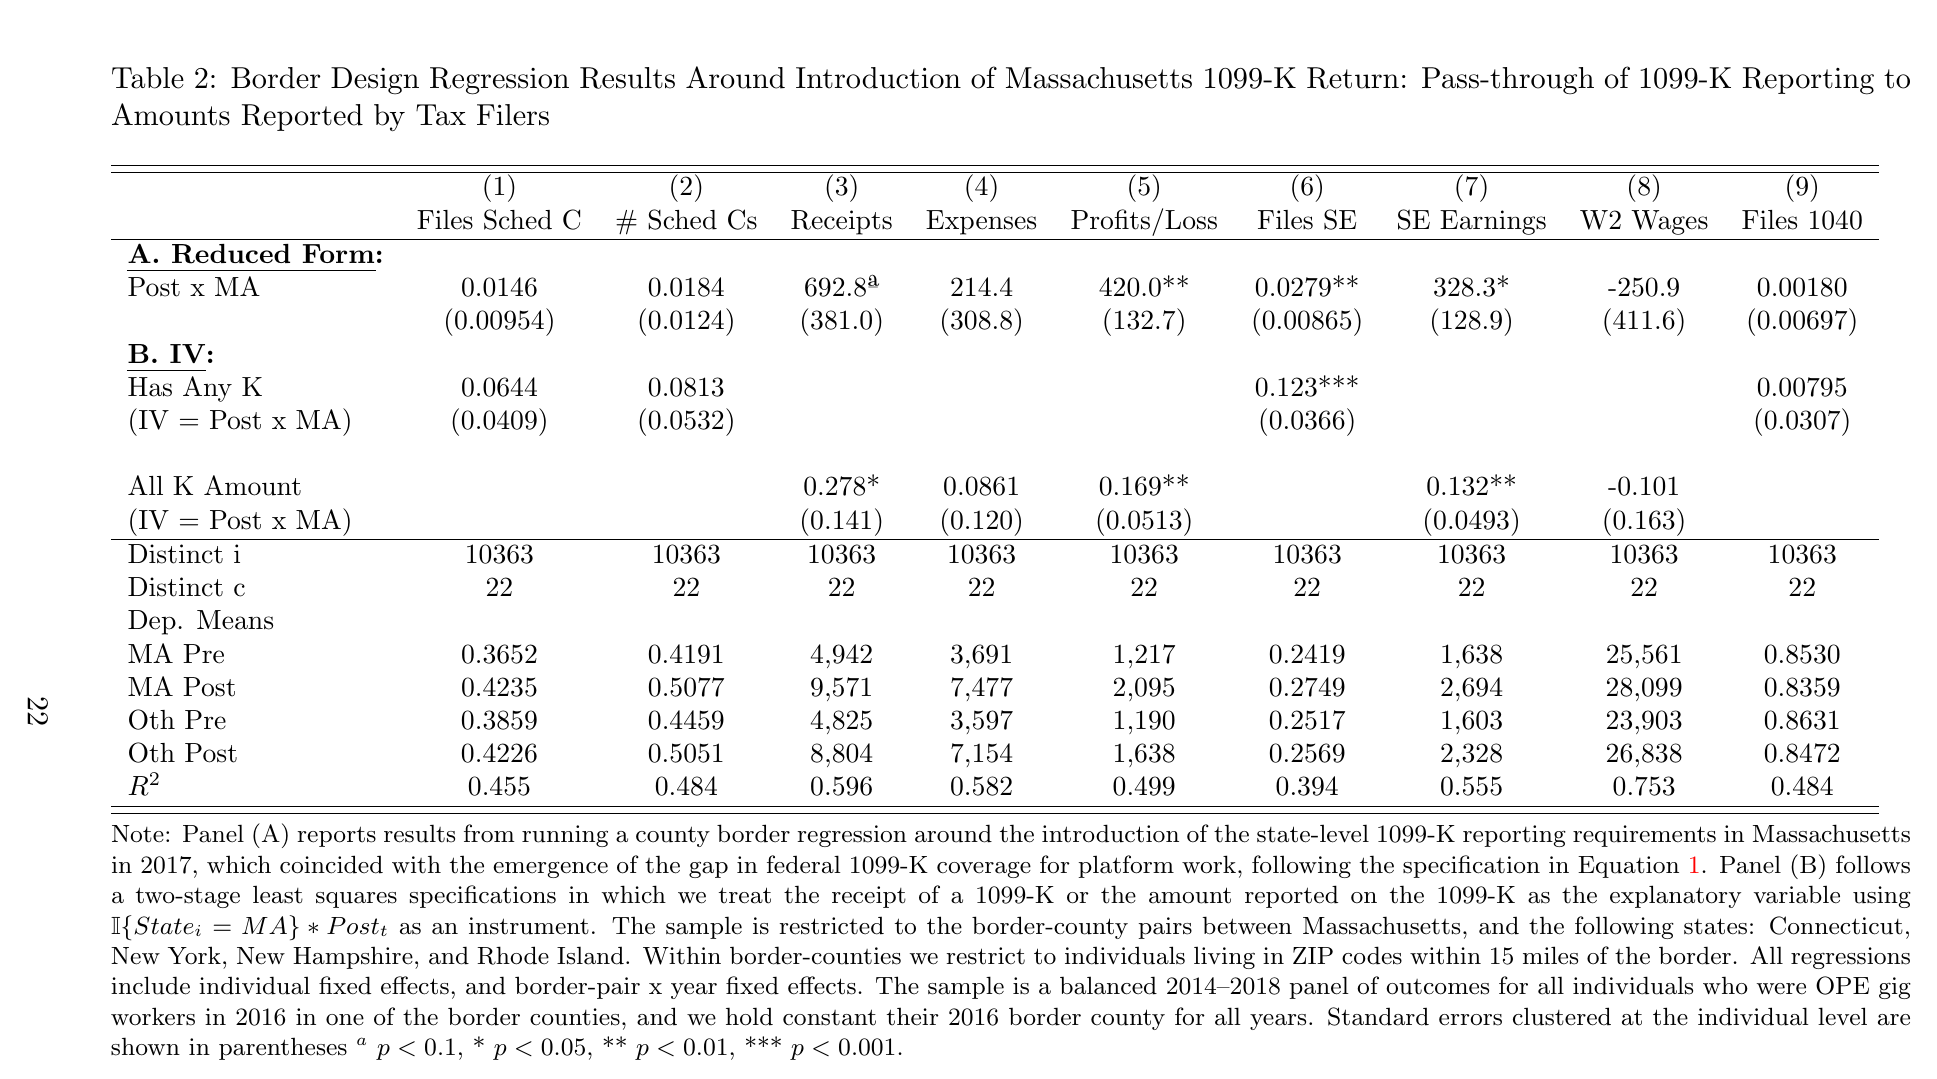
Note what does not move. The effect on whether anyone files a Schedule C at all is 0.0644 with a standard error of 0.0409: a positive point estimate the speaker fairly described as “noisy,” and not a result. Filing a Schedule se moves instead, and mechanically so — Schedule se is required once Schedule C profits clear $433, so pushing profits up pushes people over a notch they were already sitting near. Everything the form buys is on the intensive margin. It changes the number on a return that was going to be filed anyway; it does not turn a non-filer into a filer. The heterogeneity says the same thing from the other side: pass-through is largest among prior Schedule C filers and higher-agi filers, the people with the highest baseline propensity to file. And 17 cents on the dollar is a long way from a dollar, for two reasons the authors offer without choosing between them — incumbents had learned their obligations and kept reporting without the prompt, and a large share never report regardless, since Collins et al. (2019) find 43 percent of people with 1099-reported platform earnings already failed to put them on a Schedule C in 2016, before the hole opened.
The interesting part is which mechanism is doing the work. The Massachusetts 1099-K was a state information return, and the paper is explicit that the information the states collected “was not initially shared with the federal irs.” It carried no federal audit threat whatsoever. And yet it moved federal Schedule C profits by 17 cents on the dollar and pushed 12.3 points more people onto a federal Schedule se. That is not deterrence, because there was nothing to deter with. It is salience and record-keeping: the number that arrives in the mail is the number that gets copied onto the form, and a worker who receives no statement of gross receipts is a worker keeping his own books. The design cannot separate “shading the number a little” from “having no number to shade,” and Susan Houseman, discussing, named both readings and did not pick either.
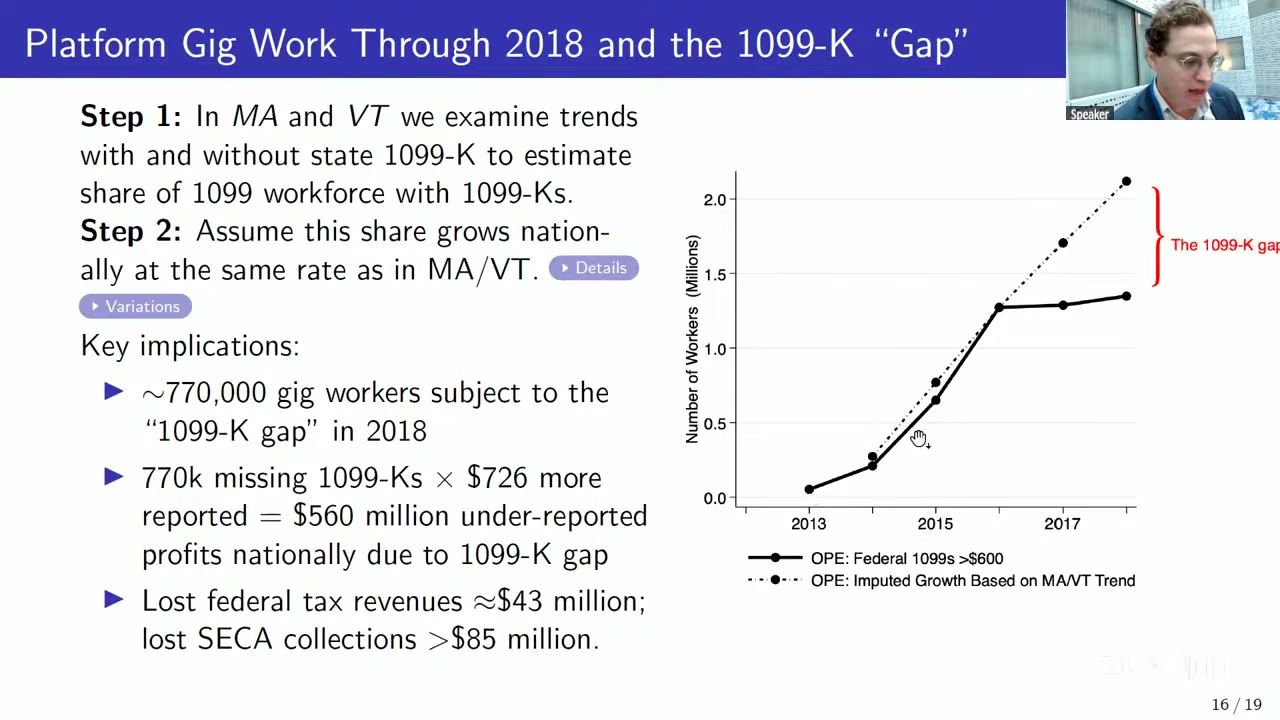
Then the arithmetic. If the share of the tax workforce with platform 1099 income would have grown nationally at the rate it grew in Massachusetts and Vermont — the assumption doing all the work, and the authors say so — then 770,000 platform workers are missing from federal 1099 data in 2018, nearly a third of an imputed workforce above two million, against a raw federal count that appears to plateau around 1.35 million. Multiply 770,000 by the mean sub-$20,000 gross amount in 2016 of $4,270, and that by the 0.17 pass-through, and you get $726 per missing return and $560 million of national profit that went unreported. The tax consequences are smaller than that sounds, because, as Koustas put it on stage, “many of these people don’t have high federal tax liability”: at an assumed 7.7 percent average rate, typical of second-quartile earnings, $43 million of income tax, and at the 15.3 percent seca rate, more than $85 million. The self-employment tax is where the money is, which follows directly from the Schedule se result.
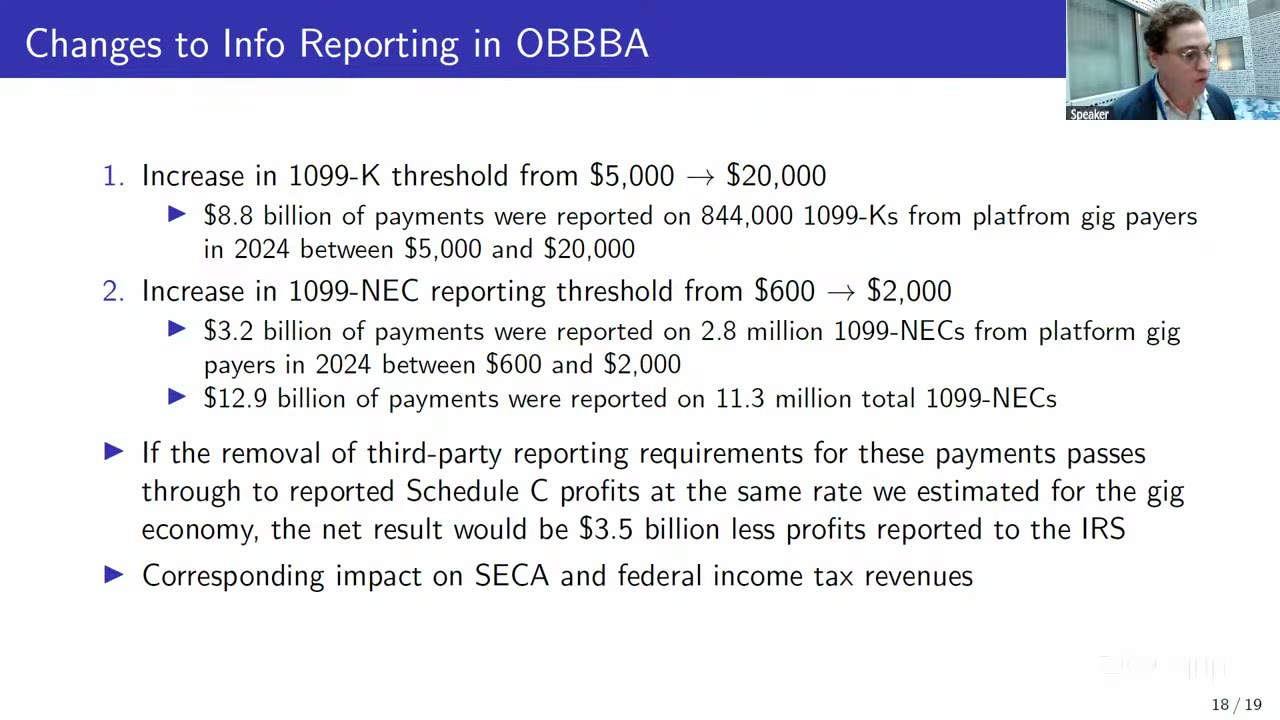
And then the extrapolation, which is where the talk and the paper part company. The One Big Beautiful Bill Act reverted the federal 1099-K threshold from the one-year $5,000 of tax year 2024 back to $20,000, and raised the 1099-nec threshold from $600 to $2,000 from tax year 2026, indexed thereafter. The paper projects one of these. In 2023 and 2024 about $13 billion of payments sat on 1099-necs between $600 and $2,000, and if the removal of reporting passes through at the estimated rate, the paper says, “the net result would be $2 billion less profits reported to the irs and a larger corresponding impact on seca and federal income tax revenues.” That is the published number: $2 billion a year from the nec change alone. The 1099-K reversion is not projected at all.
The talk projected both. Slide 18 adds the $8.8 billion on 844,000 platform 1099-Ks in the now-unreported $5,000–$20,000 band to the nec band and gives $3.5 billion; the conclusion slide totals the affected forms at 12.2 million. This is the speaker’s own extension rather than a result of the paper, and worth flagging as such, partly because the slide’s own inputs do not quite reproduce it — $12.9 billion plus $8.8 billion at 0.17 comes to about $3.7 billion — and partly because the spoken tax figures that followed drifted further (the “$350 million” of income tax implies roughly a 10 percent rate rather than the paper’s 7.7). None of that is a scandal; it is a live talk running long against a chair who was already behind, and the paper’s own number is the careful one. Two hedges survive in both versions, and both are the authors’: these are returns, not people, so “it’s a bit of an upper bound” if anyone receives several; and footnote 20 argues the pass-through for the broader 1099-nec population should be larger than 0.17, since platform workers are drivers who expense much of their gross and other freelancers face higher marginal rates — which makes both projections lower bounds by the authors’ own logic.
The discussion. Houseman called the evidence “really convincing, causal evidence” and then said the thing discussants say when they mean it: “I think the causal effects are clear. Interpretation’s a little less so.” Her push was on the null. Why does receiving a form not make anyone file a Schedule C? She laid out four candidates without ranking them — the controls are incumbents habituated to filing who keep filing after the form stops; the treated know a state return will not reach the federal government and so ignore it; the sample is too small; or nobody was ever going to respond, because some people comply and others don’t and a piece of paper won’t change that. Her concrete ask was the distribution of Schedule C filing among 1099 recipients by revenue level, on the prior that non-filing is concentrated among low earners — which, if right, would say the extensive margin is dead precisely where the 1099-K gap lives. She also warned that on the simulations “we should be very careful,” urged the authors to be explicit about what has to hold when they project, and guessed, independently and correctly by the authors’ own footnote, that the projections understate the recent changes.
Nobody answered. The chair, running behind, gave each team thirty seconds instead of floor questions, and the thirty seconds went elsewhere: Martha Stinson noting that Census is linking the 1099-K this summer and that she had not known the nec and the K are sometimes issued by the same company, and Andrew Garin making an infrastructure argument — that what he, Koustas and Jackson have been doing at the irs “is not a kind of sustainable research infrastructure,” so the Census effort has to work, and it should reconcile against the published soi cross-tabs because “it should be the same universe.” Houseman’s closing question, addressed to the whole conference rather than to this paper, was whether the private third-party payer data everyone had spent two days discussing for W-2 employment could be turned on 1099s, and whether payment processors could size “the 1099-K workforce, which is a big question mark.”
The coda is the conference’s own subject. The series recovers after 2018, and it recovers for the wrong reason: delivery platforms report on the 1099-nec, so the nec line climbs as the K line falls, Covid does what Covid did to delivery, and the latest count is over 5.5 million platform gig workers. The number went up because the paperwork moved, which is exactly the thing this conference has spent two days worrying about. Koustas’s practical advice, offered from the podium to a room of people who build statistics out of tax records, is that if you want two comparable years, use something before 2017 and use 2024 — the single year the federal 1099-K threshold was low enough to see anything. Beginning in 2026 the nec threshold is indexed for inflation, so the hole will now widen quietly on its own, every year, with no one having to decide anything.