Notes on:
Friendly Fire: The Trade Impact of the Russia Sanctions and Counter-Sanctions
Economic Policy
2020
geoeconomics · sanctions · Russia · trade finance
Made with AI: Fable 5.1 (reading and writing)
Matthieu Crozet and Julian Hinz (Lingnan University, Hong Kong; European University Institute and Kiel Institute for the World Economy, as the paper lists them). Economic Policy 35(101), 2020, pp. 97–146, presented at the 68th Economic Policy Panel in October 2018. This is the published version, with the discussions by Alberto Martin (ecb, crei and Barcelona gse) and Robert Stehrer (wiiw) and the panel discussion. No talk recording could be found; pdf-only digest. Figures and tables are cropped from the published version.
The 2014 round, priced
After Crimea, 37 countries — the eu, the United States, Japan and others, about 55 percent of world gdp — sanctioned Russia in waves from March 2014: travel bans and asset freezes first, then at the end of July financial sanctions cutting five major Russian banks and named defence and energy firms off from Western capital markets. Russia answered on 7 August with an embargo on Western food and agricultural products. Crozet and Hinz ask what all this did to trade, and for whom, and their answer has a shape that has since become familiar: the target lost more than the sanctioners, the sanctioners’ losses were real but small relative to their exports, and most of those losses had nothing to do with the products anyone had actually banned.
Counting lost trade
The macro exercise is structural gravity on monthly Comtrade data for 2012–2015 across Russia, the 37 sanctioning countries and the 40 other largest exporters, estimated by Poisson pseudo-maximum likelihood as eq. (2) in the paper:
Here and are exporter-by-month and importer-by-month fixed effects that soak up each country’s supply and demand — including the oil-price collapse and the rouble crisis, which show up as Russia’s import demand falling for everyone — and is a pair-by-calendar-month effect for seasonal bilateral frictions. The trick is that the model is estimated only on untreated pairs, so the sanctions never get a functional form: the counterfactual for a sanctioner-to-Russia flow is simply the pre-crisis bilateral friction carried forward, with multilateral resistance terms and factory-gate prices re-solved along the lines of Anderson, Larch and Yotov (2018). Lost trade is predicted minus observed, December 2013 to December 2015.
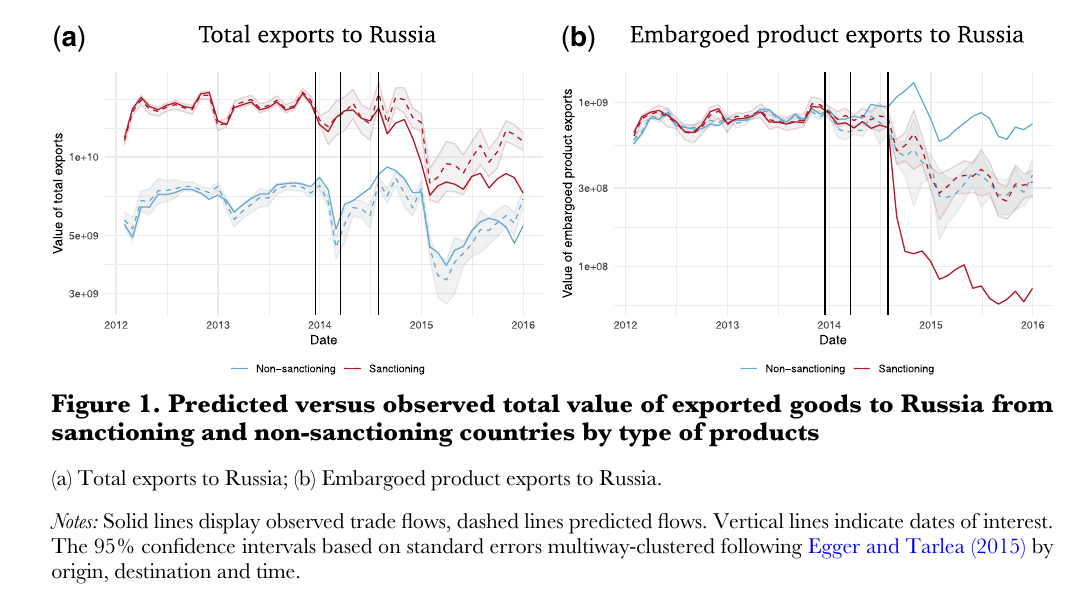
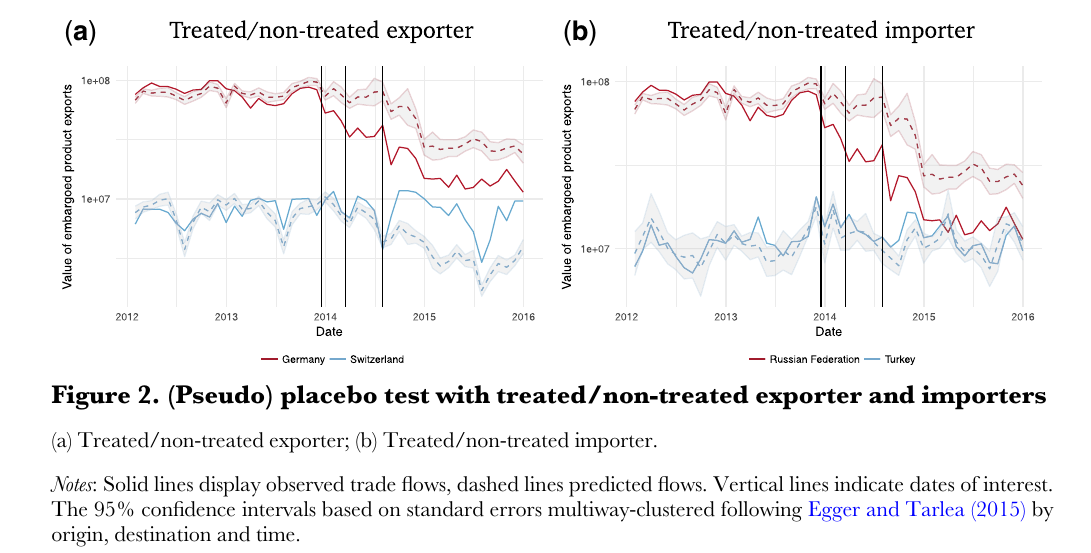
The fit before December 2013 is close, and the importer-time effects do what they should: the drop in imports from non-sanctioners in early 2015 is matched almost exactly by the predicted drop. After August 2014 the sanctioners’ exports fall well below prediction while non-sanctioners’ do not, and in embargoed products the non-sanctioners actually rise above theirs. The placebos hold up too.
The totals are in Table 1.
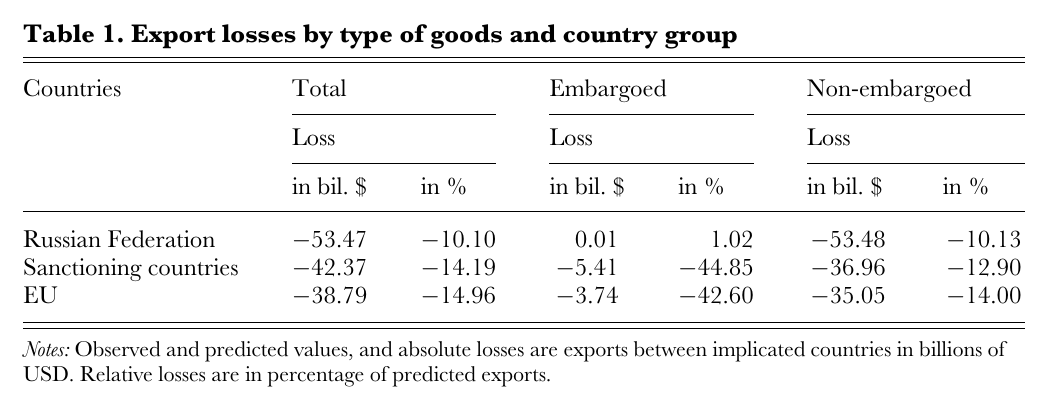
Ninety-six billion dollars of trade went missing over two years, about four billion a month. Russia bore 53 billion of it, 56 percent. The West bore 42 billion. Which side was hit harder depends on the denominator, and both framings are true. Against total exports, Russia lost 7.4 percent and the West 0.3 percent; against the predicted trade between the two blocs, Table 1 has the West losing more, 14.2 percent of its exports to Russia against Russia’s 10.1 percent of its exports to the West. (The paper’s own text, on p. 111, says Russia’s loss is 15 percent of its predicted exports, and Martin repeats the figure; neither the table nor the summary supports it, so the table’s number is the one used here.) Of the Western loss, 92 percent fell on the eu, and Germany alone took 38 percent, about 667 million a month; the United Kingdom took 8.7 percent, France 6.6 and the United States 0.3. The number that gives the paper its title: only 5.4 billion of the Western loss, 12.7 percent, was in the products Russia had embargoed. The other 87 percent was in goods nobody had banned — and since embargoed goods presumably suffered whatever hit the unbanned ones too, the authors call 87 percent a lower bound. China and other non-sanctioners picked up the embargoed products (Armenia’s exports of them rose 82 percent above prediction) but there was essentially no diversion in everything else.
Why the unbanned goods stopped moving
The micro half tries to say what that 87 percent was, and the authors are careful to say they “cannot and do not affirm” that it is directly and solely the sanctions. The candidates are a consumer boycott of Western goods (the Russian government ran a media campaign around the embargo, organizing among other things the public destruction of illegally imported food) and a rise in the perceived risk of doing business with Russia that made trade finance expensive or unavailable once the financial sanctions hit Russian banks. The tests are product-level gravity with a high-dimensional fixed-effects Poisson estimator, eq. (4) in the paper,
where flags sanctioner-to-Russia flows, is a set of period dummies (a pre-trend window, then December 2013–February 2014, March–July 2014 and August–December 2014, the treatment deliberately stopping before the 2015 macro shocks) and is a product characteristic; and the same thing run on monthly French customs data at the firm-product-destination level, with the export trend of each firm to Russia compared with its trend to fifteen sanctioning eu and eea countries near Russia, chosen because their exports were hit too, so the estimate is conservative.
The boycott loses. Consumer goods fell less than the average product, if anything (the product-level interactions are positive and significant in every period), and French luxury firms within their product lines show nothing but one small, unexpected positive coefficient. The trade-finance story does better. Lacking any Russian data on payment terms, the authors borrow the share of Turkish exports paid by letter of credit in each HS4 product from Demir and Javorcik (2018) — Turkey being comparably far from France, comparably developed financially, and usefully exogenous to anything happening in Russia — and interact it with the treatment.
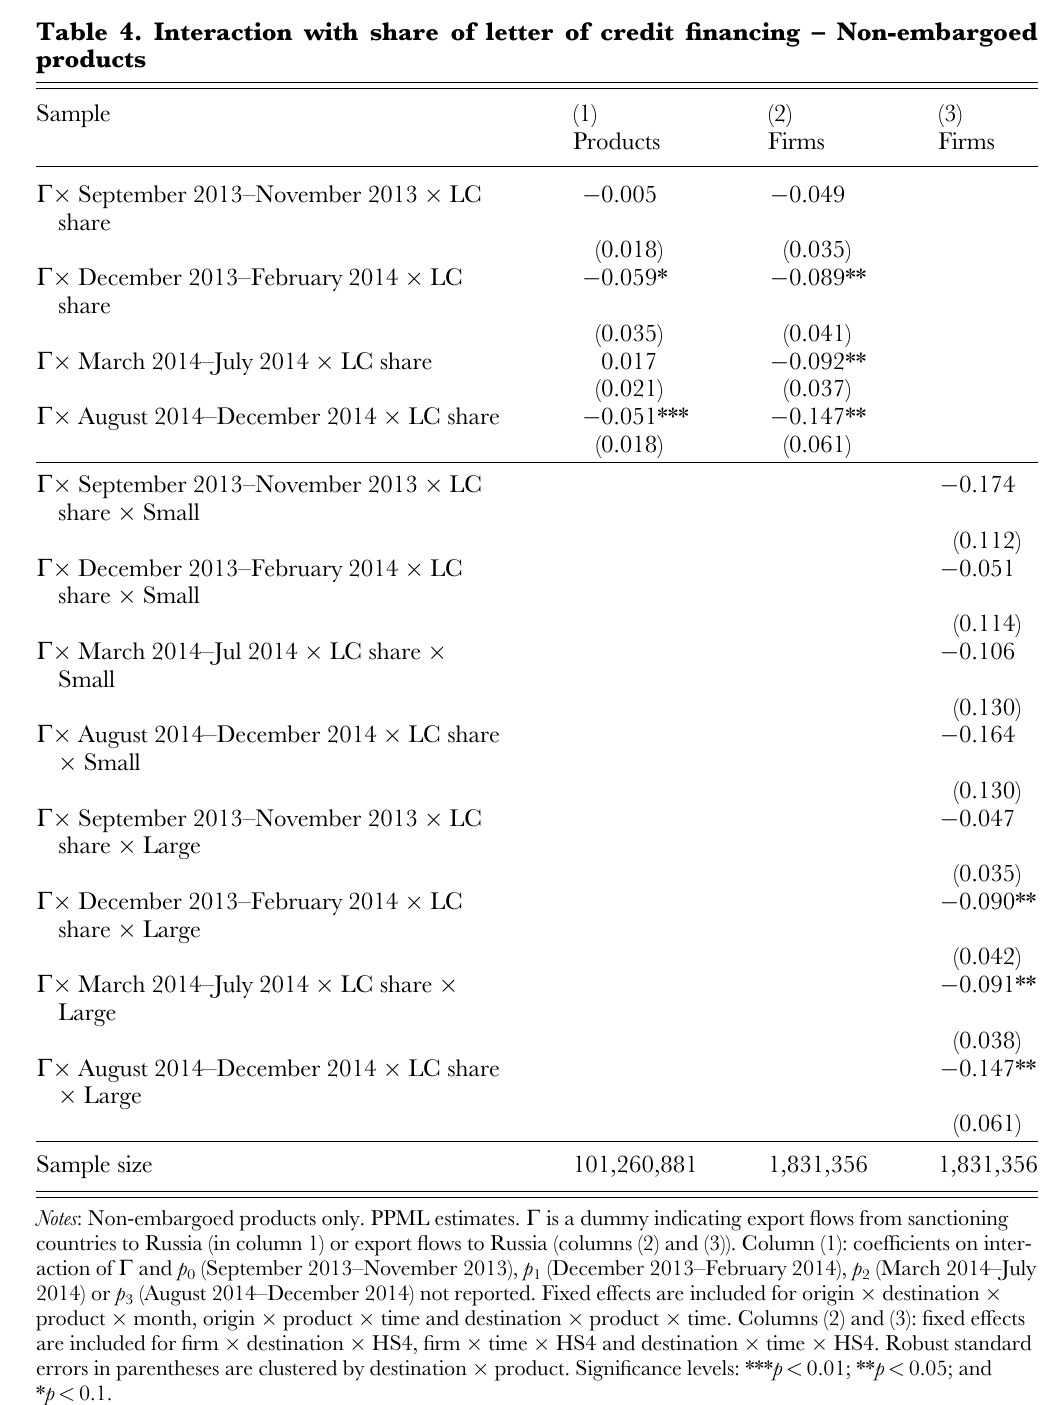
Products that lean on letters of credit fell more. In the firm-level regression the interaction is largest in the period the financial sanctions arrived, August to December 2014, at −0.147 against −0.089 and −0.092 in the two periods before; at the product level the August–December coefficient is −0.051, though the first conflict period’s −0.059 is of similar size. The effect is carried entirely by large firms, which are the ones that use bank intermediation; for small firms nothing is significant. The obvious objection is that letters of credit might be proxying for a product’s general dependence on external finance, so Table 5 races them against the Rajan–Zingales (1998) measure as extended by Braun (2014). Finance-dependent products never fall more; their coefficients are positive where they are significant at all, so they if anything fared better than average, and adding them leaves the letter-of-credit coefficients virtually unchanged. The authors’ reading is that the West’s own financial sanctions, plus the legal and political uncertainty around them (the Commission felt the need to publish a guidance note in December 2014 confirming that eu persons could still issue letters of credit to sanctioned entities), made exporters and their banks de-risk out of Russia — a cost imposed by one’s own side on one’s own firms, hence friendly fire.
What the discussants pushed on
Alberto Martin found the results convincing and raised four things. First, the general-equilibrium machinery the headline depends on is entirely in an appendix, which for an Economic Policy audience is the wrong place. Second, if sanctions also depressed Russia’s overall import demand, the importer-time fixed effect absorbs that as a fall in predicted trade — visible in Figure 1, where predicted flows drop after the third wave — and so he asked, as a question rather than a verdict, whether the 96 billion is a lower bound. Third, open-account trade is also trade credit, so why is only the letter-of-credit share used? That one is never answered in print; in the panel Hinz conceded it as future work, saying that data on open-account and cash-in-advance financing “may be ways to address this”. Fourth, and separately, letters of credit might capture general dependence on external finance; this is the concern the published Rajan–Zingales race addresses, and Martin found the race persuasive, saying it strengthens the trade-credit interpretation. He closed by suggesting a simple model of trade credit to say which firms and which financing terms should be hit hardest.
Robert Stehrer read the same numbers the other way: 7.4 percent of exports means Russia was “hardly hit”, and the finding that sanctioners lost more than non-sanctioners is “(too) much promoted”. He objected to the title — backfiring is not the same as being hit by one’s own fire, and “unintended” or “collateral” damage would be the honest words — which is a little pointed, because the paper’s earlier title was Collateral Damage; the authors renamed it toward self-infliction and the discussant asked for the old one back. He also wanted more on the smart sanctions, on Russia’s macro situation, on state-owned firms and non-sanctioners with special ties like Belarus, and doubted that French luxury goods are the right place to look for a preference shift when cars and durables would carry more of it.
The panel offered alternatives the data cannot fully exclude. Beata Javorcik suggested Russian customs harassing imports from unfriendly countries (hard to separate from general uncertainty) and misclassification of embargoed goods into neighbouring codes (checkable through mirror-statistics discrepancies); Banu Demir added that the within-HS4 comparison used in the tariff-evasion literature would do the same job. Atish Ghosh asked about spillovers to non-sanctioners — an Indian firm banking with Citibank might avoid Russia too — which could explain the collapse in imports from non-sanctioning countries. Neeltje Van Horen and Demir pressed on the proxy: much trade with institutionally weak countries runs on cash in advance (Antràs and Foley 2015), so letters of credit may capture little; the general financing channel should be absorbed with industry-time fixed effects; and if the object is trade finance, the sum of open account and letters of credit is the right measure, since letters of credit are really about non-payment risk. Benjamin Born proposed Swiss exporters as a control that separates Russian demand from country risk. Kevin O’Rourke wondered whether a trade-credit channel should show up immediately at monthly frequency or with a lag. Hinz replied that the monthly data are used as annual data would be, with only the bilateral effects varying by month; that trade finance is “the big question”, to be pursued with sectoral dependence measures and open-account data; that the general-equilibrium adjustment is precisely the answer to “other things happening in Russia”, and other work finds the sanctions were not the main driver of the recession; that misclassification can be checked by adding import-side data; and that the method only needs the bilateral monthly fixed effect to be stable, a much weaker assumption than anything Russia-specific.
Where it sits
Presented (empirical) in 2.3, as the baseline against which the 2022 round is read. Two of its findings are the premises of presented papers: the asymmetry of the bill (Hausmann–Schetter–Yıldırım’s (2024) coalition-versus-Russia ratios, Becko’s (2024) terms-of-trade logic) and the fact that financial sanctions bite through trade — the channel Ghironi–Kim–Ozhan (2025) put in a dsge and Bianchi–Sosa-Padilla (2022) put in a sovereign-default model. Egorov, Korovkin, Makarin and Nigmatulina’s Export Sanctions (2026) is the 2022 sequel with firm data on the Russian side and rerouting through third countries as the main event; Itskhoki–Ribakova’s (2024) bpea survey carries the 2014 lesson — that sanctions on finance hit trade faster than sanctions on trade — into the 2022 design debate. It earns a presentation because the measurement comes with a mechanism test, the boycott-versus-trade-finance race in the firm data, and because the printed discussions hand the group its objections ready-made; it is the sanctions paper to read for the numbers, provided one reads the table rather than the sentence beside it.