Notes on:
The Global Sanctions Data Base
European Economic Review 129: 103561
2020
geoeconomics · sanctions · gravity · data
Paper · doi · PDF
Made with AI: Opus 5 (reading and writing)
Gabriel Felbermayr (Kiel Institute and Kiel University), Aleksandra Kirilakha (School of Economics, Drexel University), Constantinos Syropoulos (Drexel and CESifo), Erdal Yalcin (Konstanz University of Applied Sciences) and Yoto V. Yotov (Drexel, Center for International Economics, ifo Institute and CESifo). “The global sanctions data base,” European Economic Review 129 (2020), article 103561; received 15 October 2019, revised 26 July 2020, accepted 30 July 2020. This digest is written from the published version, and it supersedes an earlier one written from the authors’ working paper of 14 October 2019 — the two are not the same paper. Coverage moved from 1950–2015 to 1950–2016, the gravity table grew a column and roughly 800,000 observations, every sanction coefficient in it changed, the ols work moved into a new table, and the supplementary appendix was dropped. Figures 1, 4, 7 and 8 and Tables 1, 2 and 3 are cropped from the published version; page references are to it. No talk recording exists for this paper.
A sanction is what the sender’s paperwork says it is
Start with the classification problem, because it is the whole paper. A government does something unpleasant to another government. Is it a sanction? A tariff is not, on this paper’s rules, and neither is an anti-dumping duty, because standard trade policy protects a domestic economic interest while a sanction punishes or compels — a footnote concedes that “the distinction between sanctions and standard trade policy tools is increasingly becoming blurred,” which in 2020 was putting it gently. A threat is not a sanction either: the Global Sanctions Data Base records only measures that were enforced, and that exclusion is the main thing separating it from the older compendia it competes with. What is left is the paper’s definition, “binding restrictive measures applied by individual nations, country groups, the United Nations (un), and other international organizations, to address different types of violations of international norms by inducing target countries to change their behavior or to constrain their actions” (p. 4). The work in that sentence is done by a violation of international norms, as declared by the sender. The database takes the sender’s stated grievance at face value, which is not a criticism, because no other grievance is available to a coder.
On those rules the first release holds 729 “publicly traceable” multilateral, plurilateral and purely bilateral cases enforced over 1950 to 2016. The tracing is the labor. Multilateral cases come from Security Council resolutions and public un documents; us and eu cases from policy orders and national sources; the rest from national sources searched country by country, plus international newspapers, history books and, the paper says without embarrassment, keyword web searches, which is how one finds a 1987 Turkish port ban on Cypriot-flagged vessels. Each identified case was checked by at least three different individuals, and the whole was cross-checked against sipri, Hufbauer’s (2007) original files (shared by his team) and the political scientists’ ties (2014) data. The output comes as a case-level file and a dyadic sender–target–year file, and the dyadic one is the point: it is built to be merged onto a bilateral trade matrix.
The headline chart is one American measure
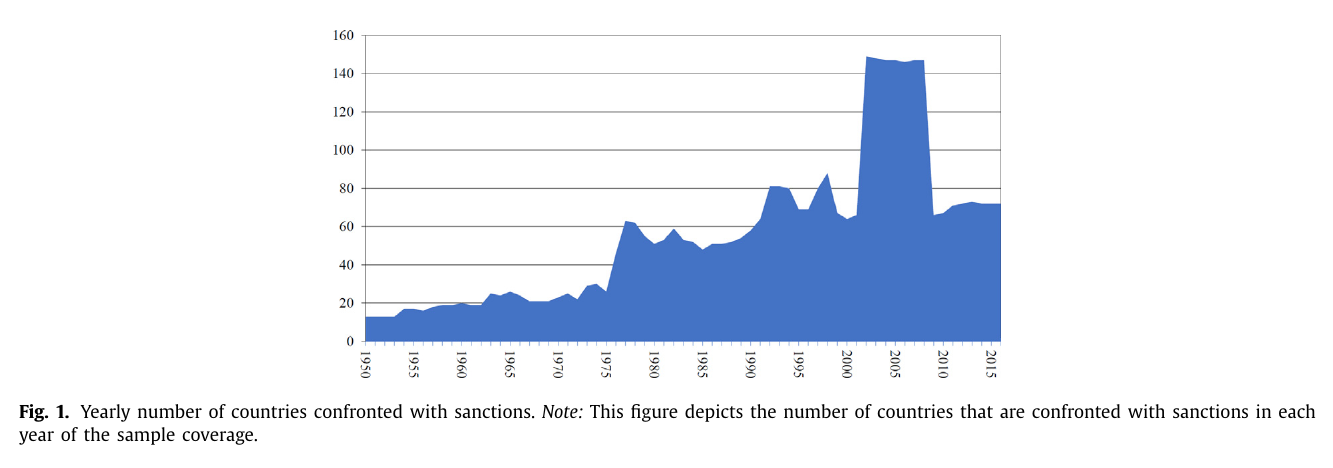
Figure 1 is the paper’s first stylized fact — sanctions are increasingly used — and the shape of it is not the gentle upward drift you would sketch from the abstract. About a dozen countries a year sat under some sanction in the early 1950s. The count reaches roughly 62 by 1977, mills around in the fifties and sixties, climbs to about 80 in the early 1990s and spikes near 87 in 1998. Then it doubles, to a flat plateau of about 148 countries that holds from 2002 to 2008, and then falls off a cliff back to around 67.
The explanation is one sentence on p. 5: “the third spike occurs in the early 20 0 0s which is caused by the us sanction imposed on the International Criminal Court (icc) Rome Statute Signatories in 2002.” That is the entire discussion. So the largest feature of the paper’s headline chart, and the largest downward move in the series when it expires, is a single case in which one sender sanctioned most of the world’s governments at once for having signed a treaty. The unit of analysis is the sender–target pair, and a case that names a hundred-odd targets generates a hundred-odd country-years of “confronted with sanctions.” This is not an error; it is exactly what the chart says it counts. It is a clean demonstration of what a case count does and does not measure, and it is worth holding next to the fact that Figure 4, which counts impositions by type rather than countries confronted, shows no plateau at all — it dips around 2005 and then rises steeply after 2010 to a peak near 430 in 2014. The two charts are drawn from the same 729 cases and disagree about when the 2000s happened, because they are counting different things.
Type is the dimension the paper cares about
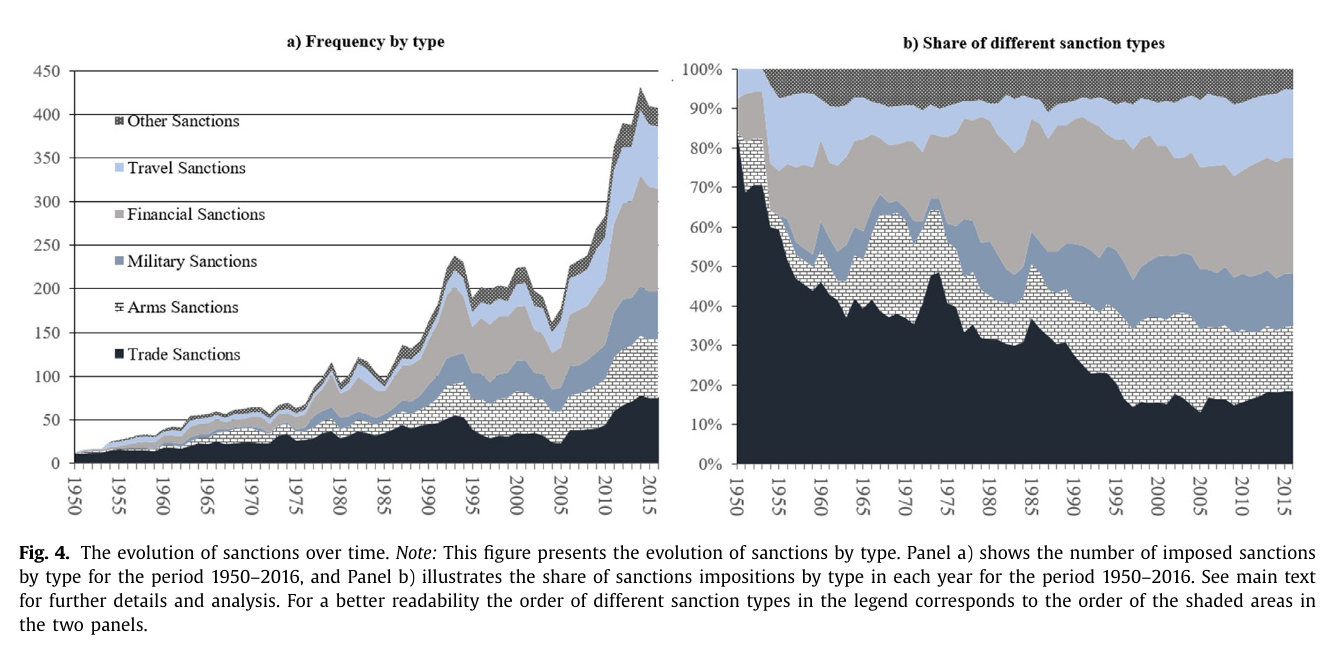
Each case is coded along three dimensions, and the paper is candid that one of them is why the thing was built. Type comes first: trade, financial, travel, arms, military assistance, and a residual “other” for diplomatic measures, flight and harbour restrictions. Trade sanctions get the fine structure, and nothing else in the sanctions data ecosystem carries it — direction (the sender’s exports to the target, its imports from it, or both), coverage (partial, meaning specific goods or sectors, or complete), and whether the sender acted alone or in a group. The worked examples in footnote 14 are the 1962 us sanction on Cuba, a unilateral full trade sanction; un Resolution 1696 (2006) on Iran, a full multilateral trade sanction; and the us sanction on Liberia of July 2004, a unilateral partial trade sanction.
Panel (b) of Figure 4 carries the second stylized fact. In 1950 trade restrictions essentially were sanctions, at about four-fifths of impositions; the share slides to a trough near 14 percent around the turn of the century and sits at about a fifth in 2016, with financial, arms and travel measures taking the space. Within trade, the coverage margin moves too: in 2015 around 70 percent of countries applying import sanctions restricted the corresponding flows only partially, and on the export side about 60 percent of sanctioning countries went partial between 1950 and 1990, roughly half went complete in the decade after, and partial export sanctions were rising again in the early 2000s. Geography adds non-reciprocity. North-western Europe imposed the most trade sanctions on Africa in 2015, and “not a single state from Africa imposed a trade ban against a North-Western European state. This non-reciprocity is a striking feature of the data” (p. 5). Sanctions run downhill, and the data see the hill.
Objectives are read off the documents, and the paper says so
The second dimension is what the sender said it wanted. Every sanctioning instrument states conditions for lifting, and the gsdb sorts those into nine bins — policy change, destabilize regime, territorial conflict, prevent war, terrorism, end war, human rights, democracy, other — up to three per case and, explicitly, unranked: “It is not possible to rank the defined objectives with respect to their priority” (p. 9). The footnote everybody will want to cite is number 20, on the same page: “The gsdb only includes officially listed objectives. However, it is possible that the true objectives of sanctions can differ from those officially proclaimed.”
Which means the fourth stylized fact is a fact about preambles. Human rights is the most frequently declared objective by a discrete margin, followed by democracy; after the mid-1990s policy change and regime destabilization “almost disappeared” and were substituted by human rights, ending wars and territorial conflict, with democracy objectives lately re-gaining relevance and exceeding their 1980s and 1990s levels. Whether the Cold War’s destabilize-the-regime cases became the 2010s’ human-rights cases because the aims changed or because the vocabulary did is a question the data are built not to answer, and the authors put that in writing rather than leaving you to notice it.
Success is the part you should argue with
The third dimension is outcome, and here the coding gets genuinely hard. For each declared objective the database assigns one of five scores: partial success, full success, settlement by negotiations, enhancement/failure, or ongoing. The evidence is “official government statements or indirect confirmations in international press announcements,” which means a coder reading whether the sender declared victory. Haiti 1991–1994 is a full success because Aristide came back and the trade ban was lifted. Ethiopia–Eritrea 1999 is a negotiated settlement whose “final success of the initial policy objective still remains unclear.” Indonesia is a failure: the us dropped its military sanction in 2005 not because human rights in East Timor had improved but because Washington now wanted Jakarta’s help against terrorism. The rule is that a sanction lifted with its objective unmet has failed, which is defensible and also codes a foreign-policy realignment as a loss.
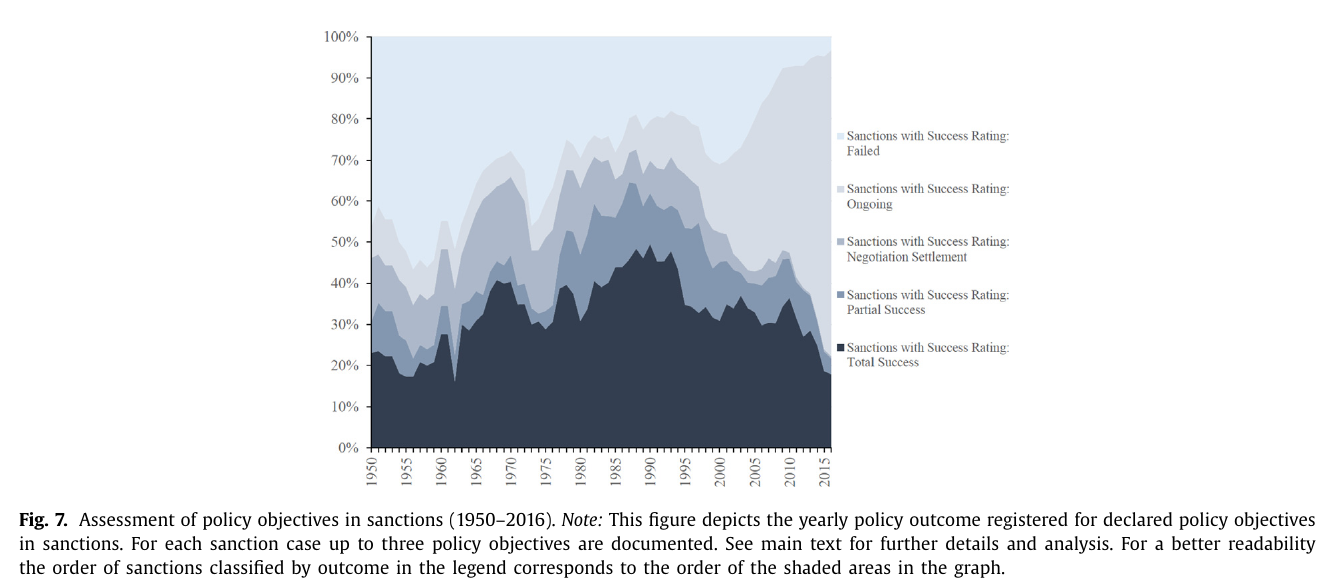
Figure 7 is the fifth stylized fact and it needs reading with that rule in hand. Until the mid-1960s almost 50 percent of the declared objectives are coded failed and, the text says, between 20 and 30 percent totally successful. From the mid-1960s to 1995 total success rises steadily; it tops out near 48 percent around 1990 and is still near 45 percent at 1995. After 1995 there is what the paper calls “a dramatic drop,” down to roughly 19 percent by 2016. But look at what replaces the successes. Not failure — “almost no defined policy objective is assessed as unsuccessful in recent years” — but ongoing, the pale mass that swallows the top half of the chart. A sanction still in force cannot yet have failed, and cannot yet have succeeded, so a good part of the post-1995 collapse is right-censoring wearing the costume of a trend. The paper half-concedes this and half-doesn’t, attributing the ongoing share to “the increased complexity of sanctions and the mixture of issues they target,” which is a story about sanctions rather than about the calendar.
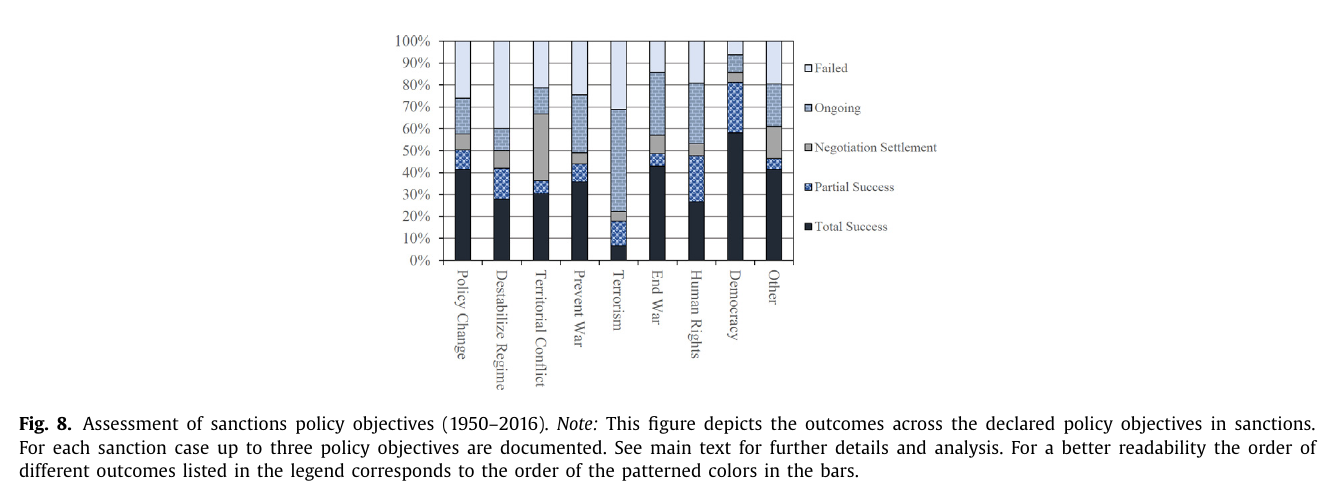
What survives censoring is the cross-sectional average, and here the published version quotes itself two different ways and does not reconcile them. The abstract, the introduction (p. 3) and the conclusion (p. 19) all say the average success rate is about 30 percent across declared objectives. Section 2.3 (p. 11), discussing Figure 8, says “the average success rate of around 34% across different policy objectives is very much in line with the effectiveness rate of 34% that is reported in the analysis of Hufbauer et al. (2007)” and falls in the middle of the 27 to 37 percent range from ties. Both numbers are in the paper; the 34 is the gsdb’s own figure, not merely Hufbauer’s borrowed for comparison. Anyone quoting one should know about the other. Figure 8 is also where the objective-by-objective contrast actually lives: around a third of aims assessed successful across the board, democracy meaningfully higher, terrorism very low and most often failed, alongside regime destabilization and policy change.
Where it sits among its relatives
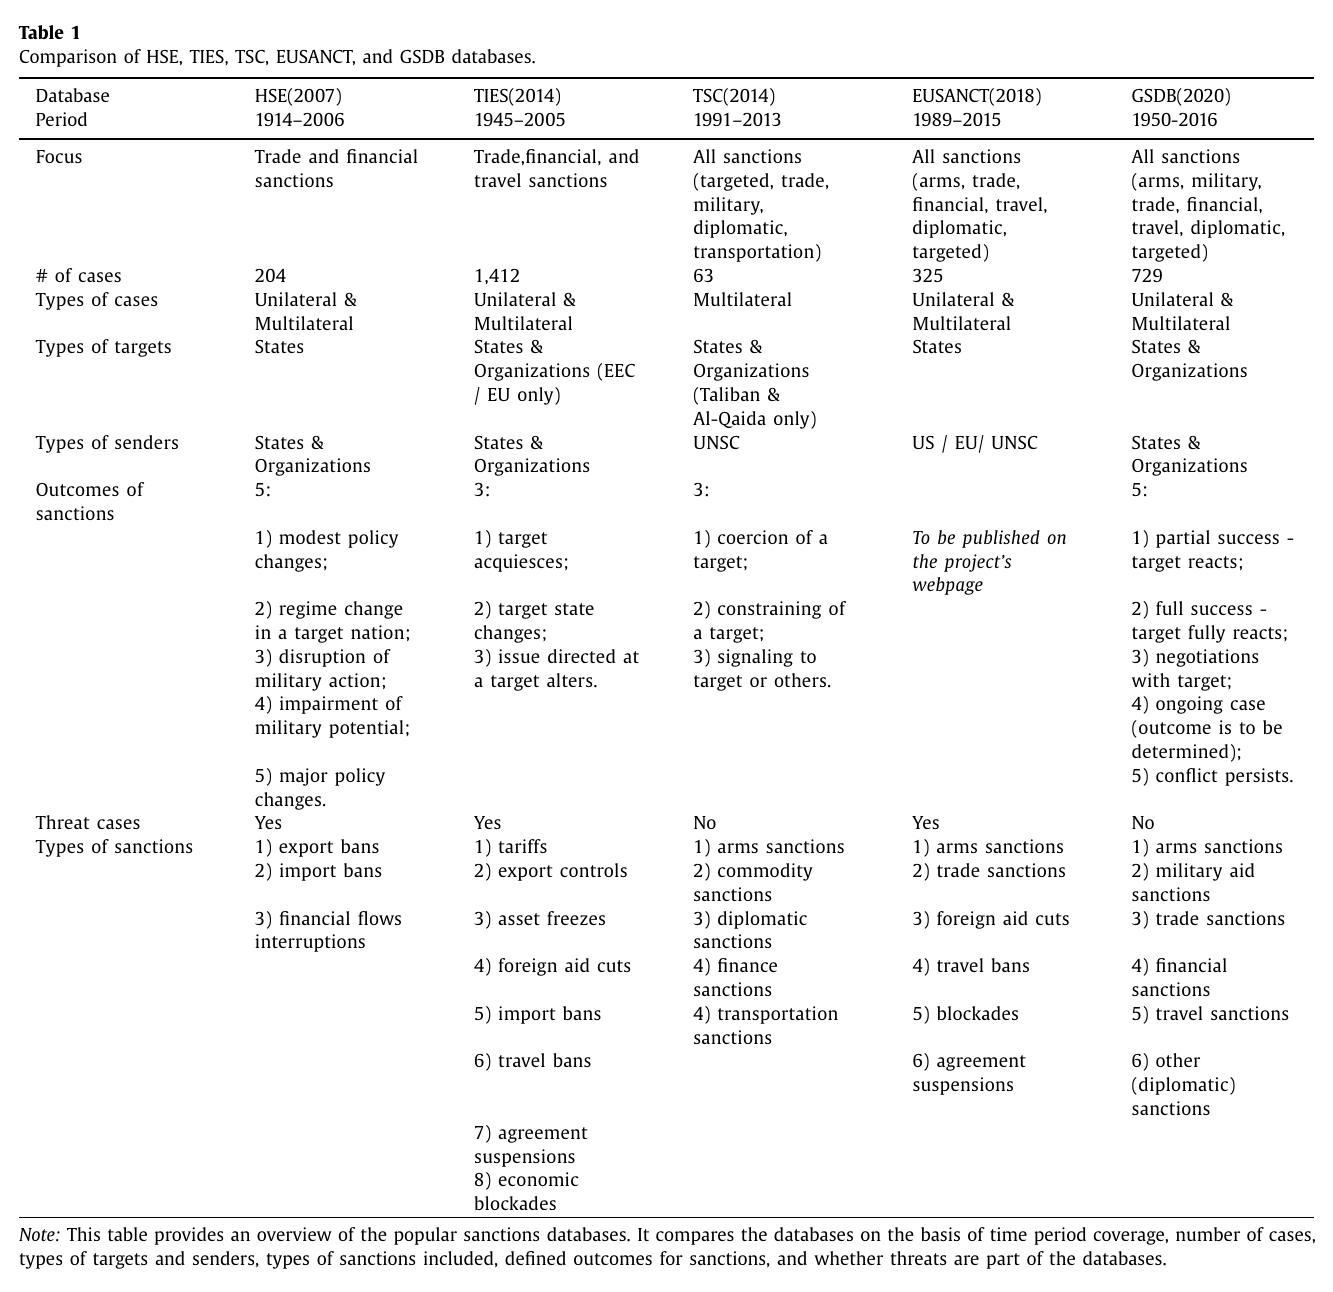
Table 1 is the family photograph. Hufbauer, Schott and Elliott’s hse has 204 episodes from 1914, mostly American. ties has 1,412 cases from 1945 to 2005 and scores outcomes from the target’s side as well as the sender’s. The Targeted Sanctions Consortium (2018) has 63 Security Council episodes and the useful idea that a sanction can succeed by signalling without anyone complying. eusanct (2022) merges the lot from 1989 and bolts on V-Dem (2017) and coup data (Powell and Thyne 2011), contributing 106 cases that were not previously in hse, ties or giga. The gsdb’s advantages are stated modestly: the most cases among databases focused on enforced sanctions, a long window, the trade decomposition, a dyadic layout.
Its omission is the one that matters for the theory papers. hse, ties and eusanct record threats; the gsdb does not, and says so in the table, in a footnote, and in the conclusion. The coercion models run on the off-path threat — the sanction that works precisely because it never has to be imposed. This database sees only on-path cases, which are by construction the threats that failed to deter. Every success rate computed from it is conditional on that selection, which is a reason to think 30 percent, or 34, understates whatever it is you actually wanted to measure.
The gravity application, and what re-estimation did to it
The paper closes with a demonstration that is really a warning, and the demonstration in the published version is not the one in the working paper. The estimating equation, numbered (1) on p. 13, is standard structural gravity:
Here is nominal trade from exporter to importer at , drawn from three sources — the imf’s Direction of Trade Statistics, un Comtrade and the wits Trade Stats database. The and are exporter-time and importer-time fixed effects absorbing the Anderson–van Wincoop (2003) multilateral resistances; is a pair fixed effect absorbing every time-invariant bilateral trade cost, invoked here for the Baier–Bergstrand (2007) reason, to blunt the endogeneity of the policy. holds log distance, contiguity, common language and colonial relations from the usitc Dynamic Gravity Database (Gurevich and Herman 2018), plus three time-varying policy dummies for economic integration agreements, eu membership and wto membership. is the vector of sanction dummies, decomposed further with each column. The exponential form is ppml, chosen for heteroskedasticity and zeros. Estimation runs on 1,935,070 observations in the first three columns and 1,936,973 once pair effects come in, with standard errors clustered by country pair.
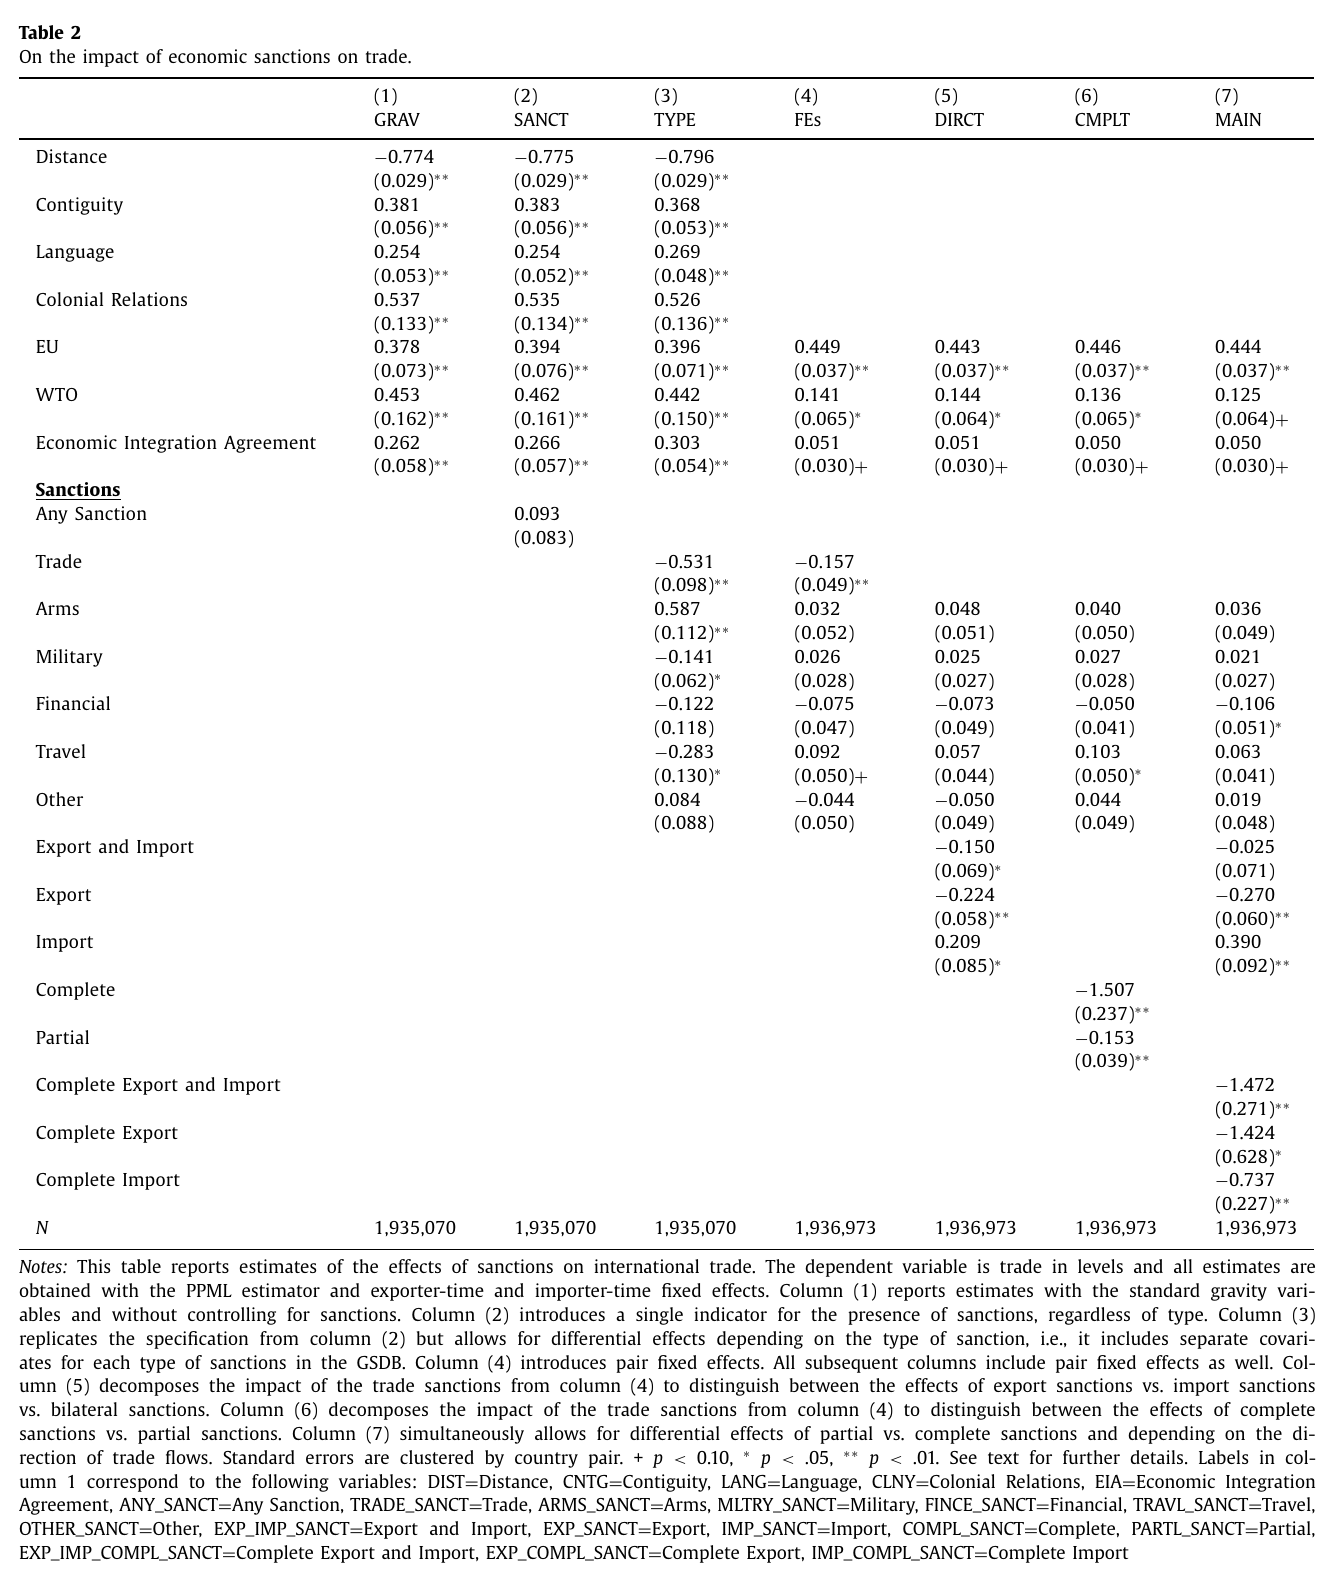
Column (2) throws in a single dummy for any sanction of any sort and gets 0.093 with a standard error of 0.083. That is nothing: economically small, statistically insignificant, and the paper’s own summary of it is that “when the impact of sanctions is constrained to be common across all sanction types, we do not obtain meaningful estimates.” This is worth pausing on, because the working paper got 0.422 with a standard error of 0.120 — pooled sanctions apparently raising bilateral trade by half, a result that was fun to quote and is now gone. With about 800,000 more observations and a year more revision, the pooled coefficient collapsed to zero and lost significance. The rhetorical structure survives; the punchline changed. Whatever you thought you knew about the pooled sanctions dummy from the earlier draft, you should stop knowing it.
Column (3) splits by type without pair effects and the heterogeneity appears: trade sanctions at −0.531, arms at +0.587, military at −0.141, travel at −0.283, financial and other insignificant. The trade estimate is read in the text as a 41 percent reduction in sender–target trade with a 14 percent tariff equivalent, from and at an assumed trade elasticity of 4. Column (4) adds pair fixed effects and most of that evaporates. Trade falls to −0.157, still significant and now a third the size, which the authors read as the earlier column having absorbed time-invariant bilateral trade costs into the sanction dummy. The arms coefficient does not shrink — it vanishes, to 0.032 with a standard error of 0.052. In the earlier draft it fell to a smaller positive and was left as an intriguing puzzle; in the published version there is no puzzle left, only a demonstration that pairs which sanction each other’s arms trade differently from average pairs for reasons that predate the sanction.
Columns (5) through (7) are the reason the coding exists. By direction: export sanctions −0.224, bilateral export-and-import −0.150, and import sanctions positive at +0.209, significant at 5 percent. By coverage: complete −1.507, partial −0.153, read as a 77.8 percent fall in bilateral trade against about 14 percent, with tariff equivalents of 45.8 and 3.9 percent. Column (7), the main specification, crosses the two, with the directional variables redefined by subtracting off their complete counterparts so that they measure partial sanctions. Complete bilateral sanctions carry −1.472, a 77 percent reduction and a 44.5 percent tariff equivalent. Complete export sanctions carry −1.424 with a wide standard error of 0.628. Complete import sanctions carry −0.737 — a 52 percent reduction, 20.2 percent tariff equivalent, comfortably significant — which is another place where the published version reverses the working paper, where no import sanction was distinguishable from zero. Partial bilateral sanctions are insignificant, partial export sanctions run −0.270, and partial import sanctions come in at +0.390, positive and significant at 1 percent. Financial sanctions, alone among the non-trade types, hold a small significant −0.106.
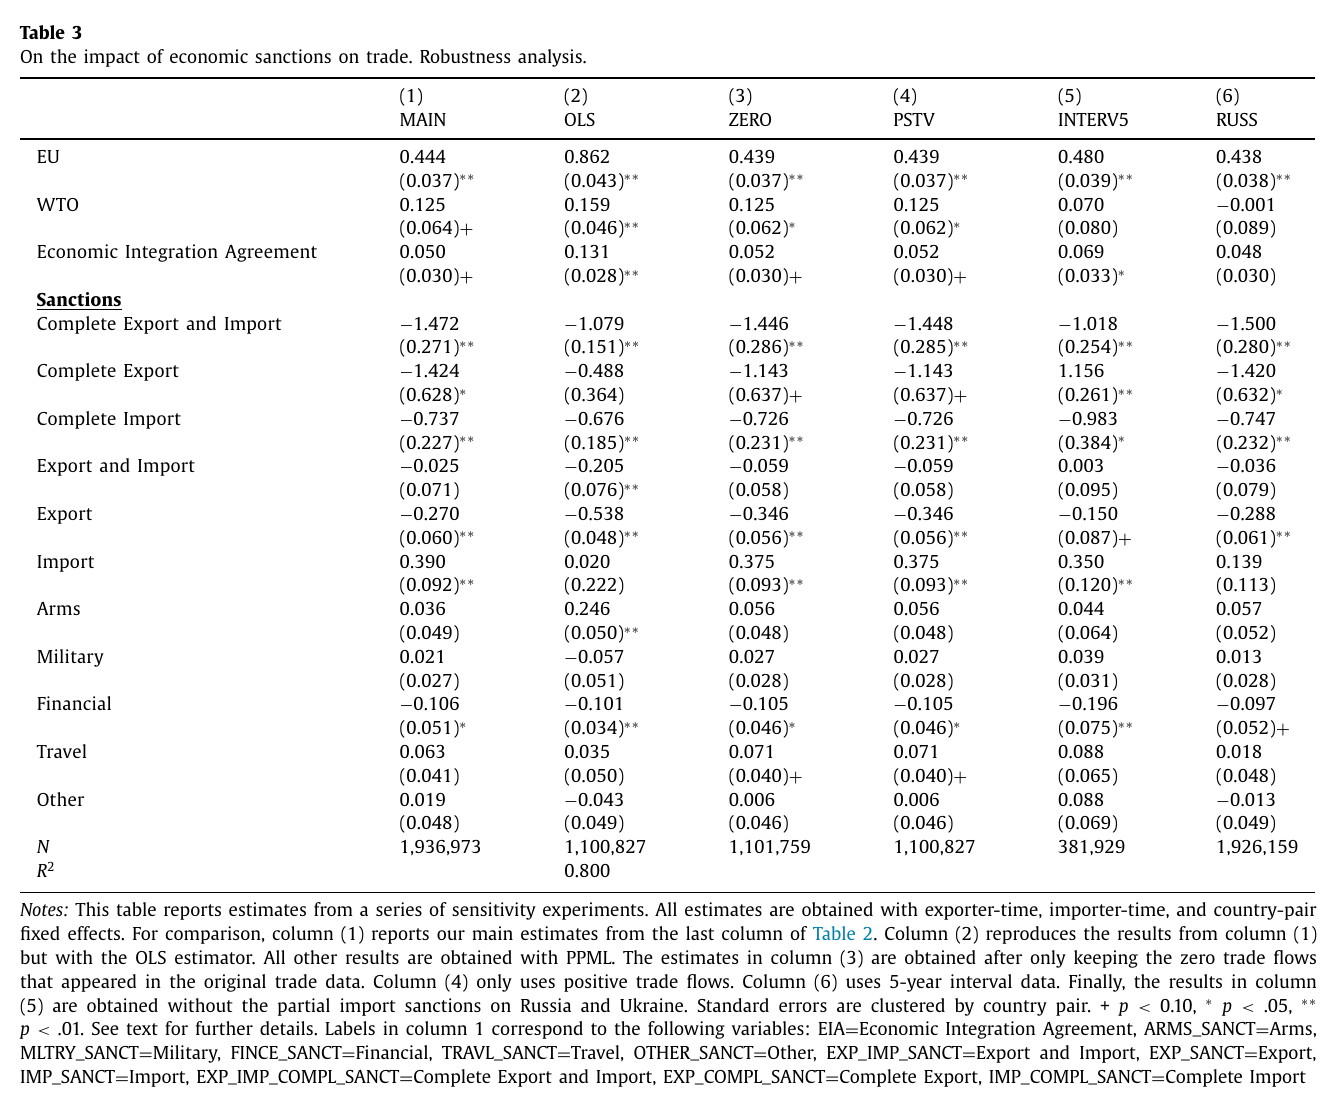
So partial import sanctions raise trade, significantly, and the last column of Table 3 tells you why, which is the most honest thing in the paper. Inspecting the import variable turned up, alongside a series of economically small countries, two cases: Ukraine raising transit fees on Russian gas in 1993 after Russia cut oil supplies, and Japan’s 2014 ban on Crimean imports, aimed at Russia but recorded against Ukraine because Crimea is Ukraine. Trade rose in both. Drop them and the import estimate falls to 0.139 with a standard error of 0.113 — nothing. A coefficient significant at 1 percent across 1.94 million observations was two country pairs, and the authors went and found them rather than leaving them in the table. Their own lesson is the right one: “the effects of the partial sanctions should be estimated at the sectoral level of aggregation at which they are imposed.”
The rest of Table 3 is less dramatic and worth knowing anyway. ols keeps the ranking — complete bilateral sanctions still strongest at −1.079 — but complete export sanctions lose significance at −0.488 with a standard error of 0.364, and partial import sanctions collapse to 0.020, so the two results that most need robustness are the two that get less of it. Retaining or dropping zero trade flows changes essentially nothing, which the authors take as support for Santos Silva and Tenreyro’s (2006, 2011) point that ppml earns its keep on heteroskedasticity rather than on zeros. And the column of five-year interval data flips complete export sanctions from −1.424 to +1.156, significant at 1 percent, in a table whose accompanying text says the interval and consecutive-year estimates “are very similar to each other with no systematic pattern in the direction of the potential bias.” A sign flip on a headline variable is a pattern, or at least it is not similarity. One caution for anyone citing this table: its Notes assign the five-year intervals to column (6) and the Russia–Ukraine drop to column (5), while the column headers and the main text put them the other way round. Read the columns, not the labels.
Three caveats the paper carries without dwelling on them. The coefficients are partial equilibrium, not the general-equilibrium counterfactuals that later work builds for the 2014 Russia round. Pair fixed effects handle time-invariant selection but not anticipation, and trade with a country you are about to embargo does not typically wait for the order. And every sanction regressor is a zero-one dummy, so a partial sanction on one metal and a partial sanction on all machinery enter as the same variable — which is precisely what the Russia–Ukraine experiment ends up demonstrating, at the authors’ own expense.
Where it sits
A data row in the sanctions sub-block, for a mechanical reason: it is the treatment variable in nearly every gravity paper on sanctions since, and the source of the stylized facts the block’s survey opens with. It belongs to a tools session rather than a presentation, alongside the un ideal points for alignment and the geopolitical-risk index for risk — the three off-the-shelf geoeconomic variables anyone on this list will eventually merge onto a trade matrix. Read the coding sections and the disclaimer, and note that the 729 was already stale when the article appeared: two footnotes say the update then in progress covers 1045 cases through 2019, and the disclaimer promises that “the December 2020 release of the gsdb will cover more than 300 additional cases, which we have already tracked over the period 2016–2019,” on top of an official release date of 1 July 2020, bi-annual updates for two years and annual updates after that. The database has kept moving on that schedule ever since, so any survey built on a current release will not match the numbers here. The definition has not changed, though, and neither has the rule that a sanction lifted for the sender’s own convenience counts as a failure. On that rule, the sender is the only party whose change of mind the data can see.