Notes on:
Silicon Valley Everywhere? Place-Based Innovation Policy and the Direction of Entrepreneurial Entry
Working paper (SSRN 7460442)
2 October 2026
entrepreneurship · place-based policy · accelerators · attention
Talk · Paper · doi · Transcript
Made with AI: Haiku 4.5 (research), Opus 5.5 (reading, diagram and writing), Fable 5.1 (adjudication), Sonnet 5.5 (verification)
Part of Economics of Talent Conference, Fall 2026
Freda Fang and Mohaddeseh Heydari Nejad
Presented by Mohaddeseh Heydari Nejad at the nber Economics of Talent Conference, Cambridge ma, 2 October 2026 (video). No discussant.
Source note: no paper was obtainable. An ssrn version (abstract 7460442) exists but could not be fetched, so this piece is written from the talk and its slides only. Every number below is one a slide showed or the speaker said, and where the two differ the text says which it is quoting.
An accelerator, seen from outside, is an advertisement
Advertising economics has an old identification trick. An ad can tell you a product exists, or it can make the product worth more to you. Ackerberg (2001) separated the two by looking at buyers who already knew the product: they have nothing to learn, so their response is the payoff effect, and the newcomers’ excess response is information. Bronnenberg and coauthors (2015) ran the same logic with pharmacists buying store-brand aspirin.
This paper points that design at a startup accelerator: the Creative Destruction Lab (cdl), a non-profit, science-based mentorship programme founded in 2012 at the University of Toronto, which “doesn’t uh provide any uh funding even to the participants” (06:49:50). cdl opens industry-specific “streams” in host cities, for example climate in Vancouver in 2020 and oceans in Halifax in 2019. The launches in the sample are spread across 10 cities. The paper studies only founders who never applied to cdl at all. For them a launch carries no money and no mentorship. What it can do is tell them an industry exists, and that makes it, for this population, an advertisement for an industry. The informed agents are serial founders, and the newcomers are first-time founders.
Heydari Nejad’s own example (06:38:53) is an electrical engineer who might be a better fit for climate or space, “but they in their local environment it might be that they all hear about software companies.” A climate initiative might make climate more lucrative, which is the payoff channel. It might also “thicken the line” of attention, which is the consideration channel. The claim is that the second channel alone moves real entry, among people the programme never touched.
The reduced form: entry moves, the city doesn’t grow
The first exhibit is a city × industry × year ppml regression of startup counts, with city-year, industry-year and city-industry fixed effects (the last for cases like Halifax, which gets oceans because “there’s no way they can, you know, start a an ocean in Toronto”).
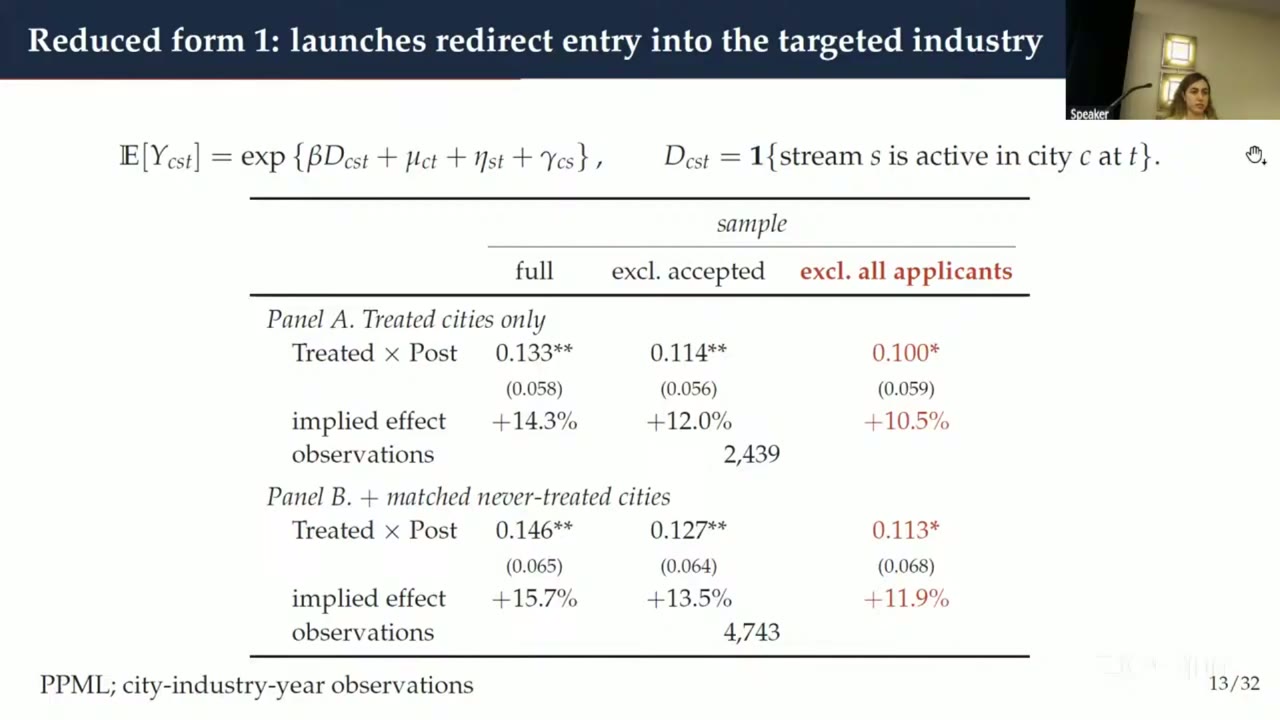
The headline “+12%” on the summary slide lines up with 0.113 (+11.9%), the Panel B column that drops every applicant. That coefficient carries one star, and the treated-cities-only version is +10.5%. Because the regression has city-year fixed effects, this is a relative shift toward the targeted industry. One questioner caught the implication right away: a founder who switches from health to climate shows up as one fewer health firm and one more climate firm, a gap of two. She answered that the reallocation is the point, and that a separate event study shows untreated industries falling as treated ones rise, relative to matched cities. The summary slide also lists the nulls: “No detectable expansion in city-wide founding” and “No reallocation of capital across industries.” So the would-be Silicon Valleys do not detectably get bigger. Their founders get pointed somewhere else.
Splitting founders into four types settles who moved. “First-time” means nobody on the team has founded before. “Science-trained” means at least one member has a science or engineering degree.
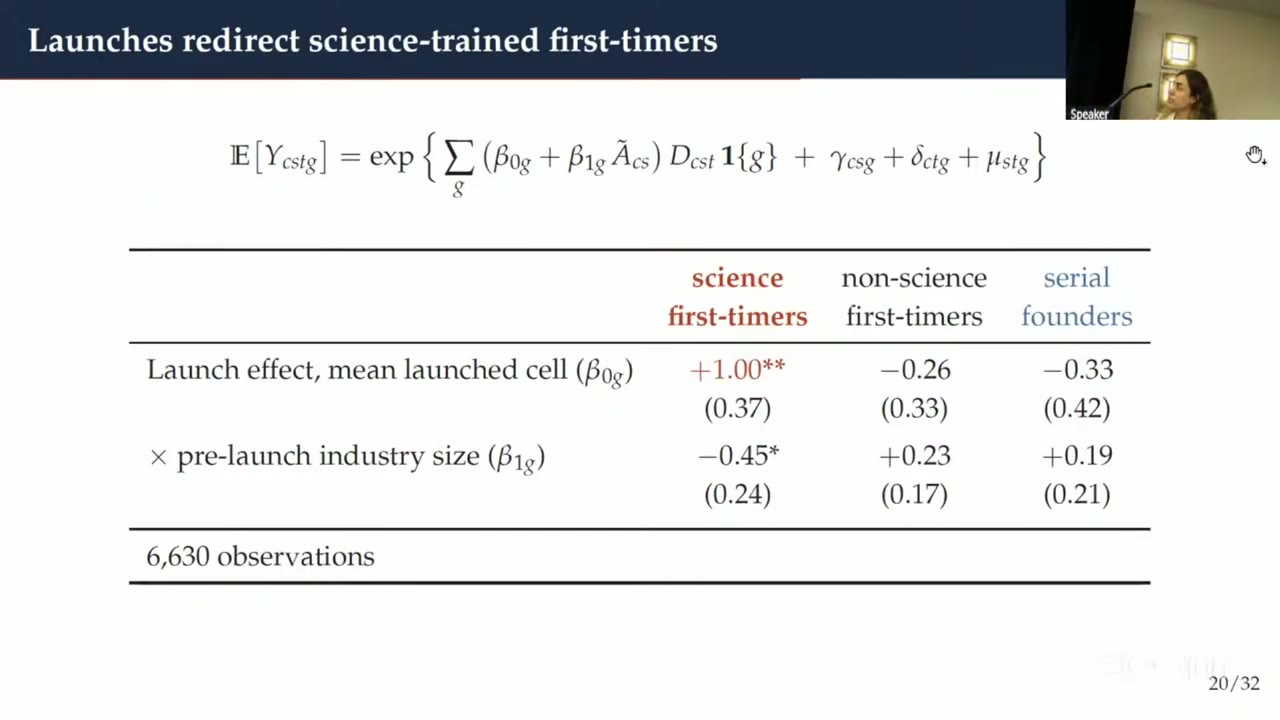
Science-trained first-timers move by about one log point, and the effect shrinks where the industry was already big locally. Non-science first-timers and serial founders show nothing distinguishable from zero. On the serials, note that this is a null, “no detectable response,” and not an estimated zero. That distinction matters in a moment, because the model is about to assume a zero for them.
The model: attention is whatever serial founders don’t do
The structural model is a team-level choice over 17 industries, conditional on founding (there is no outside option). It is a multinomial logit in which each industry carries an attention weight as well as a utility (slide 21/32):
Here is the attention weight, the deterministic utility, the indicator that stream is live in city at , the pre-launch relative size of the industry locally, team characteristics and founding experience. Because multiplies , the log odds are additive in and , and differencing across a treated industry and an untreated gives the identifying equation (slide 22/32):
So is the payoff spillover and the log change in attention, and only first-timers have a .
Look at where the word “attention” actually gets attached. Nobody observes . Assumption A1 says a launch does not change serial founders’ consideration weights. She was careful to say this doesn’t mean they are fully informed: “they just don’t change their search uh behavior” (07:10:10). Under A1, the serials’ response is . Assumption A2 says that, given and , the payoff spillover does not depend on experience. Under A2, whatever first-timers do beyond the serials is . The consideration channel is therefore defined as the first-timers’ excess response, and it carries the label “attention” because of the two assumptions. The design is clean. But anything that makes a launch more valuable to a novice than to a veteran with the same degree, and that has nothing to do with attention, lands in too. One candidate shows up in the talk’s own descriptive results. Non-applicant entrants after a launch are more likely to be schoolmates of the admitted cohort, which she flagged as “just a descriptive result.” A friend in the programme is a way of hearing about climate. A friend in the programme may also be a way of getting free advice on a climate startup, and A2 is the assumption that this advice is worth the same to the novice and the veteran.
What the estimates say
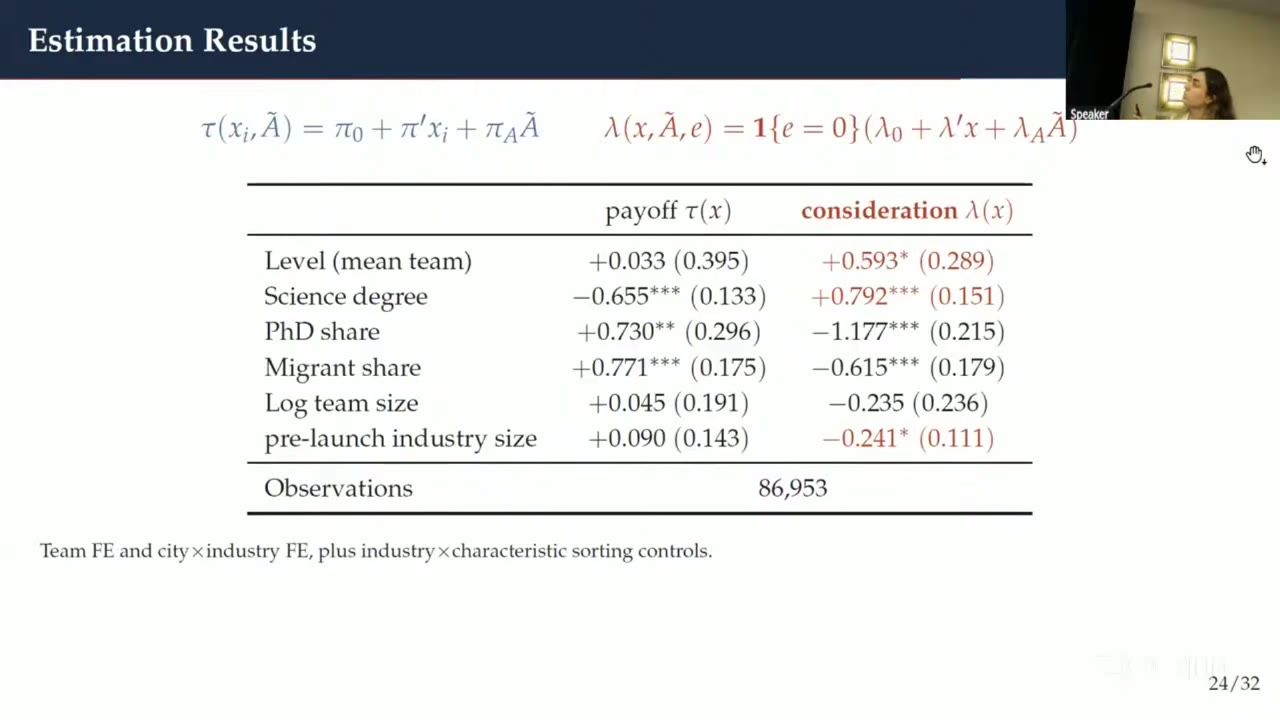
For the mean team, the payoff level is +0.033 with a standard error of 0.395, so it is nothing. The consideration level is +0.593, rises with a science degree and falls with local industry size. Now look down the rows. Every characteristic that moves one channel moves the other in the opposite direction. Science degree is −0.655 on payoff and +0.792 on consideration. PhD share is +0.730 and −1.177. Migrant share is +0.771 and −0.615. The presenter’s reading (07:11:23) is that PhD-heavy and migrant-heavy teams have already searched and specialised, so information cannot move them and only extra payoff can, consistent with rational inattention, where “the attention is allocated where the uh payoff is already high.” That may well be right. One caution, which is mine and not the talk’s: some of the mirror is built into the identification. is pinned down by the much smaller serial sample, and is the first-timer response minus that , so any error in shows up in with the opposite sign. Opposite-signed pairs are what pure noise would produce. The stars say this isn’t only noise, but the symmetry is less of a discovery than it looks.
Holding characteristics at their averages, the talk decomposes each type’s total response:
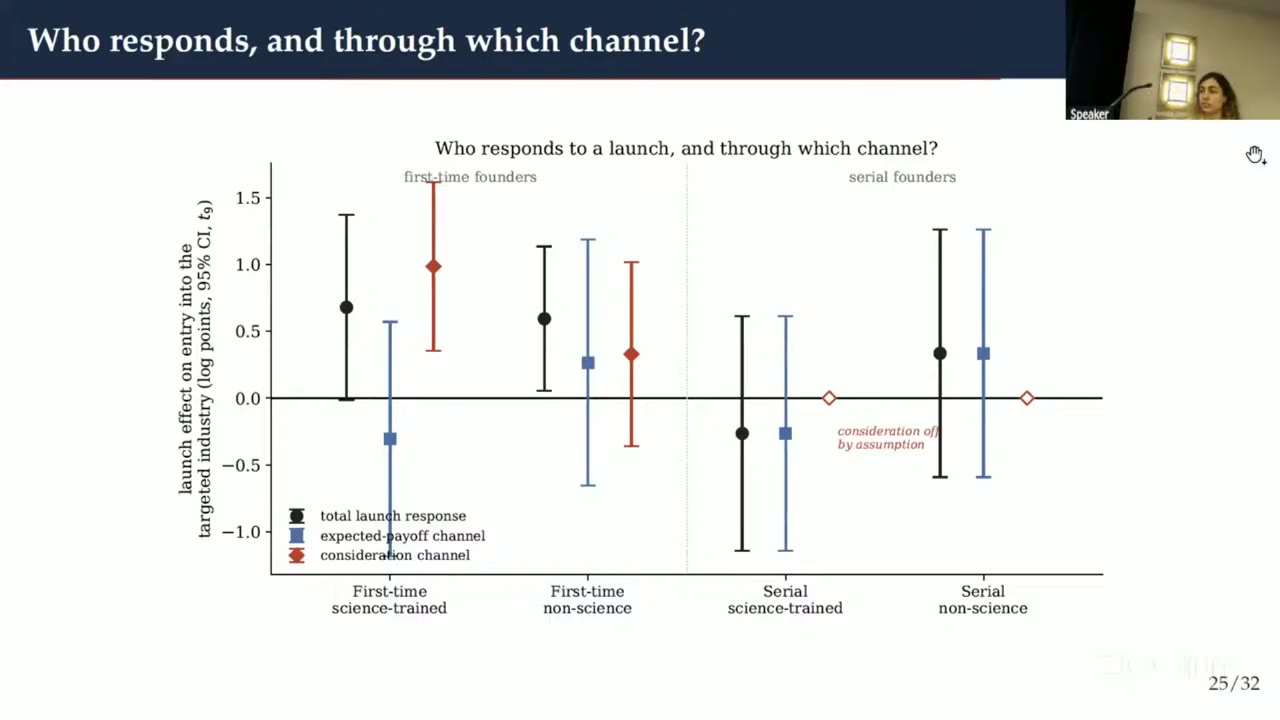
For science-trained first-timers, the total is about 0.7 log points, or roughly double the odds. Consideration is about 1.0 and payoff about −0.3, read off the plot. So the consideration channel is bigger than the whole effect, and the payoff point estimate soaks up the difference. That payoff estimate has an interval spanning zero. The fair summary is “no detectable payoff gain, if anything negative.” The targeted industry is not shown to be a worse bet for them. (The −0.655 on the science dummy says something narrower: science teams get a smaller payoff spillover than otherwise-similar non-science teams.) The serials’ red markers sit at zero because the model puts them there under A1. Their black totals are insignificant, which is the same null as in the reduced form.
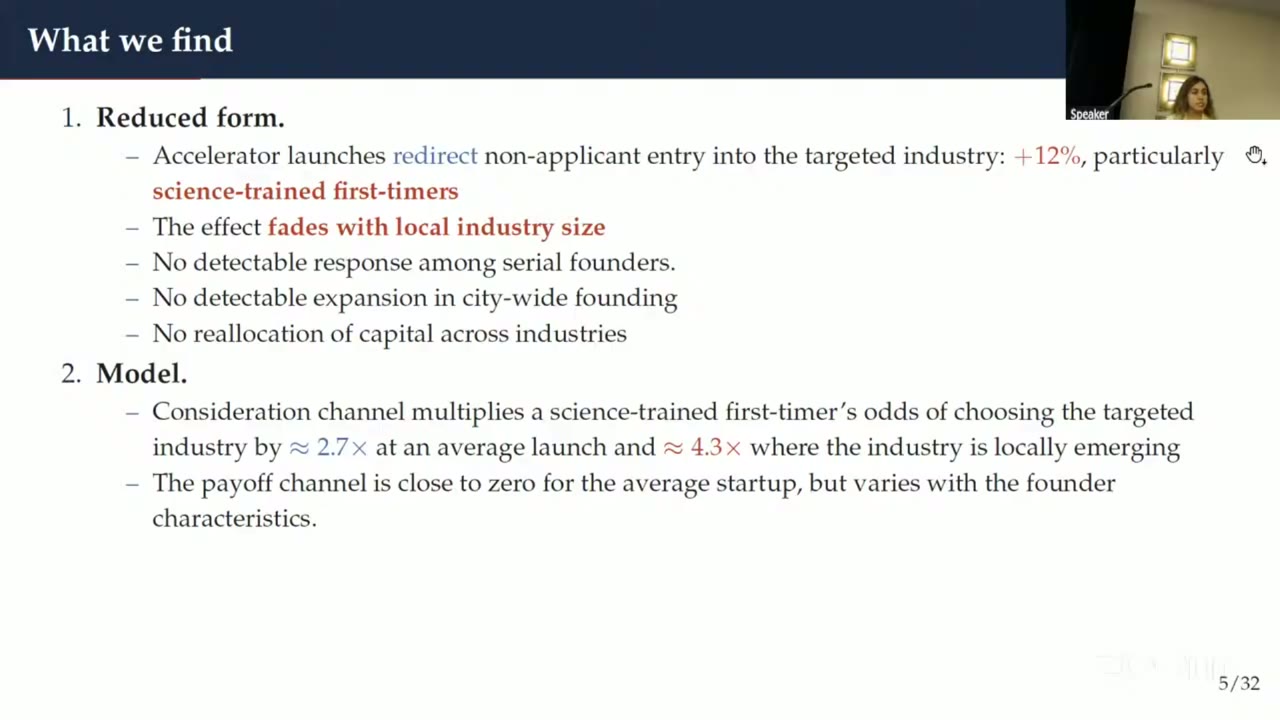
Now the headline multipliers. The summary slide says the consideration channel multiplies a science-trained first-timer’s odds of choosing the targeted industry by about 2.7× at an average launch and about 4.3× where the industry is locally emerging. These are , the consideration channel on its own: , which matches the red diamond above. They are not the total change in behaviour, which is closer to 2×. In the talk this became “around three times” for “an average founder,” which is looser than the slide on both counts.
Shutting the channel off
The counterfactual sets , recomputes choice probabilities and renormalises across industries, among non-cdl founders who actually entered targeted industries.
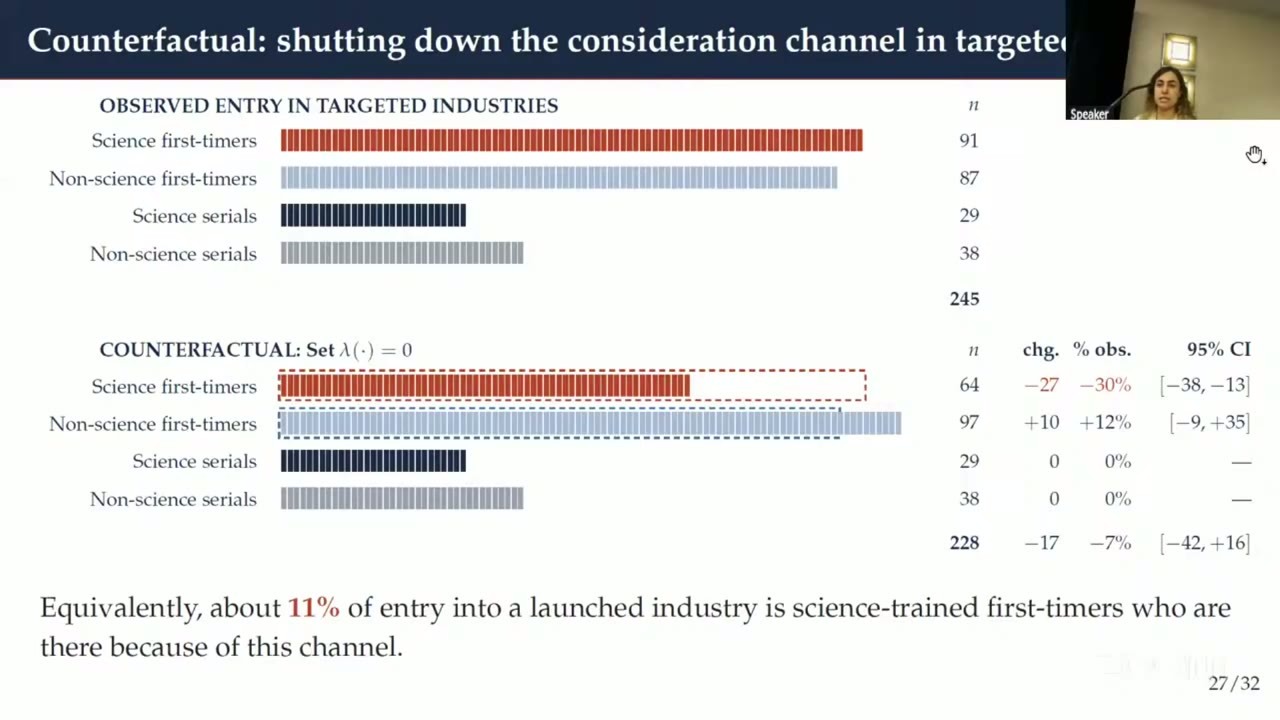
Science-trained first-timers fall from 91 to 64. That is 27 teams, or 30%, with an interval of −38 to −13, and it is the only change on the slide distinguishable from zero. Twenty-seven out of 245 gives the footer’s 11%. The non-science gain of 10 and the total drop of 17 (−7%) both have intervals spanning zero. With no outside option, those 27 teams do not disappear. They found startups in other industries. Serials are unchanged by construction.
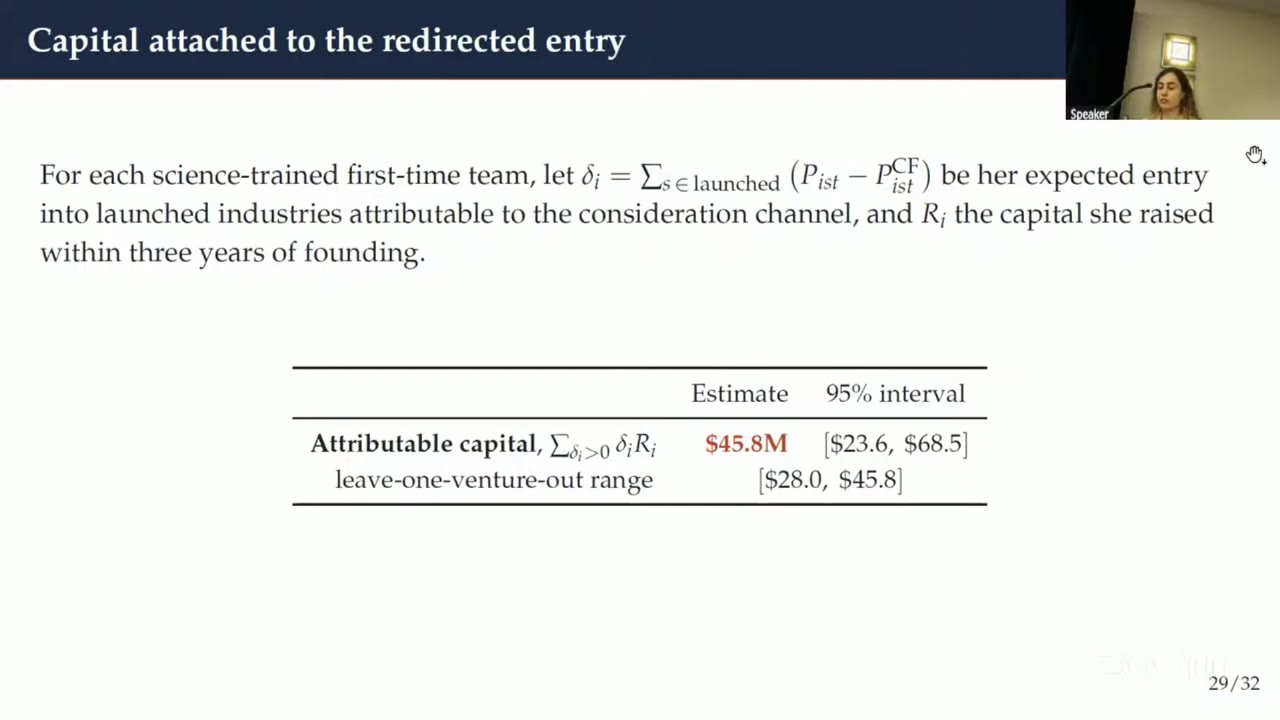
Weighting the redirected probability by capital raised within three years gives $45.8M, with an interval of $23.6M–$68.5M. The leave-one-venture-out range runs from $28.0M to $45.8M, which tells you one venture carries a good chunk of it. She was explicit that this is not new money, only the money attached to founders who were redirected.
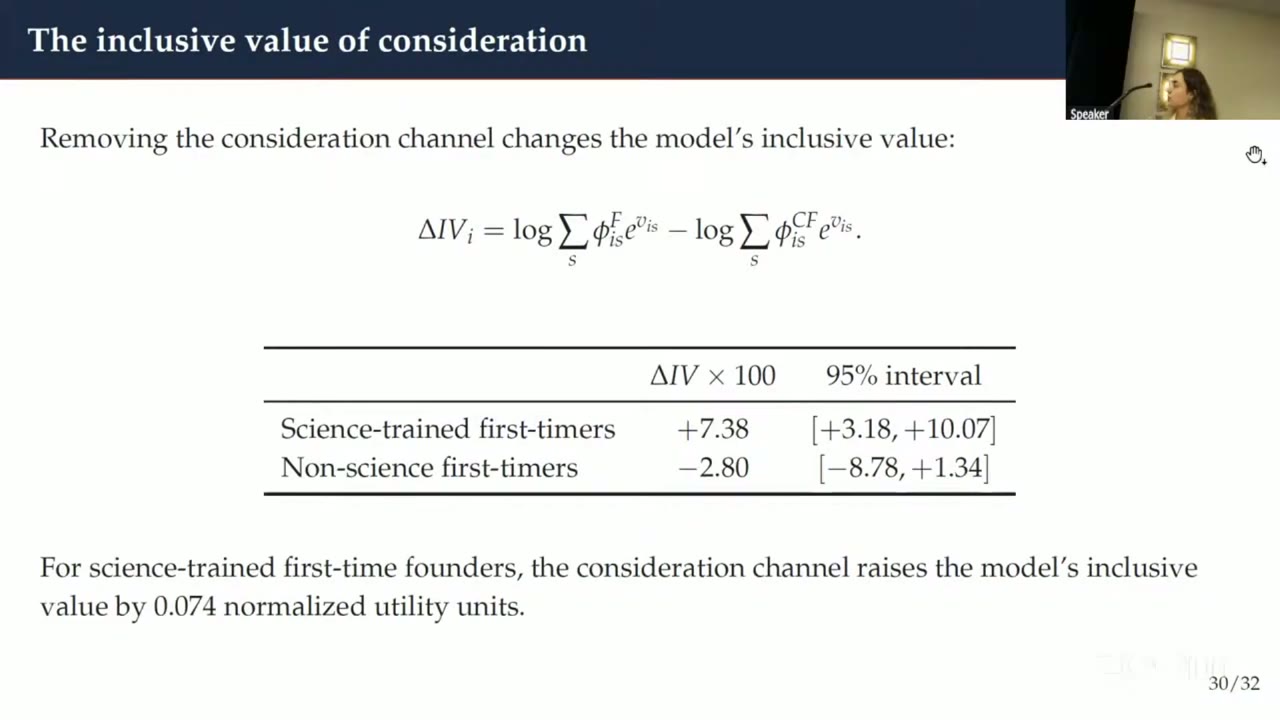
The last number is the change in inclusive value: +0.074 for science first-timers, and nothing detectable for non-science first-timers. Look at the formula on that slide. sits inside the log-sum right next to , so the measure counts a log point of attention exactly like a log point of utility. Being shown an option is worth the same, in this accounting, as the option being better. That is a modelling choice, not a finding, and the slide is careful to call the result “normalized utility units” rather than welfare.
What the room pushed on
Most of the questions were about who is in the risk set. A questioner asked whether the effect could be founders moving into a city that was becoming a climate place, and followed up that a model conditioned on founding cannot see new people becoming founders. She conceded the extensive margin is out of scope, argued that this makes the estimates a lower bound (06:44:23), and noted that the missing outside option cancels out of estimation but matters for the counterfactual. Later, a commenter, possibly the chair, said the model needs two layers, first location and then industry, and that “there’s a bit of a tension between the empirics and the model” (07:01:42). She replied that the model assumes no location choice and that “more than um 50%” of founders are local, so movers could be dropped. He said that was not what he was asking for. He was right: dropping movers changes the sample, not the model.
Asked whether four hours of mentorship every two months, with no money, could matter in places like Seattle or Toronto, she said it shouldn’t, for non-participants, which is the point of the design. Asked whether this was place-based or industrial policy, she allowed the latter but said the effect depends on the industry’s local size, so the optimal target is place-specific: lean on agglomeration where an industry is established, promote emerging ones where information is scarce. The firm universe is Crunchbase, essentially vc-funded startups. Asked whether could be negative from crowding, she said it “is allowed to be negative exactly,” and the science-degree row says it is, conditionally.
One remark from the counterfactual section is worth flagging. She said the consideration share “is larger for more established industries” (07:13:39). The by-industry slide that followed shows the share smallest in ai, the largest industry, and largest in small ones such as Energy and Commerce. The remark probably refers to absolute counts, where ai is the largest piece of the 27, and should not be read as a claim about shares.
So for everyone outside it, the programme works like a sign on a door. cdl funds nobody and mentors only the teams it admits. For the founders outside the room, what it produces in this model is mostly the knowledge that the room exists.