Notes on:
The Return to Protectionism
Quarterly Journal of Economics 135(1): 1--55
23 March 2021
trade war · tariffs · tariff pass-through · political economy of trade
Talk · Paper · doi · PDF · Transcript
Made with AI: Opus 5 (reading and writing)
Pablo D. Fajgelbaum (ucla), Pinelopi K. Goldberg (Yale, then chief economist of the World Bank Group), Patrick J. Kennedy (uc Berkeley) and Amit K. Khandelwal (Columbia Business School), “The Return to Protectionism,” Quarterly Journal of Economics 135(1): 1–55, 2020 (advance access 28 November 2019), doi:10.1093/qje/qjz036. The digest is written from the published version. The accompanying recording is not a seminar but an eleven-minute Columbia Business School “Research Spotlight” interview published 23 March 2021, in which Khandelwal is the only author speaking and Dawn Kissi (a Knight-Bagehot Fellow at the school; the captions garble the name) asks four questions. There is no discussant and no audience Q&A, so nothing in this digest is pushback from other economists.
A tariff is a tax, and someone has to pay it
Start with the thing a tariff actually is, which is a sales tax collected at the border on a good that a foreigner made. You are an American importer. You buy a $100 widget from a Chinese supplier. Your government puts a 20% tariff on it. You now owe $120 — $100 to the supplier, $20 to the Treasury — and you are worse off by $20.
Except that this is not obviously the end of the story, because you have a phone and a supplier’s number. Khandelwal, in the interview, describes the call: “I might go to my Chinese supplier and say no, lower your price down to 80, so that when I apply the tariff it’s back to basically a hundred dollars.” Whether your supplier does this is not a matter of opinion. It depends on how steep their supply curve is — on whether they have somewhere else to sell those widgets at the old price. If they don’t, they eat the tariff, and the tax is paid by China. If they do, they shrug, and the tax is paid by you. For all of 2018 and 2019, as he puts it, the administration was “basically saying” that the foreign partners were “quote unquote eating the tariff.” That is a claim with a number attached to it, and this paper is the number.
This is the entire ballgame, and it has a name: tariff incidence. It is also, as the paper points out with some restraint, a thing about which “very little is known,” despite being the parameter on which every welfare claim about trade policy turns. The 2018 trade war was, among other things, an enormous natural experiment for measuring it. Import tariffs went from 2.6% to 16.6% on 12,043 product codes covering $303 billion of annual imports, 12.7% of the total; six trading partners retaliated, pushing tariffs from 7.3% to 20.4% on 8,073 products covering $127 billion of American exports. (The paper’s own text later says 7,763 retaliated products, contradicting both its introduction and its Table I; 8,073 is the figure to use.) The estimation window runs 2017:1 to 2019:4, but the tariff waves being analysed are the 2018 ones. The September 2018 threat to take tariffs on $200 billion of already-targeted Chinese varieties from 10% to 25% was actually implemented in May 2019, which is past the end of the sample.
The clever bit: one instrument, two curves
The identification is the part worth slowing down for. You want both the demand curve (how much less do Americans buy when the price rises) and the foreign supply curve (how much does the foreign price fall when Americans buy less). Normally you need two instruments. Here the tariff does both jobs at once, because it opens a wedge between what the importer pays and what the exporter receives. Viewed from the exporter’s side, the tariff shifts demand down and traces out their supply curve; viewed from the importer’s side, it shifts supply up and traces out their demand curve. Same shock, two curves, depending on which price you put on the left. The trick is due to Romalis (2007) and was formalised by Zoutman, Gavrilova and Hopland (2018), and it is the reason a policy shock that everyone else treated as a shame can be treated here as an instrument.
Concretely, the authors estimate the pair
(equations (8) and (9)), where is the quantity of product imported from country , is the duty-inclusive price Americans pay, is the before-duty price the foreigner receives, is the elasticity of substitution across source countries, is the inverse foreign export supply elasticity, and the ’s are product-time, country-time and country-sector fixed effects. Instrument the price with the tariff in the first, the quantity with the tariff in the second, and you have both.
The answer is that we paid all of it
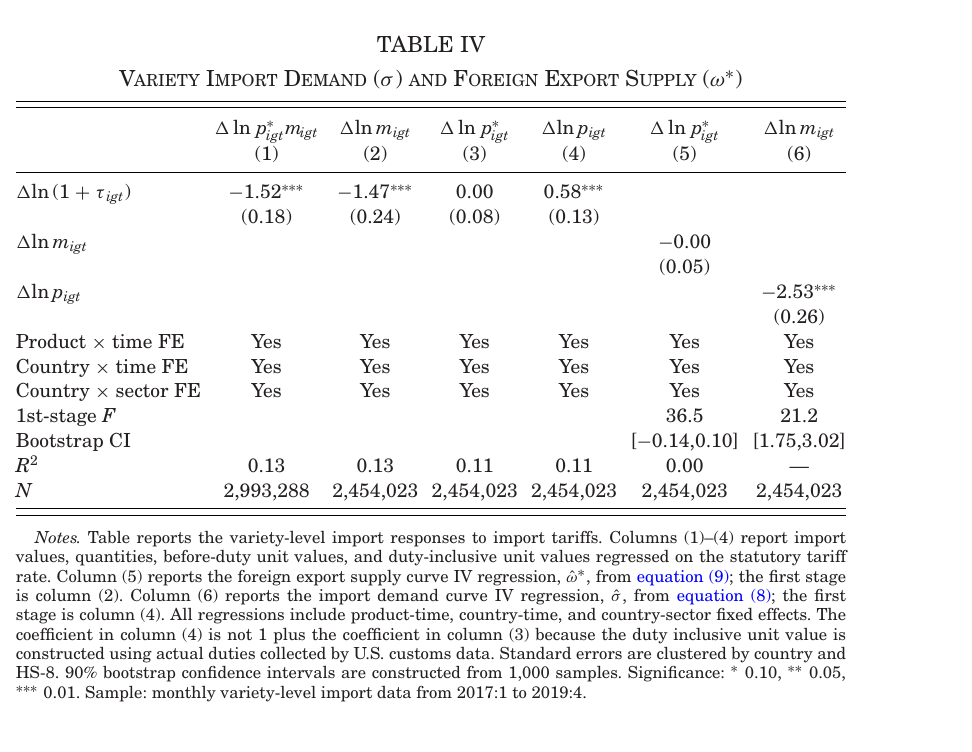
Column (3) is the whole paper. Regress the before-duty price the foreigner receives on the tariff, and the coefficient is 0.00, standard error 0.08. Foreign exporters did not cut their prices. Not a little — not at all, as precisely as this data can measure “at all,” and the precision is the point: the inverse foreign export supply elasticity in column (5) comes in at , with a bootstrap confidence interval of [−0.14, 0.10] off a first-stage F of 36.5. A flat foreign supply curve is not merely un-rejected; almost nothing else fits inside the interval. Column (4) shows the duty-inclusive price rising 0.58, which is not one minus column (3) because it is built from duties customs actually collected rather than the statutory rate. Column (6) gives , and the two elasticities together imply the value of targeted imports fell 31.7%. Pass-through is complete. The tax was paid by the people who paid the tax.
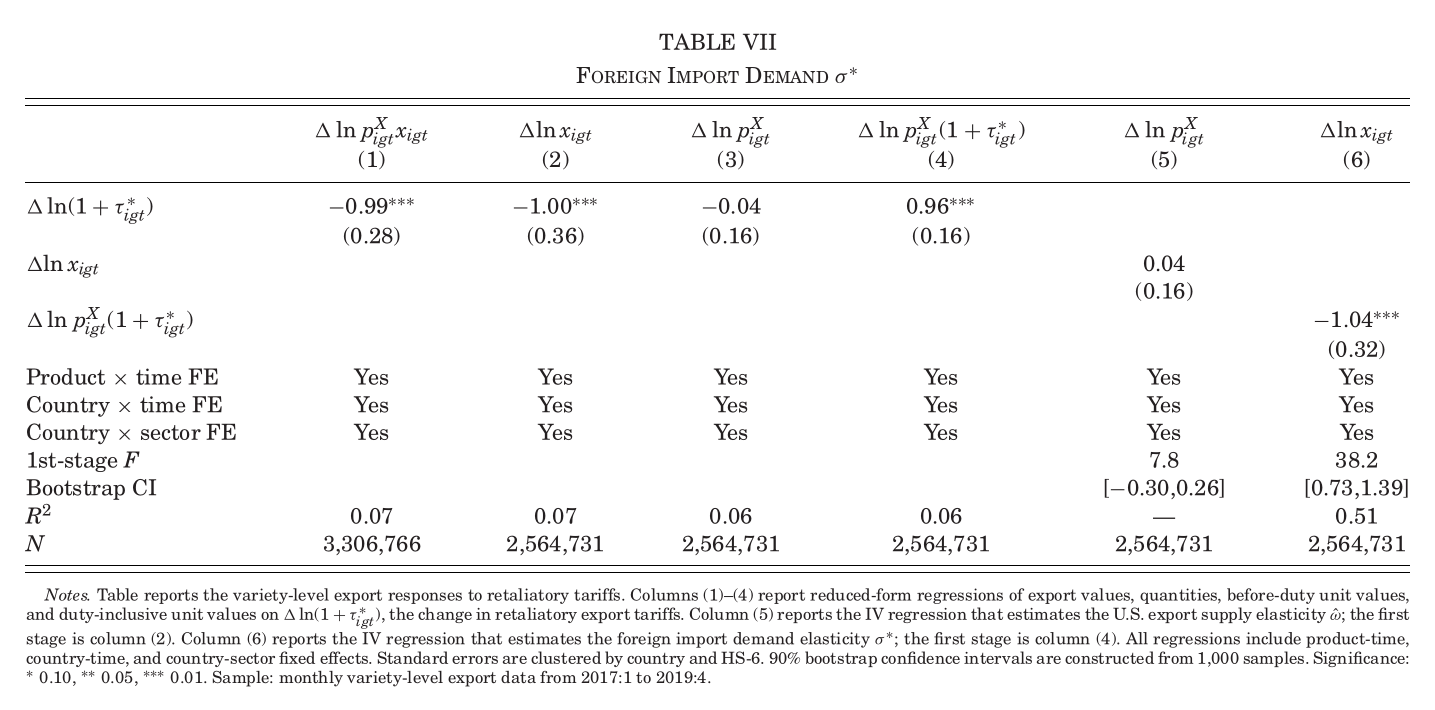
And then the mirror. Run the same design on the export side, instrumenting with the retaliatory tariffs, and Table VII says the identical thing in the other direction: before-duty American export prices move −0.04 (0.16) — that is, not at all — while the duty-inclusive price foreign buyers face rises 0.96 (0.16), which is as close to one-for-one as a coefficient gets. American exporters did not cut their prices to keep Chinese customers either. The inverse U.S. export supply elasticity is 0.04 (0.16), horizontal not rejected; foreign demand for American varieties is roughly unit-elastic, . Targeted export values fell 9.9%. This symmetry is worth pausing on, because it is easy to read the import result as a story about American negotiating weakness. It isn’t. Nobody’s exporters absorbed anything. Complete pass-through was a property of the war, not of one side of it.
The authors then do what you should always do with a suspiciously clean result, which is attack it. Pre-trends: nothing, in the sample window and in a longer 2013–2017 window. Anticipation: a dynamic specification with six leads and lags finds no anticipation of consequence and — the load-bearing part — no delayed before-duty price declines after implementation, which is the form the “just wait, they’ll cut” objection has to take. Rerouting through third countries: the before-duty price index at the product level, Feenstra (1994)-corrected for newly appearing source countries, actually rose, coefficient +0.91 (0.40), so buyers switching suppliers did not quietly recover the money. Heterogeneity: they interact the tariff with eleven different product characteristics — quality ladders, markups, contract intensity, Nakamura–Steinsson (2008) price stickiness, upstreamness, inventory ratios, Rauch (1999) differentiation — plus three separate final-versus-intermediate classifications, and find no meaningful variation in pass-through. Longer horizons: aggregate to two, three and four months, and the before-duty price still doesn’t move. Alternative fixed effects: eight different sets, same answer. Exchange rates: regress the country-time fixed effects on monthly rates and get 0.11 (0.19), and 0.04 (0.04) for China alone, so the dollar wasn’t doing the work either.
Two caveats they raise themselves and which are load-bearing. This is a short-run result, and relative prices can move over longer horizons. And because the regressions control for country-time and product-time effects, they cannot detect terms-of-trade movements that operate through wage changes at the country or sector level — so the finding is not that America is a small open economy, only that America did not push down this particular set of border prices in this particular window.
Which makes the aggregate number a transfer, not a loss
Multiply three numbers — the import share of value added (15%), the fraction of imports targeted (13%), and the average import price increase on targeted varieties (14%), which given complete pass-through is also the average tariff increase — and you get the direct loss to American buyers of imports: 0.27% of gdp, $50.8 billion on a 2016 annual basis, which the abstract and the tables round to $51 billion. That is the headline.
There is a second back-of-envelope worth having in hand, because it will matter in a moment. Take the standard Harberger triangle on the import side alone, , feed it the estimated variety-level import declines, and the deadweight loss comes to $11 billion, 0.059% of gdp, with a 90% interval of [−$13.1bn, −$7.6bn]. Hold that number.
But buyers of imports are not the whole economy, so the authors embed the estimated elasticities in a general-equilibrium model of the United States: static, perfectly competitive, flexible prices, Cobb-Douglas production with a fixed factor, capital and labour immobile across sectors and regions in the short run, counties as regions, foreign wages held fixed. The welfare accounting is Dixit–Norman:
(equation (27)), where and are pre-war import and export quantities, and are changes in duty-inclusive import prices and export prices, and is the change in tariff revenue. Consumers lose on the first term, producers gain on the second, the Treasury collects the third.
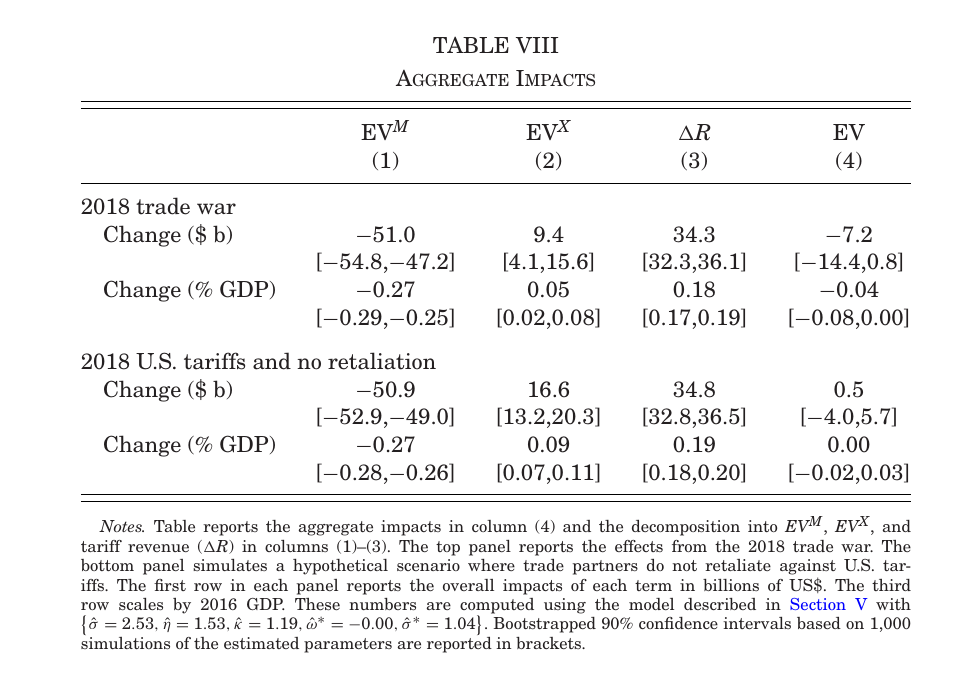
Buyers lose $51.0 billion. Producers gain $9.4 billion — a model-implied 0.7% rise in the export price index applied to the 7.4% of gdp that manufacturing and agricultural exports represent. The Treasury collects $34.3 billion, which is more than the $29.1 billion by which collected duties actually rose between 2017 and 2018, because the model isolates the part driven by the tariffs themselves. Net: a loss of $7.2 billion, 0.04% of gdp, with a 90% confidence interval of [−$14.4bn, $0.8bn] that includes zero. Let labour move across sectors and the net loss falls to about $4 billion.
Now put that beside the $11 billion Harberger triangle, which is larger than the full model’s net loss. That is not a contradiction; it is the argument. The partial-equilibrium triangle counts only the wasted trade. The general-equilibrium model adds back the terms-of-trade gain American producers get from being shielded, and that credit more than covers the difference. Which is to say that the reason the aggregate number is small is not that the trade war was efficient. It is that most of the money went somewhere rather than nowhere. The $51 billion consumer loss is precisely estimated and statistically distinguishable from zero; the $7.2 billion aggregate is not distinguishable from zero at all. The trade war was overwhelmingly a transfer — from Americans who buy imported things to American producers and the American government — with a real but modest deadweight loss layered on top. A policy sold as making foreigners pay turned out to be a domestic tax-and-transfer programme that nobody had to pass through Congress.
The counterfactual in the lower panel is the tell. Had trading partners not retaliated, the same tariffs would have produced a $0.5 billion gain, because the export price index would have risen 1.2% instead of 0.7% — a producer gain 75.9% larger. The entire aggregate cost of the trade war to America was the retaliation.
And the retaliation was aimed
Here is the part that makes this a political economy paper rather than an elasticity paper. The authors first rule out the two standard explanations for the pattern of protection. It wasn’t terms-of-trade optimisation: the optimal-tariff logic says you tax sectors with inelastic foreign supply, which requires tariffs to vary across sectors, and these didn’t — only five rates were ever applied, 99.8% of targeted varieties got either 10% or 25%, and sector-level tariffs correlate −0.10, negatively and insignificantly, with Broda–Limão–Weinstein (2008) foreign export supply elasticities. It wasn’t industry lobbying either, for the same reason, and because 2016 campaign contributions to House candidates correlate negatively with sector tariff increases.
What the tariffs did track was the electoral map. Plot county-level import tariff exposure against 2016 Republican vote share across 3,111 counties and you get an inverted U peaking in the 40–60% range: protection went to sectors concentrated in politically competitive counties, exactly as median-voter models of trade policy (Mayer 1984; Dixit–Londregan 1996; Grossman–Helpman 2005) would predict of an incumbent buying marginal votes.
Retaliation, however, was chosen by other governments, and they were not trying to win Pennsylvania. The sector-level correlation between American tariffs and retaliatory tariffs is only 0.46 — they were not simply mirroring us — and foreign governments went at agriculture, with retaliatory increases on crops, fishing, and beverages and tobacco averaging more than double the American increases. That shows up in the geography: the mean county’s retaliatory tariff exposure is 4.17 percentage points against 1.11 points of import-tariff exposure, so the shock the other side chose was nearly four times the size of the one Washington chose. The Great Lakes and the Northeast got the protection; the Midwestern plains and the Mountain West got the retaliation.
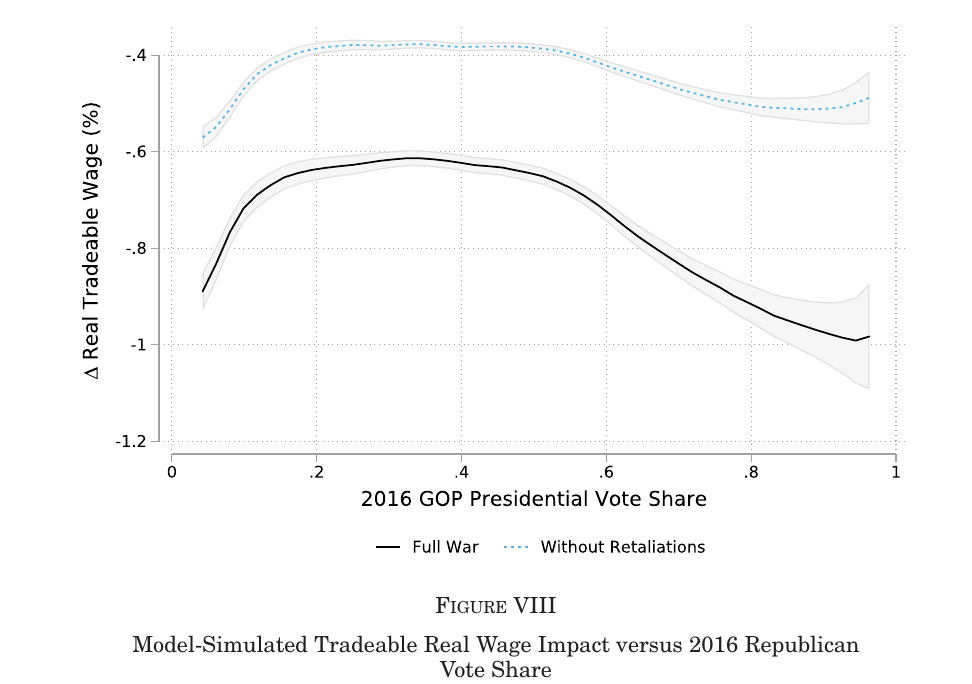
The dashed line is the counterfactual without retaliation: no sharp peak, a plateau between roughly a 35% and a 50% vote share, losses in the most Republican counties (85–95%) only 6% larger than in the most Democratic (5–15%). The solid line is what actually happened. The peak shifts leftward, to a Republican vote share of about 35% — meaning the full war relatively favoured tradeable workers in Democratic-leaning counties — and losses in 85–95% Republican counties come out 32% larger than in 5–15% counties. Every county’s tradeable real wage falls: nominal tradeable wages rise 0.1% while the tradeable cpi rises 1.1%, for an average real loss of 1.0%. And retaliation roughly doubles the damage everywhere, taking the mean county loss from 0.51% to 1.03%.
That is the genuinely surprising finding, and it isn’t ironic so much as structural. The tariffs were aimed with visible precision at the marginal counties, and in the no-retaliation world they land more or less as aimed. Then foreign trade ministries did their own optimisation, on their own map, and turned a 6% gap into a 32% gap. You can choose where your own tariffs land. You cannot choose where the other side’s land, and the other side gets to optimise too. A trade war is one of the few redistributive programmes where a foreign government holds half the dial.
One honest discrepancy
In the 2021 interview Khandelwal describes the war as covering roughly 20% of imports and $420 billion, with $133 billion of American exports targeted, and puts the loss to the American economy at “20, 25 billion dollars.” Those are not this paper’s numbers, which are $303 billion of targeted imports (12.7%), $127 billion of exports (8.2%), and a $7.2 billion aggregate loss. He is speaking more than two years after the events the paper analyses, and presumably describing the later, larger tariff set — 2018 and 2019 together — rather than the 2018 waves the paper estimates on; the same presumably goes for the loss figure. It is not a correction to the paper, and it should not be read as one. What does survive intact into his framing is the mechanism and the $51 billion: “the U.S. consumer is really taking it on the chin,” which is exactly what column (3) says. He also asserts that employment did not rise in the protected sectors, which is a real finding, but from other work, not this paper. Worth keeping the two sets of numbers apart.
His most useful contribution is the thing he says he has not quantified. Asked for the big takeaway, he calls the tariffs a self-inflicted wound, then adds that the part he worries about is the goodwill lost among allies, the American handling of the wto, and the durability of the resulting uncertainty: trade partners, he says, “will say well this is likely to last only four years and a new administration would immediately roll it back.” That is the honest bridge to the paper’s own closing caveats — no retail prices, no trade policy uncertainty, no foreign wage adjustment, no long run. Which is a polite way of saying that the $7.2 billion is the cost of the trade war under the assumption that everyone reoptimises freely, nobody worries about what happens next, and the whole thing is over by Tuesday.