Notes on:
Digital Chokepoints
NBER Working Paper
2026
geoeconomics · chokepoints · submarine cables · infrastructure
Paper · PDF · Transcript
Made with AI: Fable 5.1 (reading and writing)
Michael Porcellacchia, Christoph Trebesch and Benjamin Wache; discussed by Chenzi Xu. nber si International Economics and Geopolitics, July 16, 2026 (video 04:33–05:34). Paper: July 2026 draft, conference.nber.org.
The cloud is a garden hose on the seabed
The internet has a reputation for being placeless, and the reputation is wrong in a specific, mappable way. Almost all intercontinental data — cloud, ai, finance, the Wikipedia page a person in Taipei opens on their phone (served, Porcellacchia mentioned in the Q&A, from Singapore) — travels through about five hundred physical fiber-optic cables lying on the ocean floor. A single modern cable carries more than 500 terabits per second, which the paper notes is more than the combined capacity of all seven thousand SpaceX satellites in orbit as of 2025, so satellites are not a substitute for cables; they are a rounding error with good coverage. Individual countries are connected by far fewer than five hundred: South Korea by ten, Taiwan by fourteen, Japan by twenty-eight, Britain by sixty. A fishing boat dragging an anchor can cut one. There are about seventy ships in the world that can repair one, about twenty of which specialize in it, and none of which are going to sail into an active war zone. Chenzi Xu’s summary, in her discussion, was that everything we do runs through little garden hoses under the sea, and that is about right; the paper itself says a cable has the diameter of a garden hose.
The geoeconomics literature has a word for a node in a network where one party is highly dependent, another party has control, and there is little substitutability: a chokepoint. Submarine cables are the most literal chokepoint anyone has yet written down, because the chokepoints are also chokepoints in the ordinary nautical sense — Suez, Malacca, Gibraltar, the English Channel, the continental shelf off New Jersey and Virginia. Data, it turns out, goes where ships go, for the same reason ships go there, and the same navies are parked nearby.
What they built
Three things. First, GlobeTel, a dataset of every international submarine telecommunications cable since the first one under the Channel in 1850 — telegraph, telephone, fiber — plus every satellite ever launched, with geography, ownership, capacity and technical characteristics. Bolted onto it is an archive of what the paper calls “digital blockades” — sanctions and exclusion, espionage, cable cutting, from the American Civil War to the Baltic incidents of 2024 and 2025 — which the talk, less formally, called digital coercion events. Second, a model. Connectivity enters production as an intermediate input; firms draw on knowledge from dispersed sources and the cost of reaching a source is the latency of the route. Latency is not a parameter but an equilibrium object: competitive carriers route each flow along the cheapest path, traffic congests paths, and demand, routing and delay are solved jointly — a traffic-assignment model borrowed from transportation economics and laid on the seabed. Congestion is the standard Bureau of Public Roads function from highway engineering,
(eq. 4.7 in the draft), where is a link’s free-flow delay and the two shape parameters come out at roughly 0.24 and 2, identified from the fact that latency on a given route rises and falls with the daylight cycle while the hardware stays put. That means a cable cut costs more than the traffic it displaces, because the displaced traffic takes longer routes and congests everyone else. Third, sufficient statistics. The welfare cost of any restriction of the network collapses to
(eqs. 4.11 and 4.13), where is the output elasticity of the data input, the substitutability across knowledge sources, the latency-weighted share of source in country ’s baseline flows and the proportional change in latency the restriction causes. For small shocks this is just times the share-weighted rise in latency, so the headline numbers lean on — the draft’s central value is 0.5, inside a feasible band of 0.31 to 0.59 — much more than on . That is what makes the counterfactuals computable, and it is also where the Q&A went looking for trouble.
Estimating all this means reconstructing the physical internet — the cable routes on the ocean floor, the terrestrial backbone, cable-level traffic, equilibrium routing — from 2023 data on geography, ownership, capacity, bathymetry and bilateral traffic. Two kinds of checks follow, and the paper is careful to keep them apart. The reconstruction is checked against declared cable lengths (the median fitted-to-declared ratio across 604 systems is 1.03) and measured latencies (an R-squared of 0.90 across some eighteen thousand country-pair-years). The fitted model is then confronted with three things it was not tuned to: traceroutes, which see the cables the model says a packet should cross far more often than the ones it does not; leased-line price quotes, where latency predicts price per gigabit with an elasticity of about one, which is what the model assumes; and observed lit capacity. Traceroutes also confirm that satellites are used for the first and last mile, not as trunk lines.
The findings, in ascending order of alarm
A note on sourcing before the numbers, because the numbers are where the talk and the paper part ways. Several of the figures on the slides — the twenty percent through the Channel, the 44 percent Taiwan loss, the 3.4 percent global loss — are either printed differently in the July draft or not printed at all. What follows uses the paper’s numbers where it has them and flags the podium’s numbers as the podium’s.
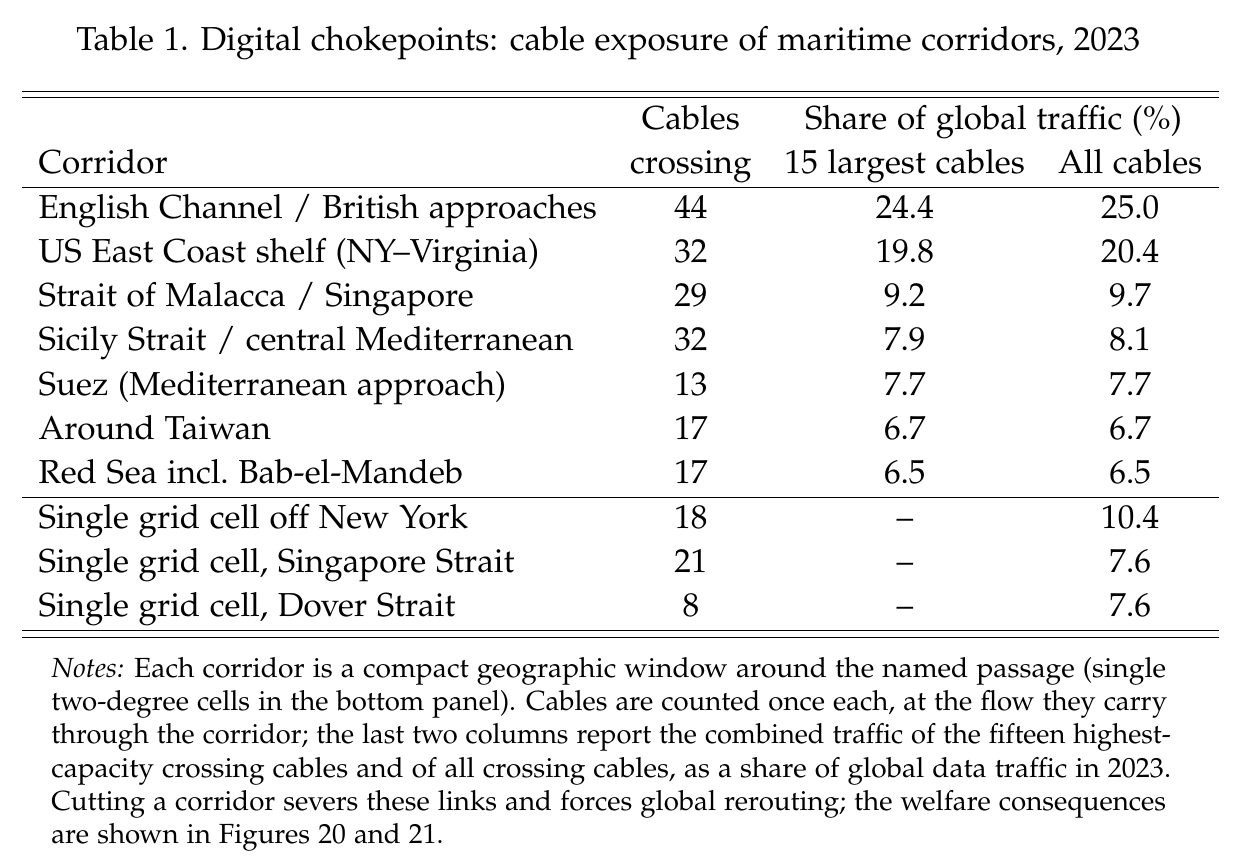
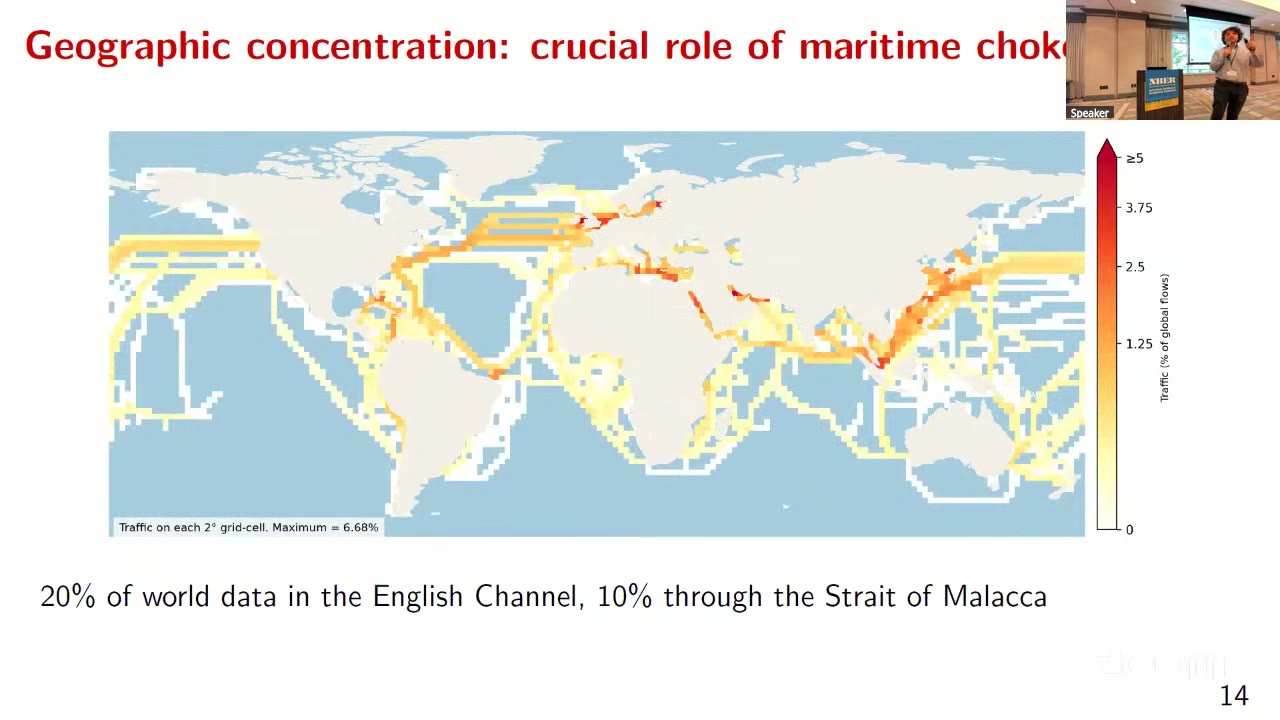
The network is robust to what actually happens. Removing any single cable is close to costless once rerouting is allowed; the paper’s map of welfare losses from single cuts is, in its own words, nearly white, and operators handle individual failures daily. (Porcellacchia’s figure at the podium was about two hundred cable faults a year; the paper itself gives no count, only “frequent”.) The network is not robust to what might happen. The paper’s Table 1 does the counting: forty-four cables cross the English Channel and the British approaches carrying 25 percent of global traffic, and the fifteen largest of them carry 24.4; thirty-two cables on the U.S. East Coast shelf between New York and Virginia carry 20 percent; Malacca and Singapore take 9.7 on twenty-nine. That is the source of the abstract’s line that severing fifteen cables in the Channel or off the East Coast disrupts twenty to twenty-five percent of global data flows. The slide said twenty percent for the Channel and ten for Malacca, and the talk’s other concentration statistic — ten cables carrying a quarter of global traffic — does not appear in the paper at all, whose closest printed figure is that the single busiest cable carries 6 percent. The most exposed two-degree grid cell is the one number on which the draft disagrees with itself: the introduction and the note to Figure 19 put it at 8.2 percent of global traffic, in the Irish Sea, while Table 1 on the next page lists a single cell off New York at 10.4 percent and the text beside it says “10 percent”; the slide’s own map caps out at 6.68. Call it somewhere between seven and ten percent of the world’s data in a square roughly two hundred kilometers on a side, and read the exact figure off whichever page you are on. Unmanned underwater drones make coordinated cuts in such an area, the paper says with some restraint, an increasingly plausible scenario.
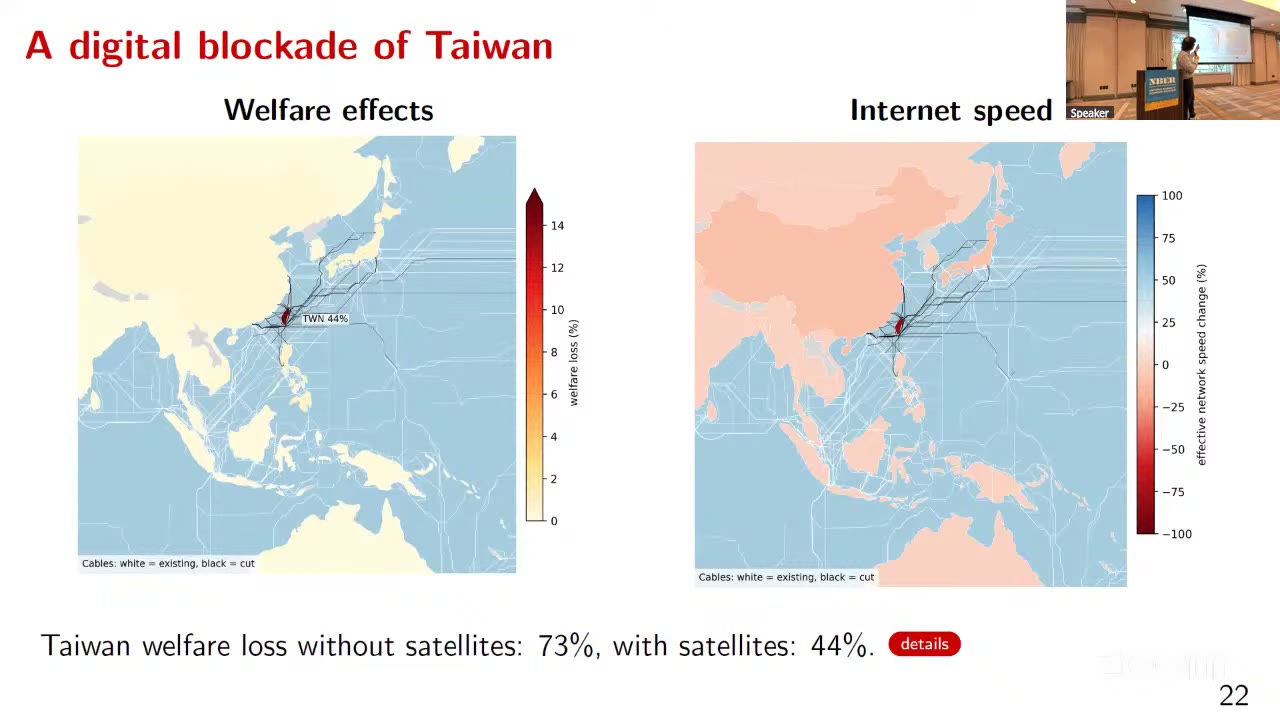
Then the war games. A full digital blockade of Taiwan — all fourteen of its international cables cut, in the spirit of what the United States did to Spain’s Cuba cables in 1898, implemented as every subsea segment in the Strait or within a hundred kilometers of the island, twenty systems in all — barely touches anyone else and devastates Taiwan, which must squeeze its entire external demand into satellite capacity. The paper is precise about how little that is. Taiwan’s actual satellite capacity is about 2 gigabits per second against about 83 terabits on the cables; Starlink does not serve Taiwan as of mid-2026, because talks broke down over a rule requiring a local majority-owned joint venture, which SpaceX refused (the talk, a couple of months earlier, still had them negotiating); and even with Starlink, only a handful of satellites pass over an island that size at any moment, a few hundred gigabits at most, under one percent of cable capacity. So the simulation assumes Starlink access anyway and lets satellites carry one percent of pre-sabotage traffic, “a generous upper bound”, and still finds the island going almost entirely dark. How dark, the draft does not say in a number: Figure 24’s note reports only that Taiwan’s loss “exceeds 2.2” on a color scale capped at 0.6, with the units left unstated. The number everyone remembers from the session — a 44 percent welfare loss for Taiwan, 73 percent without satellites — is on slide 22, and the seven percent of baseline traffic that Porcellacchia said satellites carry in that exercise is the talk’s figure, not the draft’s one percent. It is a welfare loss on the slide, not gdp, and the two versions of the exercise plainly differ; take the slide as the authors’ latest word and the draft as the one they will have to defend in print.
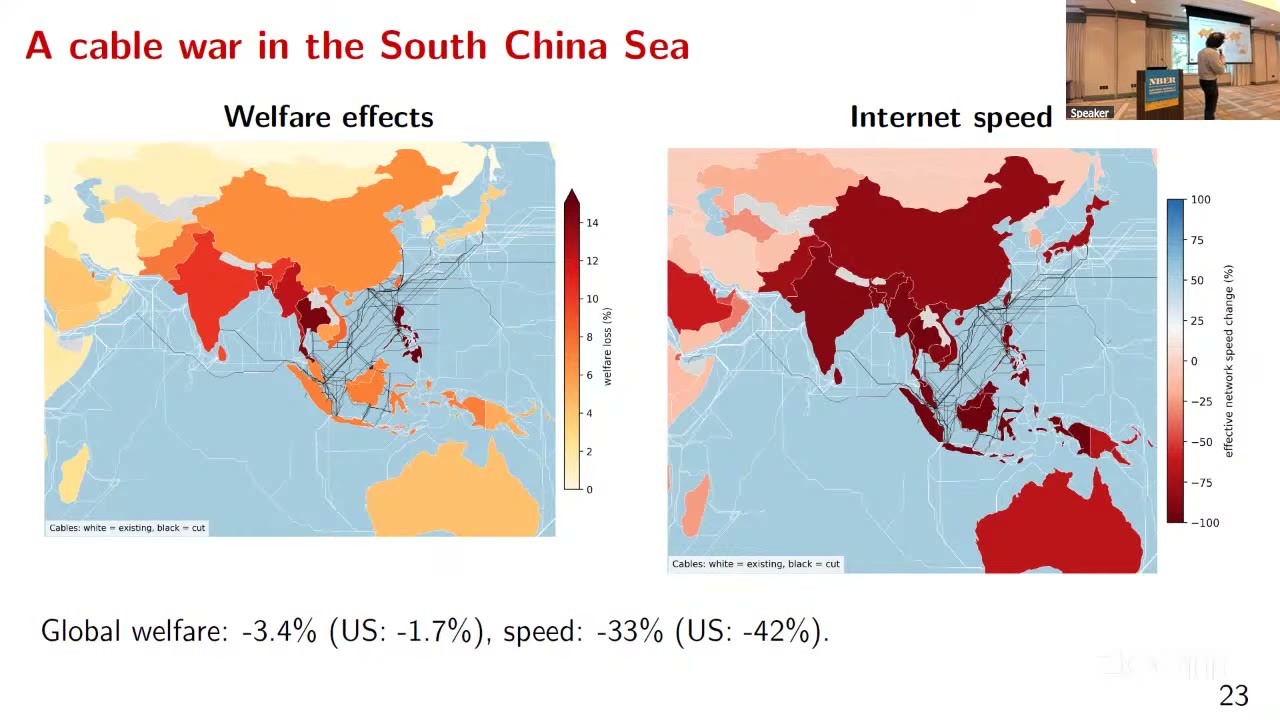
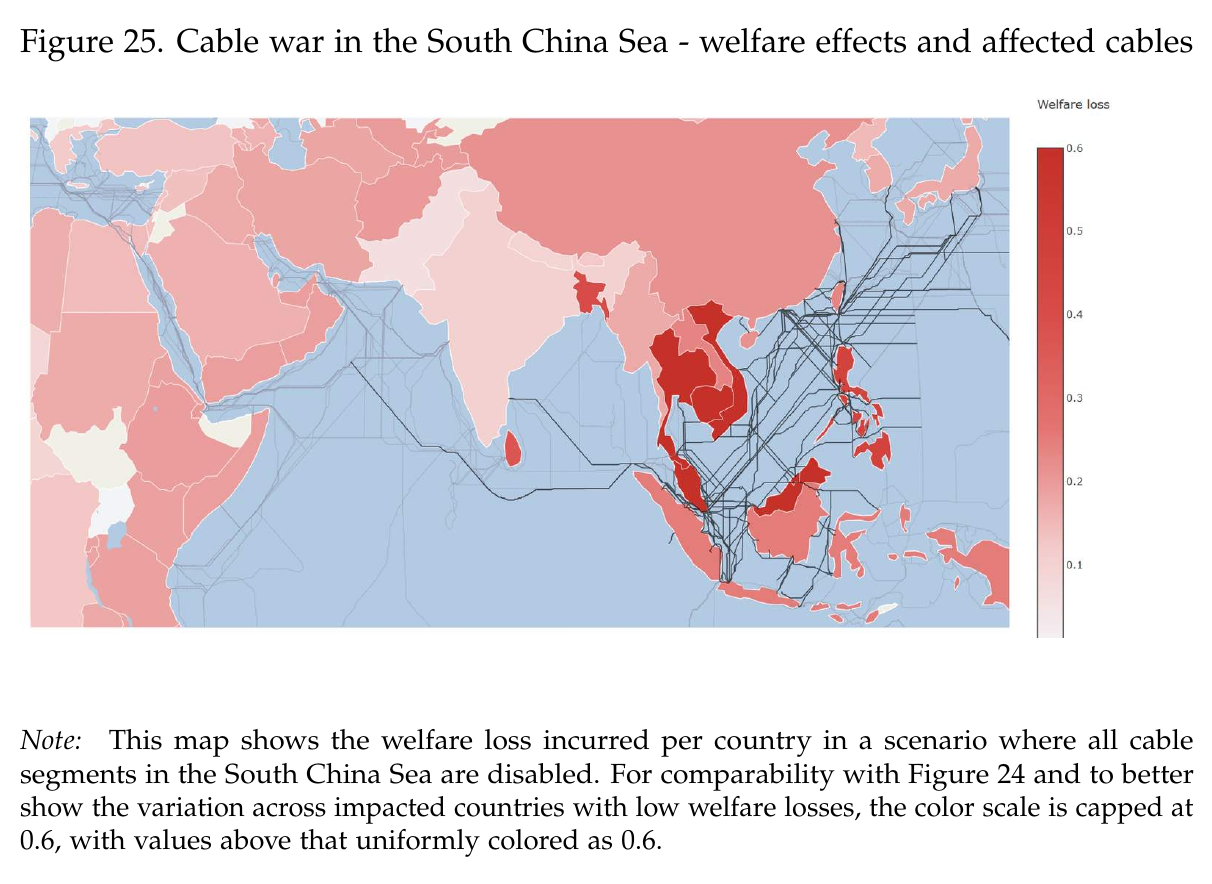
A broader South China Sea cable-cutting scenario is the one with global consequences. The paper damages 82 systems and 209 segments and reports, in words, that losses are large across the neighboring region and spill over to Africa and the Near East, which rely on the corridor; it prints no country or global figures. The slide does: global welfare down 3.4 percent, the United States down 1.7, effective speed down a third worldwide and 42 percent in the United States. Porcellacchia named Myanmar, India and the Philippines as losing ten to fifteen percent of welfare, much of it from congestion as displaced traffic piles onto everyone else’s routes. One caution on India. The slide’s map does color it dark. The paper’s Figure 25 does not: there India is among the palest countries in the region, and the darkest are Myanmar, Thailand, Vietnam, Cambodia, Bangladesh, the Philippines, Malaysia and Sri Lanka. So India’s place among the worst hit is a claim of the talk, not the draft, and the ordering is evidently still moving between versions.
The magnitudes drew the obvious challenge. A questioner — the tape is garbled through most of the question — pressed on the output elasticity of the data input, the that multiplies everything. Porcellacchia’s answer survives intact: they are “probably being a bit exaggerated” on it, the estimate does come from an exercise rather than a choice, 0.5 is at the upper bound, the lower bound of what they have started doing is about a quarter, and even that implies very large losses, in line with what he had shown. Note that a quarter is a podium number; the draft’s own band is 0.31 to 0.59, with the headline at 0.5 and the appendix estimates running 0.52 to 0.69. Take the magnitudes as provisional and the ordering as the point.
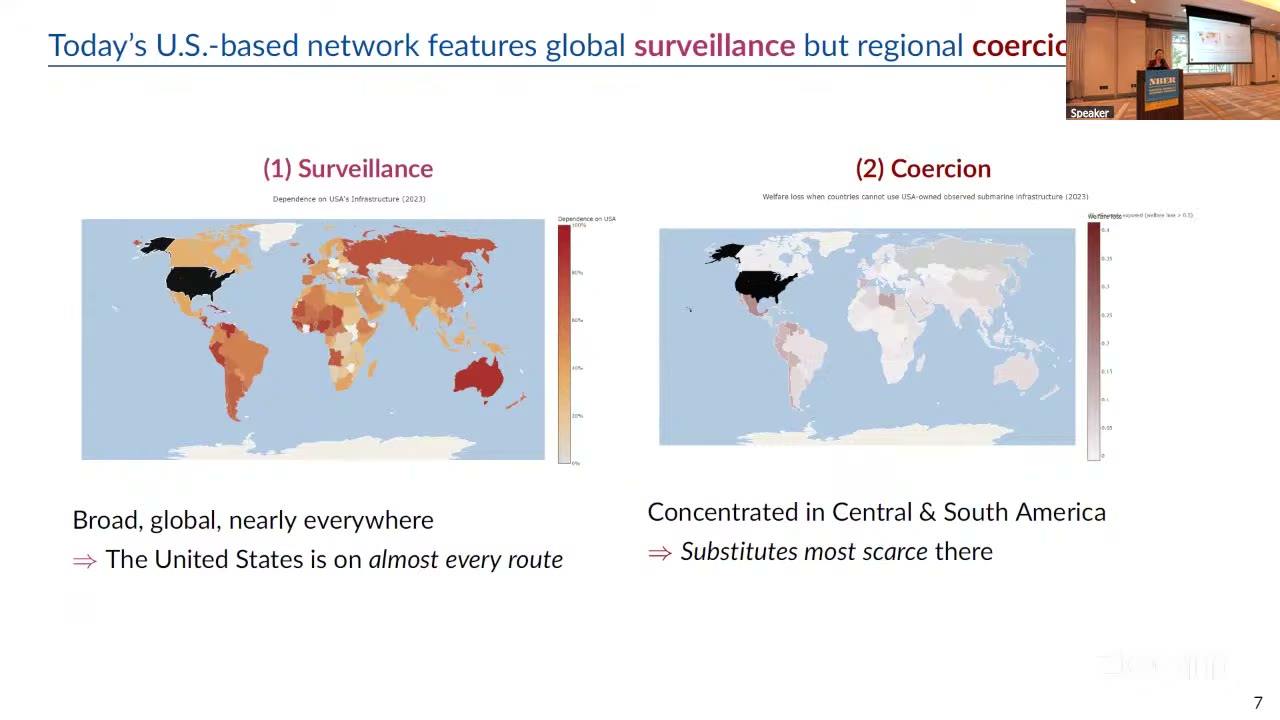
The third finding is about who owns the hose. Hegemons have always dominated this network: the British Empire from the 1860s — by 1900, the paper estimates, 65 percent of telegraph messages ran on British-controlled cables — and the United States after 1945 and decisively after fiber in the 1980s. Because hegemons act as backbone providers, their reach exceeds their ownership share: roughly seventy percent of global data flows today traverse at least one U.S.-owned cable somewhere along the route, up from under twenty percent in the early 1990s, against twenty to thirty percent for China. (In satellites, Porcellacchia said the United States is “essentially a monopoly”; the paper’s wording is dominance, with the American share rising again through the 2010s.) Xu’s discussion drew out the two distinct things this dominance buys, which the paper measures separately and which are less correlated than you would think. Surveillance exposure is the share of your data that crosses the hegemon’s cables — a least-cost-path concept, and a very dark map, because American cables are everywhere; the paper itself says this share is “primarily a measure of exposure to surveillance”. Coercion exposure is what it would cost you to be thrown off those cables — a substitutability concept, computed by running the embargo through the full model. Australia scores high on the first and low on the second, because the South Pacific has alternatives; Central and South America score high on both, because it does not. A simulated U.S. cable embargo hurts Latin America most, and China’s own leverage over its neighbors is smaller, because its network position is less central and its targets have options. Porcellacchia added from the podium — this is not in the draft’s embargo section — that China itself shows up as “quite dependent on the us”, ten years of Chinese cable investment notwithstanding. Surveillance is global; coercion is regional.
Why the history is not decoration
The modern network grew up in an unusually calm thirty years, so post-1990 data say little about what rivalry does to it, and the paper uses the telegraph era as the missing variation. Britain weaponized its network in the 1890s — denying France the line during the Fashoda crisis of 1898, censoring everything south of Aden during the Boer War from 1899 — and cut Germany’s overseas cables in August 1914, leaving Germany largely cut off from intercontinental communication for the entire war. Xu’s narrative made the mechanism vivid: Germany, told by Britain that it could not depend on British cables, built its own network, but built it along the same least-cost corridors where British cables already lay, so that when war came the German cables were cut, German traffic was diverted onto networks where it could be read, and one of the things read was the Zimmermann telegram, which helped bring the United States into the war. Decoupling on the cheap bought Germany ownership without resilience. Corridor-level regressions over the full 1850–2025 panel find that cable building rises significantly in periods of geopolitical tension — about six percent more new cable per additional worldwide militarized dispute, on the paper’s count — most of all among countries on bad terms with the hegemon, and a new dataset of projects planned to 2035 shows several of the largest systems (Echo, Bifrost, Apricot around the South China Sea; Blue-Raman around Egypt; Meta’s Waterworth; an Arctic line to Japan) being routed at greater length and cost around contested chokepoints and rival waters. Xu’s reading is that this is the tell: if all you feared was being thrown off the network, one good alternative path would do; the willingness to pay for longer, worse routes reveals that what countries are buying is protection against sabotage and against being read, which requires the hegemon to be absent from every segment, not just the cheapest one.
The Q&A, which was mostly “how does the internet work”
Whoever opened the floor — the session chair, it seems — confessed to a hundred questions that reduced to that one, and the room obliged. Who decides routing, and can a country choose to avoid a rival’s cables? Routing is automatic, via bgp tables, with less human control than one imagines — but revealed preferences exist; there is a Beijing–Europe cable through Russia that European isps simply do not use, and the authors have country-level traceroute data that could in principle recover such aversions. Isn’t data traffic just a shadow of goods trade, so that a cable cut mostly re-prices something that would happen anyway? The first version of the model did treat data as reducing iceberg trade costs, Porcellacchia said, and he added that in their gravity work geographic distance stops mattering once network distance is in. Treat that as a remark from the floor rather than a result: the draft’s appendix leaves distance out of the gravity regression on purpose, because free-flow latency is nearly proportional to distance and the two would fight over the same variation. Isn’t most of it Netflix? Less than you think internationally, since streaming services keep local servers, and the production function’s curvature already values the millionth terabyte much less than the first; the military could compress in wartime, but the average person in Taiwan opening their phone cannot. Can’t you just repair the cable? Seventy ships, and not in the Strait of Hormuz. A question about whether a country might ever cut a cable on purely economic grounds survives only in fragments on the tape and got no answer, which is a pity, because it sounded like a good one. And a historian’s footnote: Britain cut Germany’s cables in 1914 partly to own the narrative out of Belgium, and a China that cut Taiwan’s cables would own the video feed — an unmodeled cost the authors accepted, and the reason, Porcellacchia noted, you might want to keep sending cat videos during a war.
The paper’s two halves — the physics of corridors and the politics of hegemons — felt, by the authors’ own admission, like two papers, and the discussion took the half the talk had skipped. But they rhyme. The network is efficient because it follows geography, geography concentrates it in a few straits and shelves, concentration hands control to whoever builds the most cable there, and everyone else’s choices are then to be read, to be cut off, or to pay extra for the long way around. The cloud, in other words, has a coastline.