Notes on:
Understanding the International Rise and Fall of Inflation Since 2020
Journal of Monetary Economics
2024
inflation · energy prices · Phillips curve · monetary policy
doi · PDF
Written by Fable 5
Mai Chi Dao, Pierre-Olivier Gourinchas, Daniel Leigh (imf) and Prachi Mishra (Ashoka University); presented at the nber conference “Inflation in the Covid Era and Beyond,” May 16–17, 2024 (discussant: Susanto Basu), and published in the Journal of Monetary Economics, vol. 148, November 2024. This digest is written from the published version of the article — open access under cc by-nc-nd, with the nber footing the open-access bill — cross-checked against the June 2024 submitted draft (circulated as Ashoka University Discussion Paper 119). No talk video exists.
The great inflation of 2021–2023 was, on inspection, mostly an energy shock wearing a wage-price spiral as a costume. That is the claim of this paper, and the authors — three imf economists, including the Fund’s chief economist, plus Prachi Mishra — earn it the boring, careful way: by running the same accounting exercise for 21 countries and watching the same answer come out almost everywhere.
Start with the accounting identity, because the whole paper lives inside it. Any month’s headline inflation can be split into an underlying, sticky part and a residual, jumpy part:
That is equation (1) of the paper, and it looks trivial until you notice the choice hidden in the word “core.” The authors do not use the familiar ex-food-and-energy measure. They use weighted median inflation — line up all the industries in the cpi basket by their price change, weight them, take the middle one. The logic is that the pandemic threw enormous relative-price shocks at sectors that the traditional core measure politely assumes are calm (used cars, famously), so a measure that strips out whatever is extreme this month beats a measure that strips out the same two categories every month. This is not aesthetic fussiness: when the authors rerun everything with the traditional core measure, the fit of their inflation equation drops from an average R-squared of 45 percent to 18 percent. Half the paper’s explanatory power lives in the definition of core.
With the decomposition in hand, the question splits in two. What drove the headline shocks? And what drove core?
For the shocks, the answer is almost embarrassingly uniform. The authors race ten candidate variables — energy prices, food prices, shipping costs, supply-chain indices, lockdown severity, exchange rates, car prices — against the monthly headline shock, country by country:
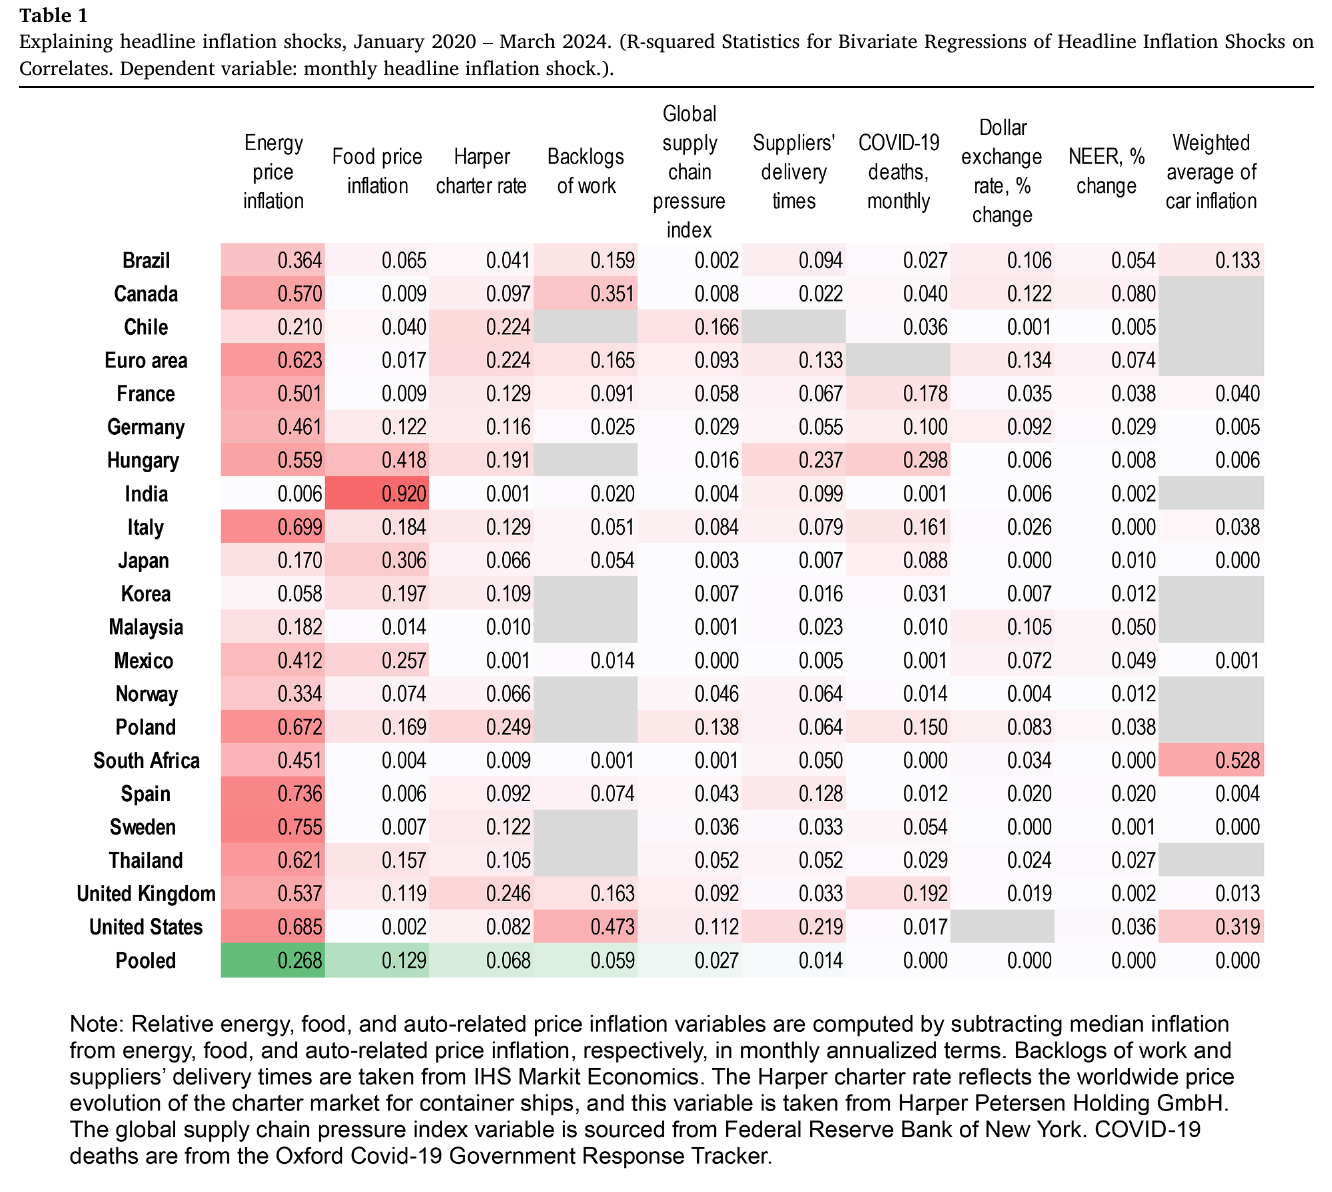
Energy wins in 17 of 21 countries. (India is the charming exception: food price shocks explain 92 percent of its headline shocks and energy essentially nothing, which is what you get when your cpi basket is heavy on food and your government administers fuel prices.) A three-variable regression — relative energy inflation, relative food inflation, and the Harper charter rate for container ships — explains between 21 percent (Malaysia) and 94 percent (India) of headline shocks, country by country.
Core is where the intellectual action is. The authors estimate, for each of fourteen economies with adequate data, a Phillips curve of the form
— equation (2) in the paper — where is monthly annualized weighted-median inflation, is longer-term expected inflation (which core is assumed to track one-for-one), is macroeconomic strength averaged over twelve months (the unemployment gap in most places, the output gap where unemployment data are thin, and the vacancy-to-unemployment ratio V/U for the United States and Canada, whose Beveridge curves shifted during the pandemic), and is the twelve-month average of past headline shocks — the pass-through term. The functions and are allowed to be quadratic or cubic, because one robust finding of the post-2020 literature is that Phillips curves are curves.
The puzzle, and why country plumbing matters. Here is the bit that would have sunk a lazier paper. If energy drove everything, countries with bigger energy shocks should have had bigger core inflation. They didn’t. Across countries, within each episode, the correlation between the change in energy inflation and the change in core inflation is zero — an R-squared of 0.00 in the rise and 0.02 in the fall. Poland had a roughly average energy shock and wildly above-average core inflation. On this evidence alone you would acquit energy and go looking for another culprit.
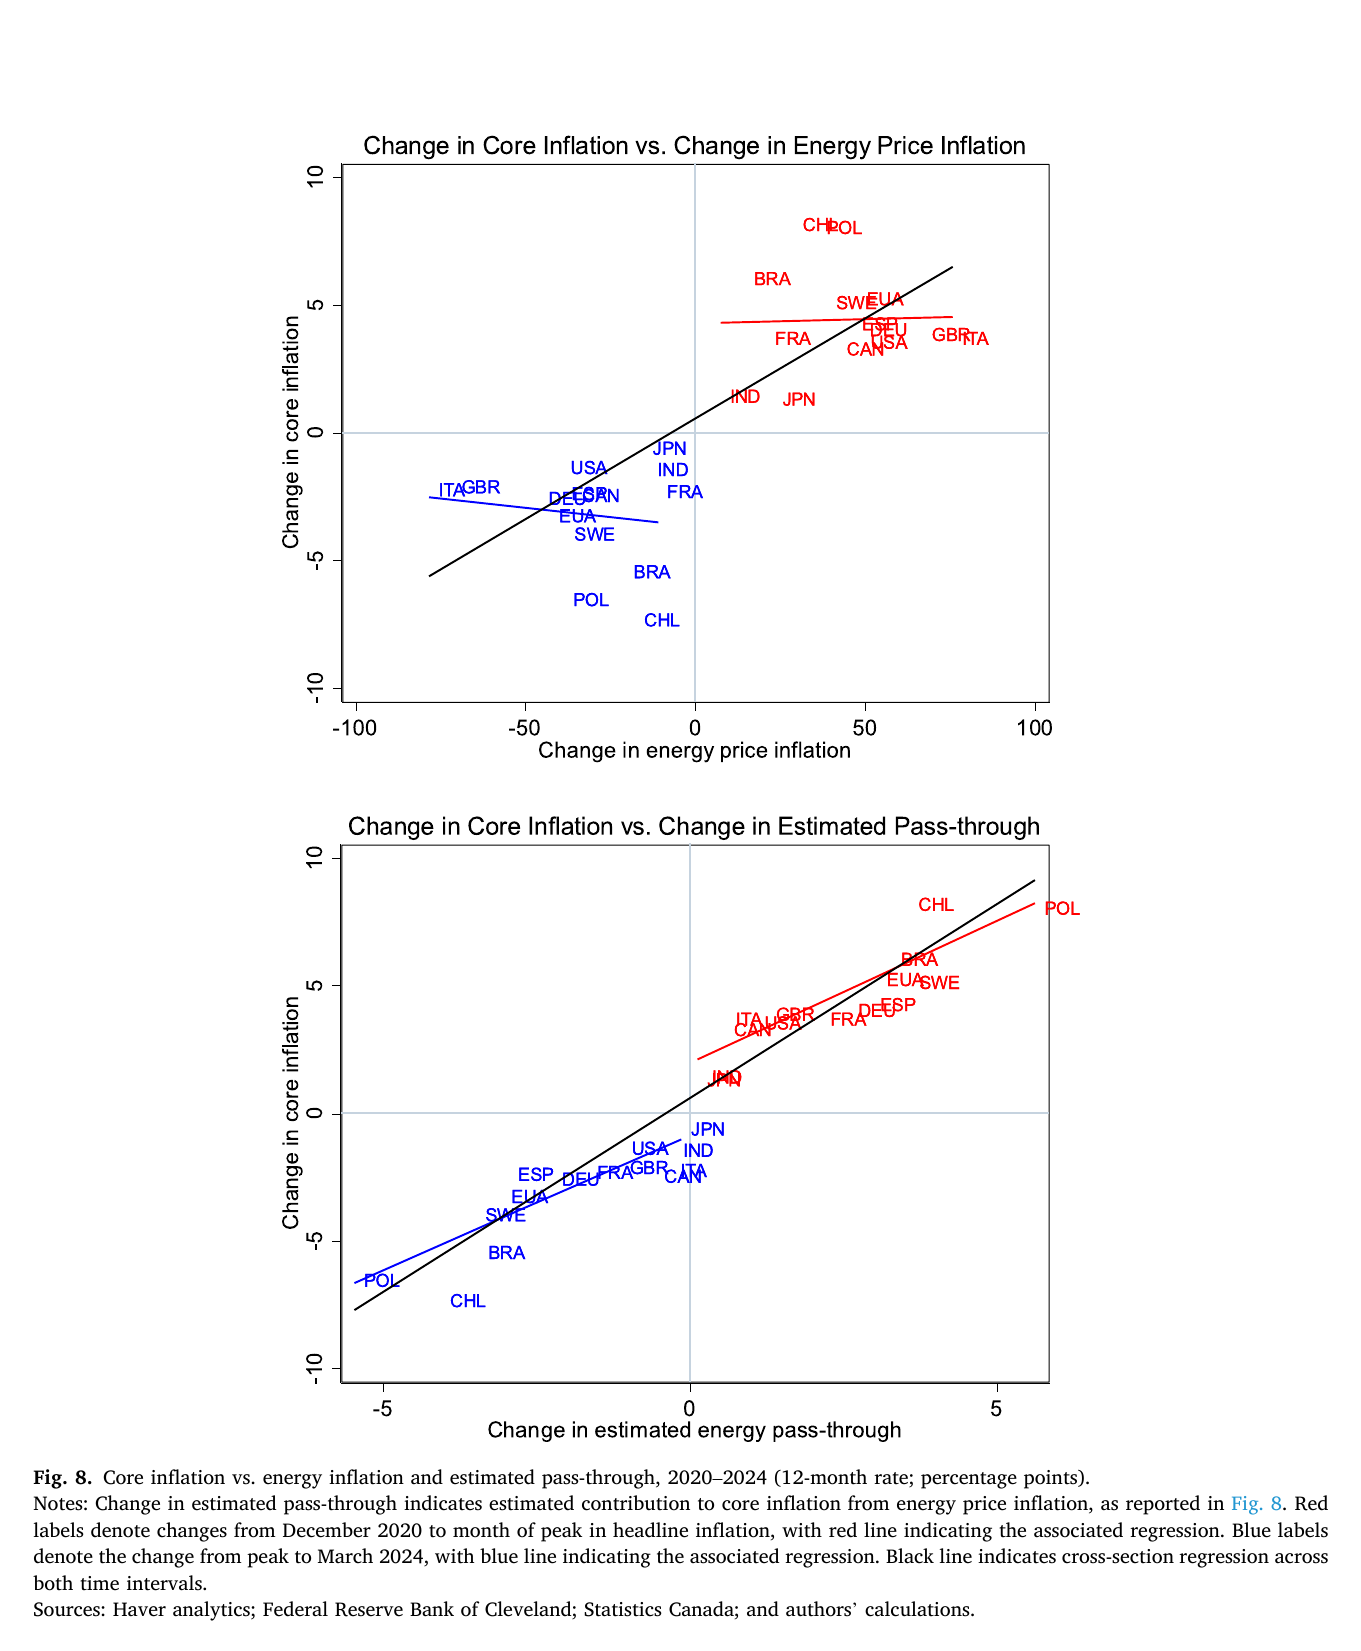
The resolution is that pass-through is not a universal constant; it is national plumbing. Once each country’s shock is filtered through its own estimated pass-through coefficient — how much a euro of energy shock seeps into wages, input costs, and eventually the sticky middle of the price distribution — the fit jumps to an R-squared of 79 percent in the rise and 76 percent in the fall. Poland’s core surge is exactly what Poland’s pass-through predicts. And the cross-country differences in pass-through are themselves partly policy: eu countries that spent more suppressing retail energy prices (France, at about 3 percent of gdp) show smaller energy contributions to their headline shocks than countries that mostly let prices rip (Germany, whose direct energy contribution was nearly three times France’s). A global shock, run through twenty different national gearboxes, produces twenty different inflations — and looks, from a naive scatter plot, like no global shock at all.
The bottom line, and the American asterisk. Putting the two estimated pieces together yields the paper’s headline accounting: energy shocks plus their pass-through explain about 49 percent of the average rise in headline inflation and 62 percent of the fall. Macroeconomic strength — the thing the overheating narrative said this was all about — accounts for less than 9 percent of the rise on average. Long-term inflation expectations barely moved anywhere, which the authors read as central-bank credibility doing quiet, load-bearing work: the reason a 1970s-sized energy shock did not produce a 1970s-length inflation is that nobody’s ten-year expectations budged.
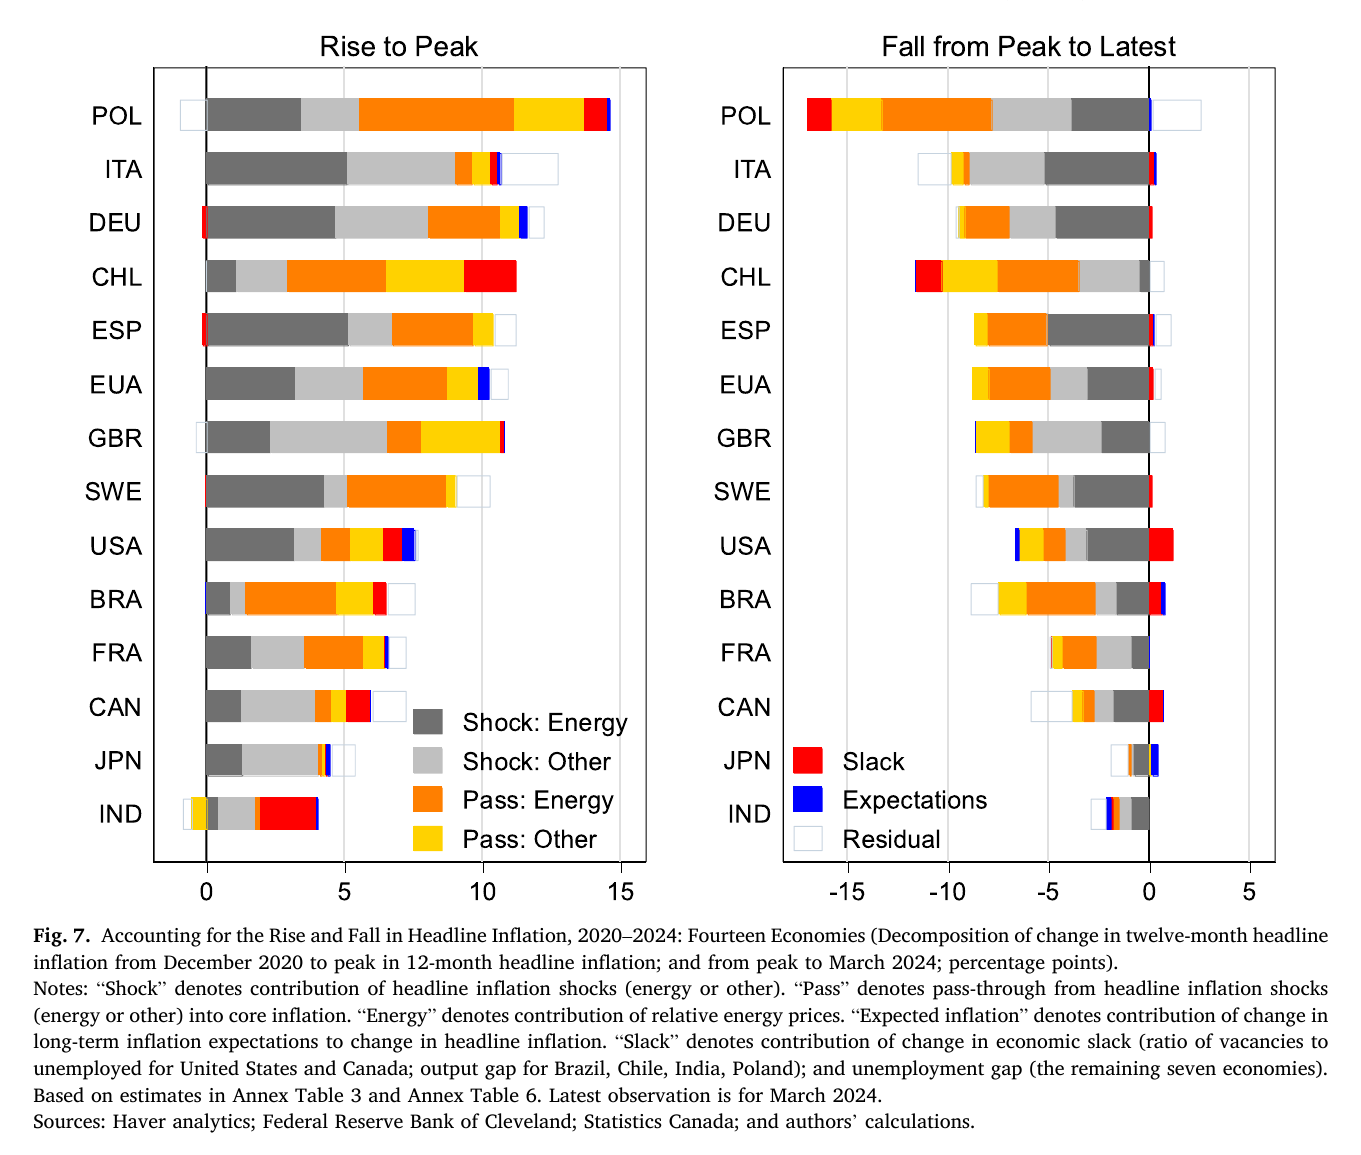
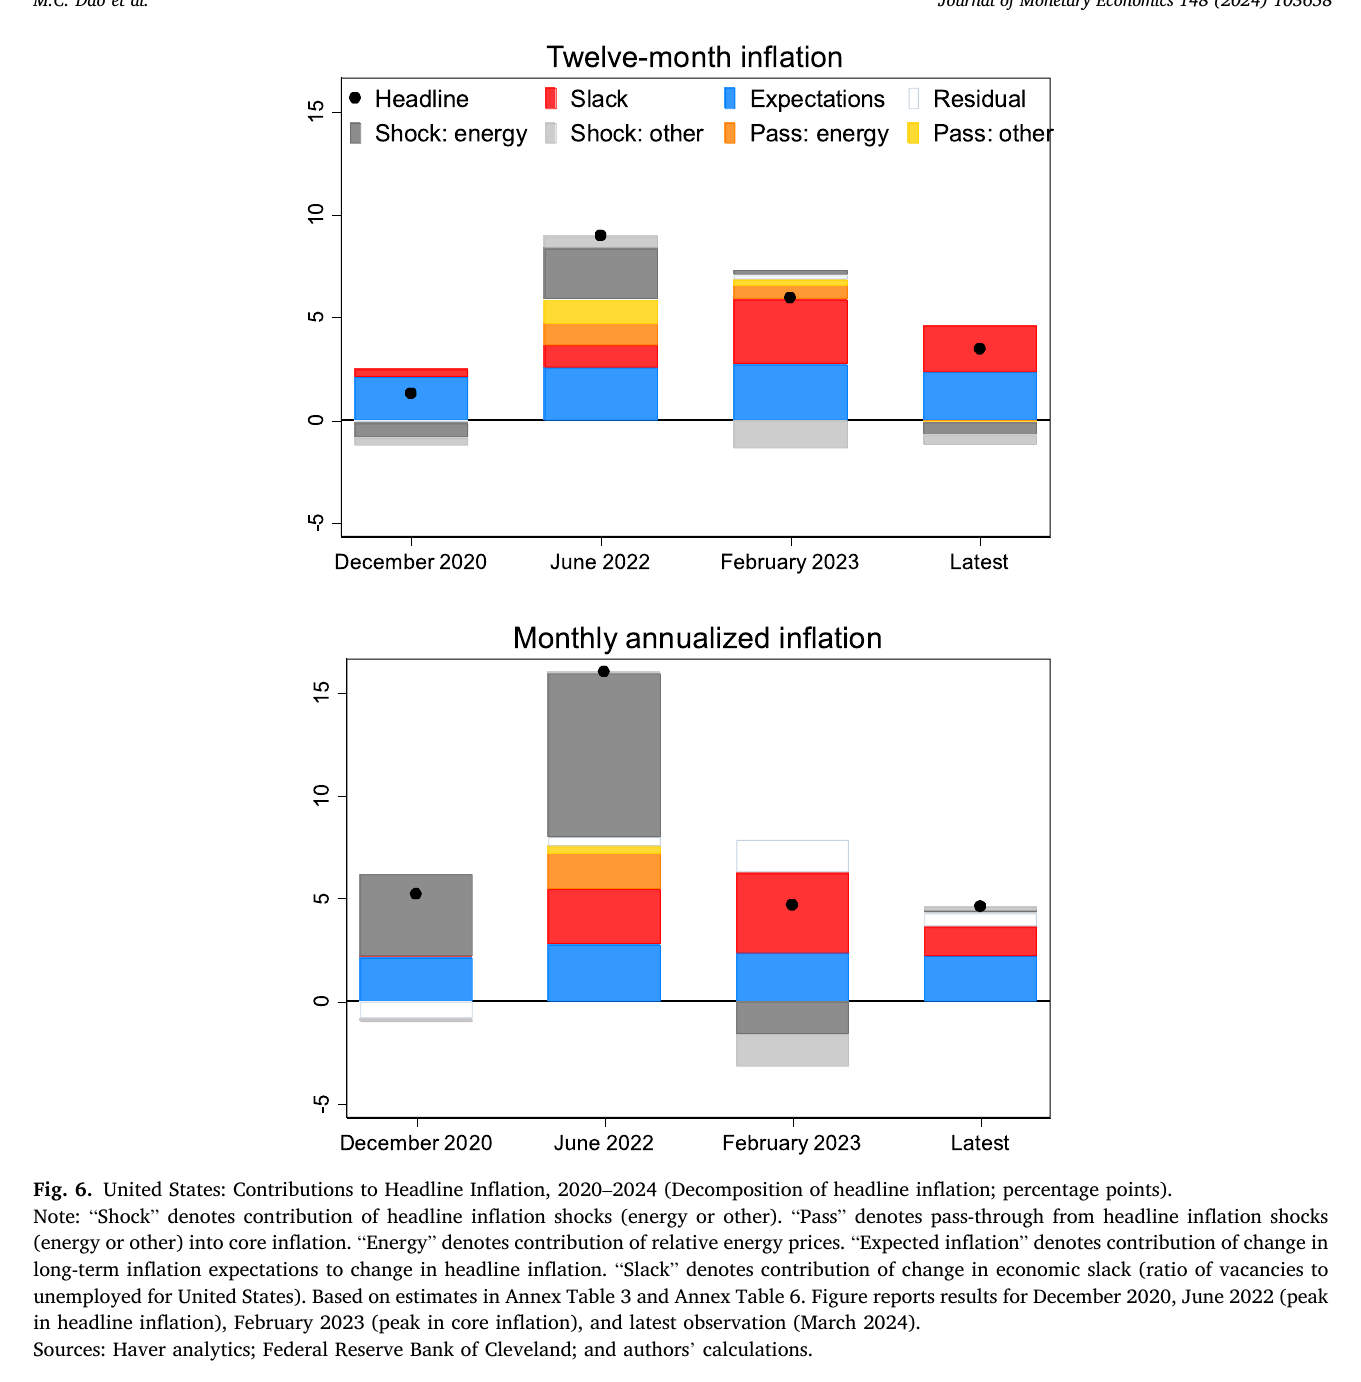
The asterisk is the United States. It is the one country where the red bars are big: strong macro conditions — measured by V/U, since the shifted Beveridge curve makes the unemployment gap a liar for this period — contributed materially to core inflation, and still contributed about 2.3 percentage points as of March 2024. Notably, the V/U term is not just a wage proxy: control for wage growth directly and its slope barely flattens, which the authors read as tightness raising marginal costs through channels beyond pay — hiring costs, capacity constraints, take your pick. The disinflation of 2023 was, in the us, roughly half fading pass-through and half genuine cooling; without the decline in V/U, monthly annualized inflation in March 2024 would have been about 2.5 percentage points higher.
There is also a small, telling edit between versions here. The draft submitted in June 2024 ended its us discussion with a prescription: a further cooling of labor markets, “with either higher unemployment or a fall in vacancies,” appears necessary for inflation to converge to target. The published version, revised that August, deletes the prescription and substitutes an observation: since March 2024, when the sample ends, us labor market conditions “have further moderated, and this should help inflation return to target.” Two months of data turned the necessary into the already-happening, which is the kind of revision every forecaster dreams of making.
This is, deliberately, the same territory Bernanke and Blanchard (2024) mapped for eleven advanced economies with a different model, and the two teams reach what the authors happily call “very much the same conclusions” — shocks, not overheating — with one instructive difference: because this paper lets V/U act on all of core inflation rather than only on wages, it finds a bigger role for us labor-market heat. The two most credentialed post-mortems of the inflation disagree mainly about how hot America was, which is also roughly what the entire discourse disagreed about, so at least the discourse was arguing about the right country.
(A note on the discussion: Susanto Basu (2024) was the discussant at the nber conference, and his published comment appears alongside the paper in the same jme issue. That comment sits behind ScienceDirect’s gates and no recording of the session exists, so this digest cannot report what he pushed on.)
The wry coda writes itself from the authors’ own conclusion. The paper finds that the global inflation was mostly a relative-price shock passing through national plumbing, that expectations stayed anchored because central banks were credible — and that central banks earned that credibility by tightening aggressively against a shock the paper says wasn’t demand. The medicine worked partly as advertised and partly as theater, and the theater was load-bearing.