Notes on:
Collateral Damage: Trade Disruption and the Economic Impact of War
Review of Economics and Statistics 92(1): 102--127
2010
geoeconomics · trade and conflict · war costs · gravity
Paper · PDF
Made with AI: Opus 5 (reading and writing)
Reuven Glick (Federal Reserve Bank of San Francisco) and Alan M. Taylor (uc Davis, nber). The version of record is Review of Economics and Statistics 92(1), February 2010, pp. 102–127, and every page reference below is to it. No talk recording exists; this is a pdf-only digest. The figures and tables reproduced here are crops of the published version.
A cost of war that nobody had put on the bill
Accounts of what a war costs list the dead, the wounded, the destroyed capital and the excess military spending. Glick and Taylor add a line that the accounting had left off: the trade that does not happen, during the war and for a decade after it, between the belligerents, and — the part of the title — between belligerents and countries that were not fighting anyone. The paper’s job is to measure that line with a gravity model on a panel that runs from 1870 to 1997 and to ask whether it is large enough to matter. The answer, for the First World War, is that on the paper’s central calibration the lost trade costs the world twice what the lost human capital does.
Gravity with war dummies, 127 years of it
The data are bilateral trade for up to 172 countries — the imf’s Direction of Trade for 1948 onwards, Barbieri’s (2010) historical series for 1870–1947, with Mitchell used both to fill the gaps among the major trading partners and to correct Barbieri’s errors — Correlates of War (1996) for conflicts, and Maddison (2001) and the Penn World Table (2015) for income. The estimating equation, set out on p. 104 and carrying no equation number, is the standard gravity regression with war dummies bolted on:
Here is average real bilateral trade between countries and in year , is one if the pair were adversaries in a war years earlier and is one if one of them was fighting some third country while the other stayed out, for running from zero to ten, and everything after that is the usual gravity furniture — income, income per head, distance, common language, land border, landlocked and island counts, area, current and former colonial ties, and currency union or, before 1945, the gold standard. The coefficients of interest are for adversary pairs and for belligerent–neutral pairs. The preferred estimates use country-pair fixed effects with year dummies and errors clustered on the pair, so the war coefficients are identified from the within-pair change in trade around a conflict, against the pair’s own peacetime level, and every time-invariant regressor in the list is knocked out. War is rare in this panel — 206 pair-years of contemporaneous fighting out of 251,902, and 0.85 percent of the sample once the lags are counted in — but over 60 percent of the countries were at war at some point, so the rarity is in the pairs rather than in the cast.
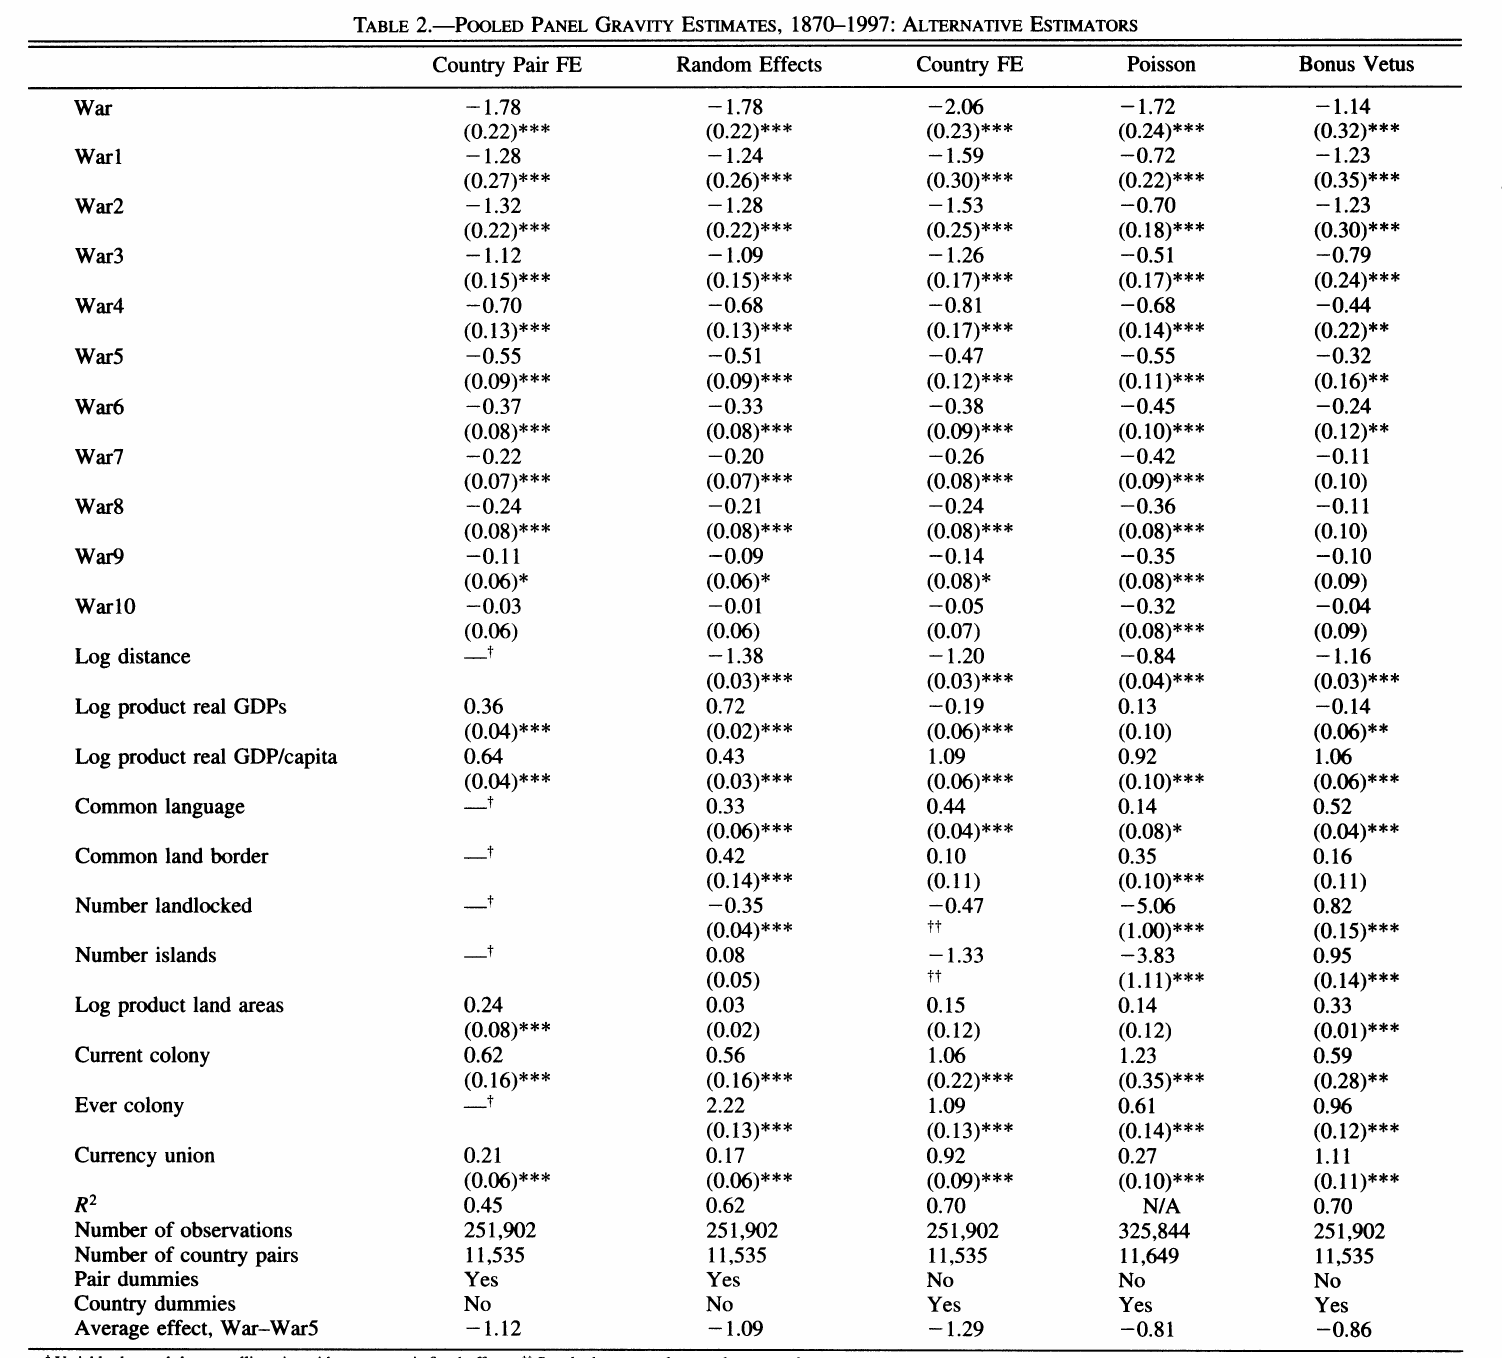
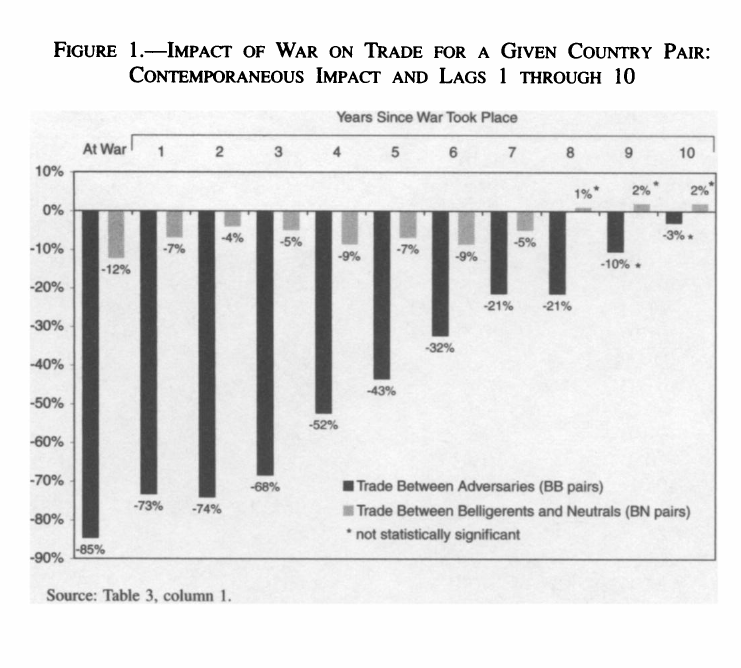
The benchmark contemporaneous coefficient for adversaries, Table 2 column 1 on p. 107, is , which the authors gloss as a fall in trade between the two of over 80 percent. It survives the estimator being changed underneath it: random effects gives the same , country fixed effects , a Poisson quasi-maximum-likelihood fit that keeps the zero observations , and the Baier–Bergstrand (2009) approximation , which is the weakest of the five and still a 70 percent collapse. The effect then decays roughly monotonically: trade is still 42 percent below normal five years after the fighting stops and 21 percent below after eight, and only returns to the gravity norm around year ten. Discounted at 5 percent, the present value of lost trade with lags one through ten added in is about 3.7 times what the contemporaneous year alone would give — the introduction says “three to four times higher” — which is why the title insists on persistence. A calculation that counts only the war years misses roughly three-quarters of the trade cost. The authors are candid that the persistence comes bundled — reconstruction, residual price and quantity controls, diplomatic rupture, the fixed and variable costs of getting a trading relationship going again — and that shorter, lower-intensity conflicts show little of it.
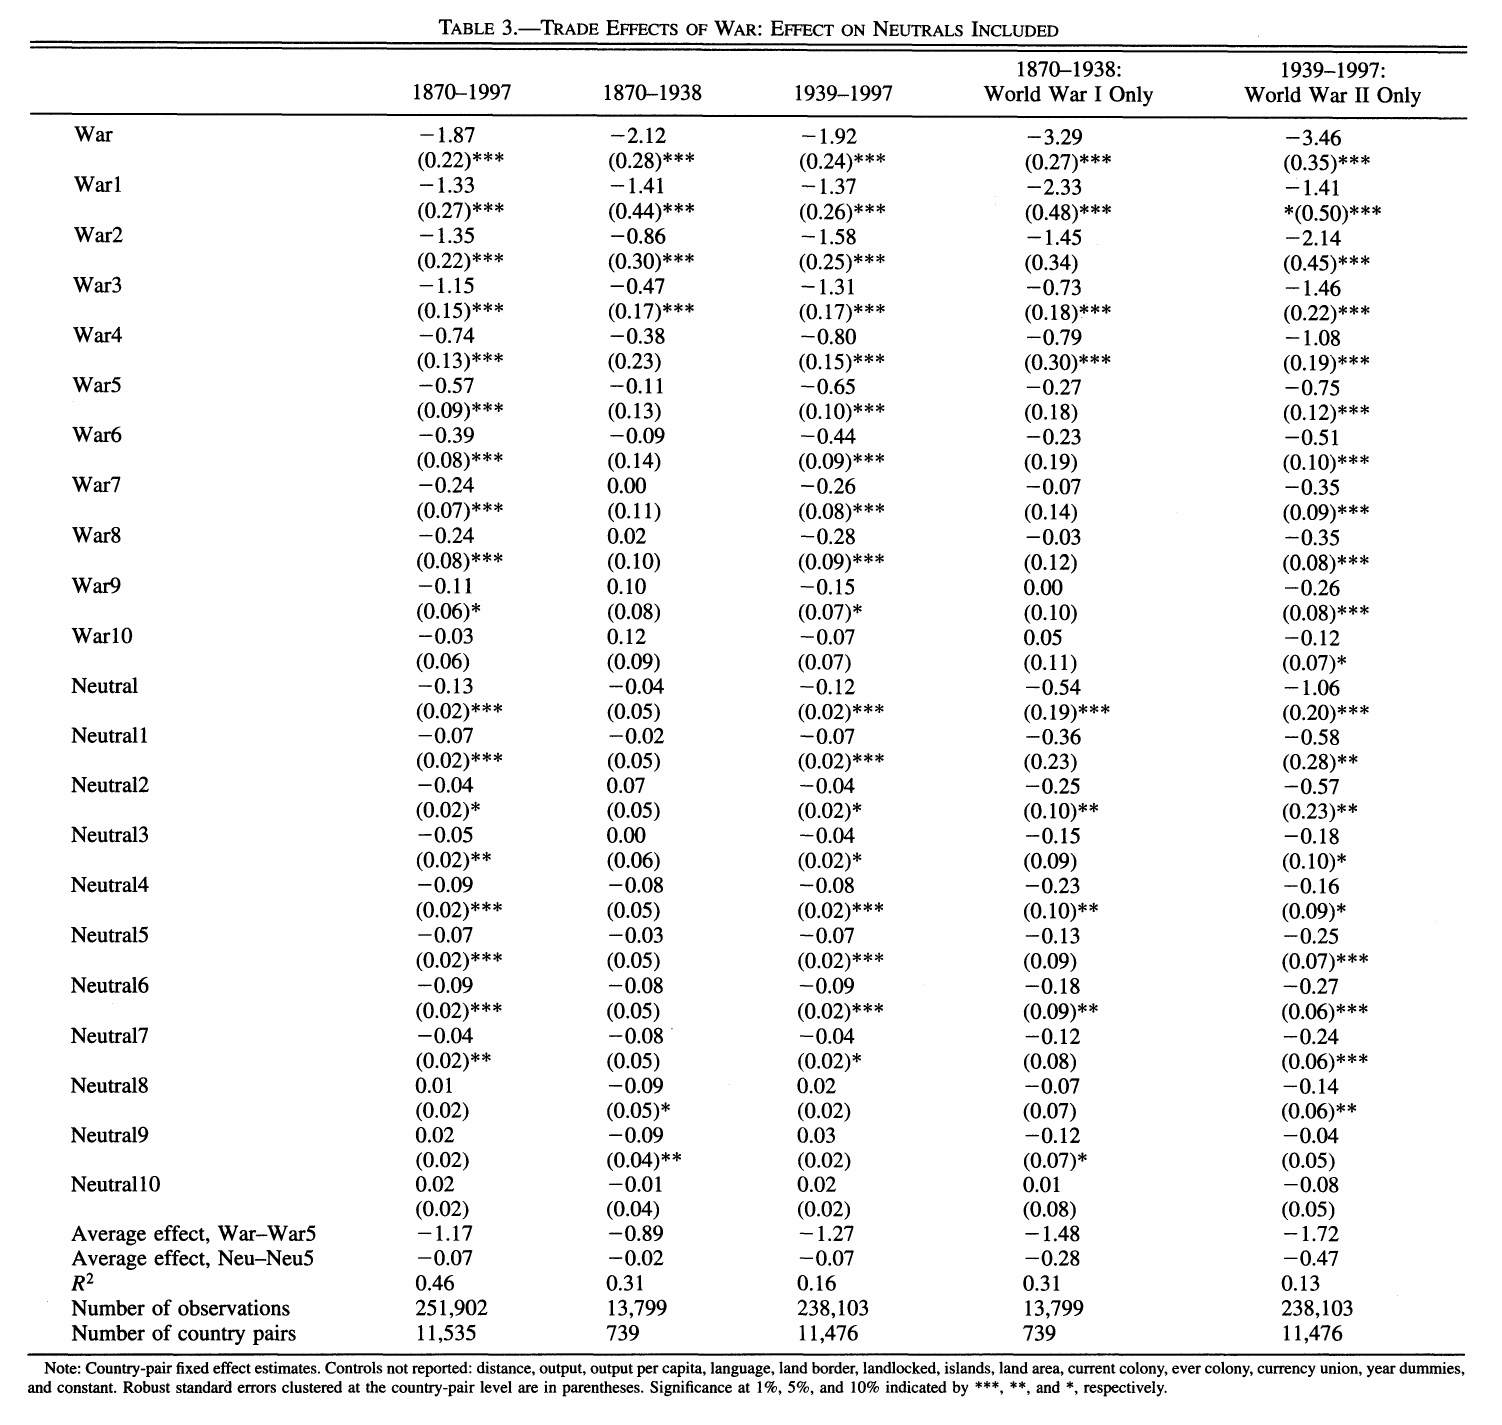
Once the neutral dummies are added, in Table 3 on p. 110, the war coefficient goes to — an 85 percent fall, which is the number the first black bar in Figure 1 is drawing — and the neutral coefficient comes in at , a 12 percent decline in trade between a belligerent and a bystander, with lags that stay significant out to seven years. Run the two world wars on their own and both effects are far larger: the war coefficient is for the First and for the Second, declines of 96 and 97 percent, so that trade between adversaries was to a first approximation annihilated, while the neutral coefficient goes to and , declines of 42 and 65 percent. The paper’s own summary is that war cuts trade between belligerents by 80 to 90 percent and trade with neutrals by 5 to 12 percent on average, enlarged to 42 to 65 percent in the major wars, with both effects decaying slowly over about a decade.
Reverse causality, checked and dismissed for this purpose
Because the political-science literature has spent decades on whether trade prevents war, the paper also runs the war equation the other way: a logit of conflict on lagged trade dependence, contiguity, alliances, major-power status, years of peace and log distance. In the pooled logit trade dependence lowers the risk of war, as the liberal tradition says; with country-pair fixed effects the effect collapses to nothing, and adding democratisation and relative military capability does not revive it. Whatever trade does to the probability of war, it does it across pairs rather than over time within a pair — the authors’ own formulation is that trade helps answer which countries fight, not when they fight. A panel instrumental-variables version of the gravity regression points the same way: instrumenting the contemporaneous war dummy moves the coefficient a little further from zero rather than toward it, and a Hausman test finds no systematic difference, so for the purpose at hand — estimating what war does to trade — the feedback is too small to bias the gravity coefficients. (This is the empirical fact that Martin–Mayer–Thoenig’s (2008) within-pair estimates and instrumenting strategy are designed to confront; read side by side, the two papers disagree about what a pair fixed effect is allowed to absorb.)
Pricing the lost trade
To turn trade losses into welfare, the paper uses the Frankel–Romer (1999) elasticity of income with respect to the trade share, , and runs the counterfactual of no war barriers through the gravity model in general equilibrium, with the multilateral resistance terms adjusting and the elasticity of substitution calibrated at five, for each world war. Losses are discounted at 5 percent. Human costs are valued in the same units, Goldin–Lewis (1975) style, by pricing a death at the prevailing average real wage and a wounding at half of it and converting the result into a permanent flow of lost output.
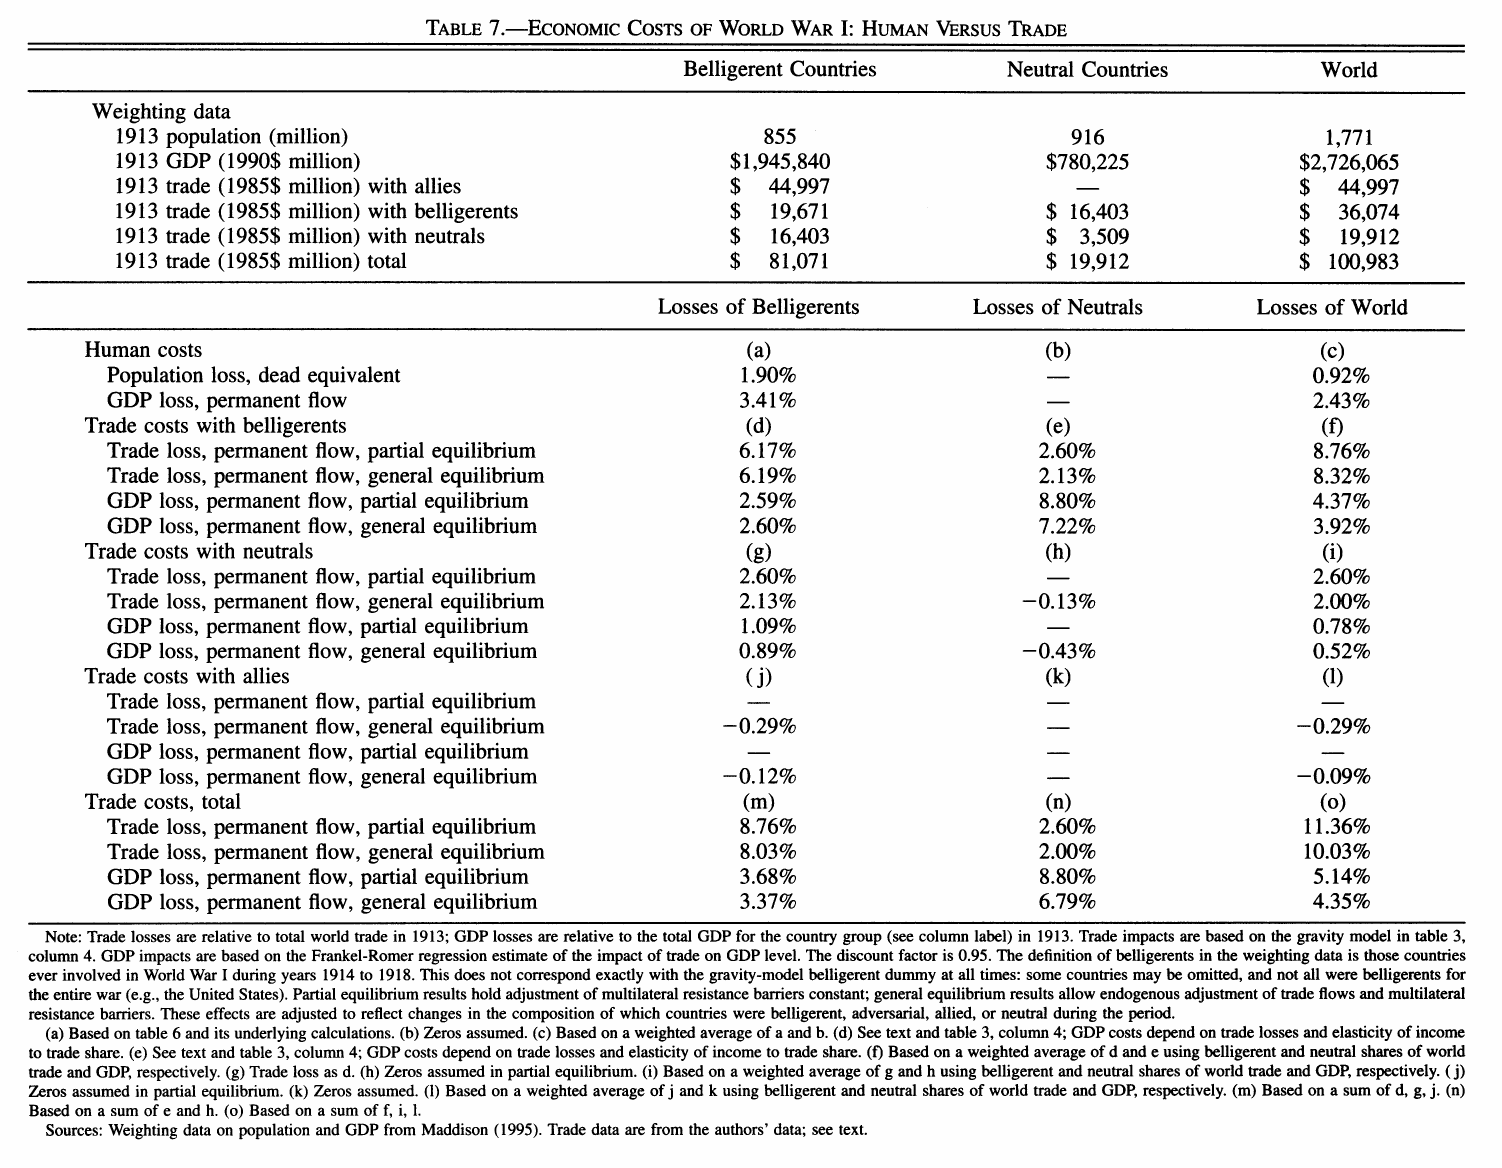
For World War I, in Table 7 on p. 120, the permanent flow cost of lost trade is 3.37 percent of the belligerents’ own gdp and 6.79 percent of the neutrals’, for a world total of 4.35 percent of gdp, against 2.43 percent for the human cost on the same metric. The belligerents’ figure decomposes into 2.60 percent lost on trade with adversaries and a further 0.89 percent on trade with neutrals, offset by a 0.12 percent gain on trade with allies. Set that against Bogart’s (1920) reckoning, quoted on p. 124: direct costs, meaning the excess government spending, of $186 billion in 1913 prices, and indirect costs excluding lost human capital of $84 billion, to which the paper’s own trade-related costs add a stock value of $177 billion and its human costs $99 billion, for a grand total of $546 billion. Trade-related costs are 32 percent of that reckoned total, which is another way of saying that including lost trade augments the standard measures of what the war cost by almost 50 percent.
The bystanders lose more than the combatants
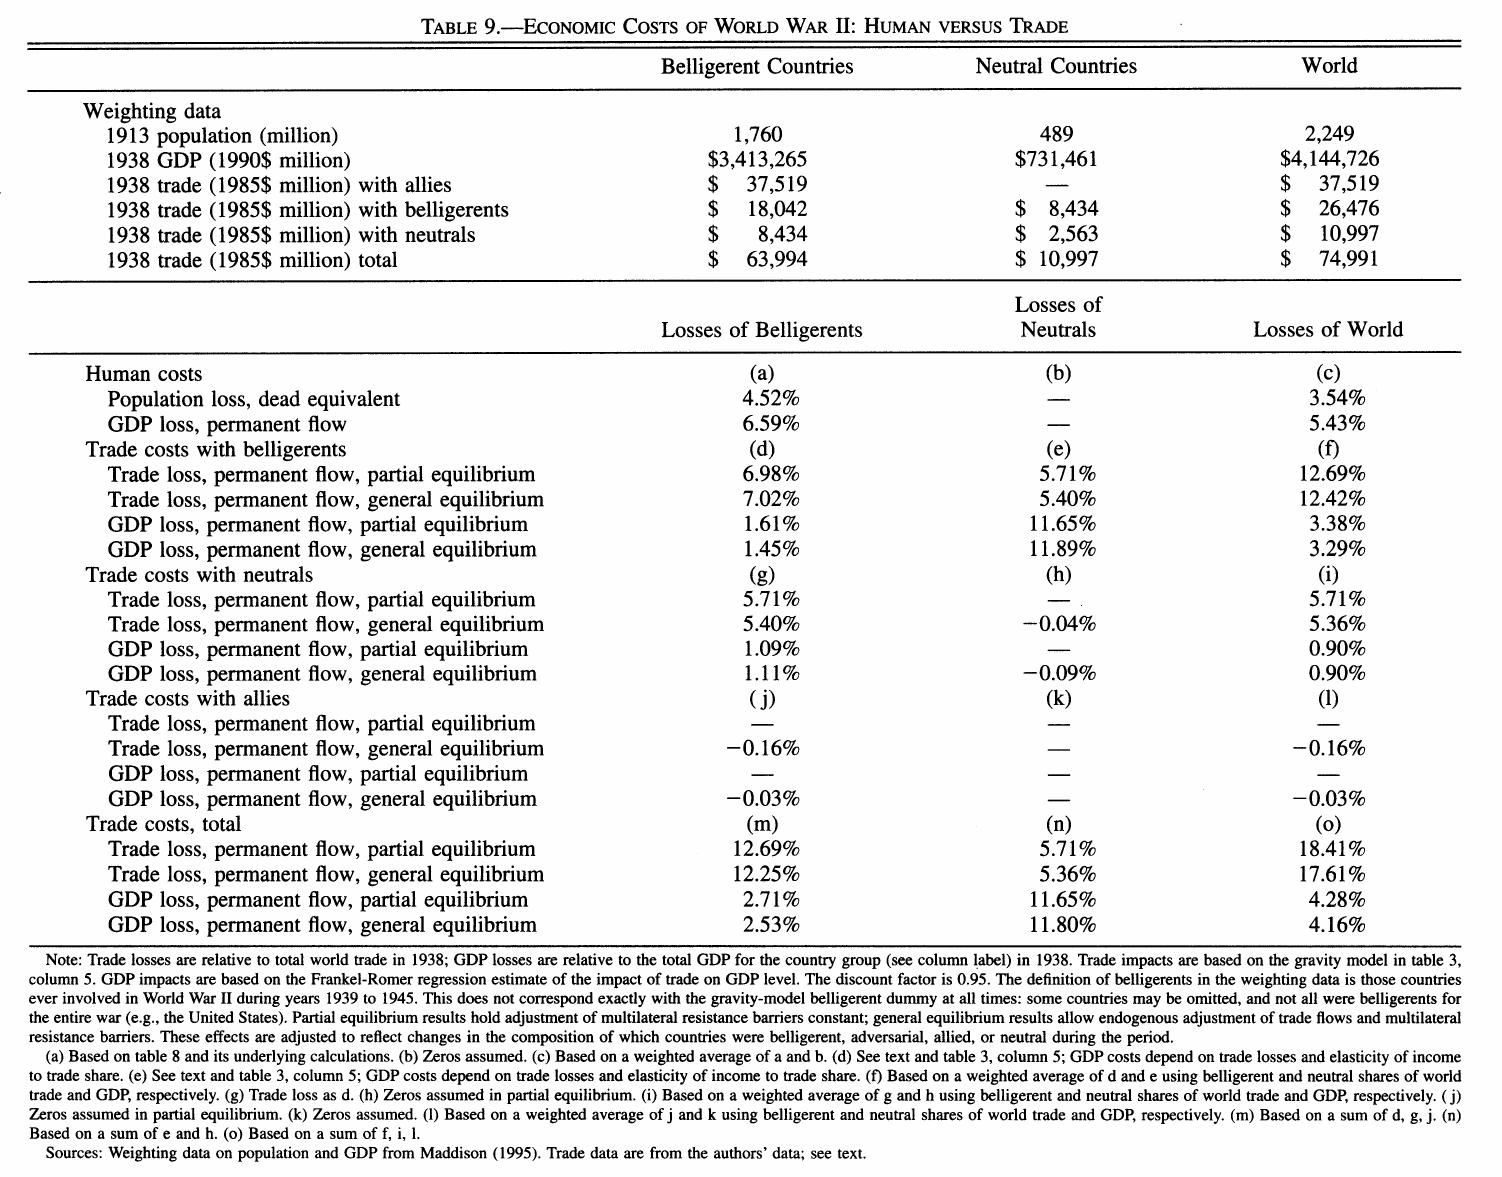
The single most surprising number in the paper is one it makes no fuss about. In World War I the trade-destruction cost is 6.79 percent of gdp for the neutrals against 3.37 percent for the belligerents — twice as heavy on the countries that stayed out. In World War II the gap widens to something close to five to one: 11.80 percent of their own gdp for the neutrals against 2.53 percent for the belligerents. The externality of a war is, in trade-destruction terms, a larger proportional hit to the nations not fighting it than to the nations fighting it, which is what makes “collateral damage” a quantitative claim rather than a figure of speech.
The mechanism is not mysterious once stated. Not every pair of belligerents was an adversarial pair, so the countries at war went on trading with their allies and lost less than the headline coefficients suggest. The belligerents were large and the neutrals small, and the neutrals did a large share of their peacetime trade with the belligerents. And an absolute trade loss shared between two partners dents the smaller partner’s trade-to-gdp ratio far more, because the Frankel–Romer elasticity converts trade shares rather than trade levels. This is the part of the paper the de-risking and fragmentation literature is really borrowing, and it is the part the policy conclusion turns on: the authors read the size of the spillover onto neutrals as an economic rationale for the League of Nations and the United Nations, since the countries with the strongest interest in restraining a war are often the ones not in it.
World War II, where the comparison runs the other way
For World War II the trade loss is of the same order as the First’s, 4.16 percent of world gdp against 4.35, which is itself a small surprise given how much larger the second war was: more countries and more of world gdp were caught up in it and the estimated coefficients are bigger, but world trade relative to gdp in the 1938 base year had shrunk to about half its 1913 level, so there was much less trade left to destroy. The human cost, by contrast, is 5.43 percent of world gdp, about a third larger than the trade cost — the paper’s line that World War II was “about twice as costly” is comparing its human cost to World War I’s 2.43 percent, not its human cost to its own trade cost. Its own summary of the second war is that the trade costs are about equal to the human ones. And the Bogart-style comparison, which flattered the First World War, cuts the other way here: set against Nesterov’s (1990) accounting of $4,000 billion in 1938 prices, the $361 billion stock value of the lost trade adds less than 10 percent to the total, the mirror image of the almost 50 percent for 1914–18. The authors take this as a caution that their two trade estimates are similar while the other costs of the 1939–45 conflagration are not.
How much of this survives a smaller elasticity
The whole conversion from lost trade to lost income is linear in , and the paper says so rather than leaving the reader to work it out. The baseline has a standard error of 0.99; the alternatives in the literature mostly run higher, with Frankel and Romer’s better-data subsample at 2.96 and Irwin and Tervio’s (2002) historical cross-sections averaging 3.03. But Glick and Taylor also run the conservative direction, and , and report what happens: World War I’s 4.35 percent falls to between 1.1 and 2.2 percent of world gdp against a human cost of 2.43 percent, and World War II’s 4.16 percent falls to between 1 and 2 percent against a human cost of 5.43 percent. Even at the bottom of that range the trade cost is 40 to 80 percent of the human cost of the First World War and 20 to 40 percent of the human cost of the Second. So “twice the human cost” is a claim about the central calibration and the paper is explicit that it is; what survives every calibration is that the number is too big to leave off the bill.
Where it sits
Context in 2.5, and the block’s empirical premise: the bargaining models of war (Fearon 1995, Martin–Mayer–Thoenig) need trade to be something war destroys, expensively and for a long time, and this is the paper that measures that on the longest available panel. Its persistence result is also what makes the Fragmentation Paradox (2025) bite — if trade recovered the year a conflict ended, de-risking would be cheap insurance; because it takes a decade, the trade a country forgoes in advance is a real cost. Campos–Heid–Timini (2024) (Appendix A) run the same exercise for the Cold War. Glick and Taylor’s own footnotes place Martin–Mayer–Thoenig on a 1950–2000 sample and attribute their smaller lagged effects to including low-intensity disputes, dropping the world wars’ aftermath years, and putting a lagged dependent variable on the right-hand side — a cleaner basis for reading the two together than any claim about which of their tables matches which of these.