Notes on:
Harmonized Population and Labor Force Statistics
FEDS Working Paper 2025-057
18 September 2026
CPS · population controls · labour force statistics · time series
Talk · Paper · doi · PDF · Transcript
Made with AI: Opus 5 (reading and writing), GPT 5.6-Sol (reading), Fable 5.1 (adjudication), Sonnet 5 (verification)
Part of Innovations in Measuring Employment, Fall 2026
The Current Population Survey does not count employed Americans. It interviews about 60,000 households a month, works out what fraction of them are working or looking, and then multiplies that fraction by a number that arrives from somewhere else entirely — the Census Bureau’s estimate of the civilian noninstitutional population, cut by age and sex and race and Hispanic origin. The survey supplies the ratio. The Census Bureau supplies the scale. John Coglianese, presenting joint work with Seth Murray and Christopher Nekarda of the Federal Reserve Board, spent twenty minutes on the second half of that sentence, and by the end of it the interesting result was not that the scale is wrong but which statistics notice.
(What follows is unpublished Fed work — the September 2026 conference draft is the same paper as the Board’s 2025 working-paper version. It matters for a reason that becomes the point: the slides Coglianese showed are a newer vintage than the draft, and they do not say the same thing.)
The echo. Census re-issues its population estimates every year as a new “vintage.” The cps does not re-issue its weights. Each January the bls drops the current vintage into the current year’s weighting and leaves every prior year exactly as published, which means the published population series is a chain of segments each calibrated to a guess that has since been superseded. Coglianese’s word for what this produces is echoes: the bls line tracks whichever vintage was current at the time, then steps sideways each January onto the next one. The step in January 2012 was 1.7 million for the population aged 16 and over, against a typical monthly change of about 200,000. January 2025 added nearly 3 million. The steps in 2017, 2019 and 2020 were negative.
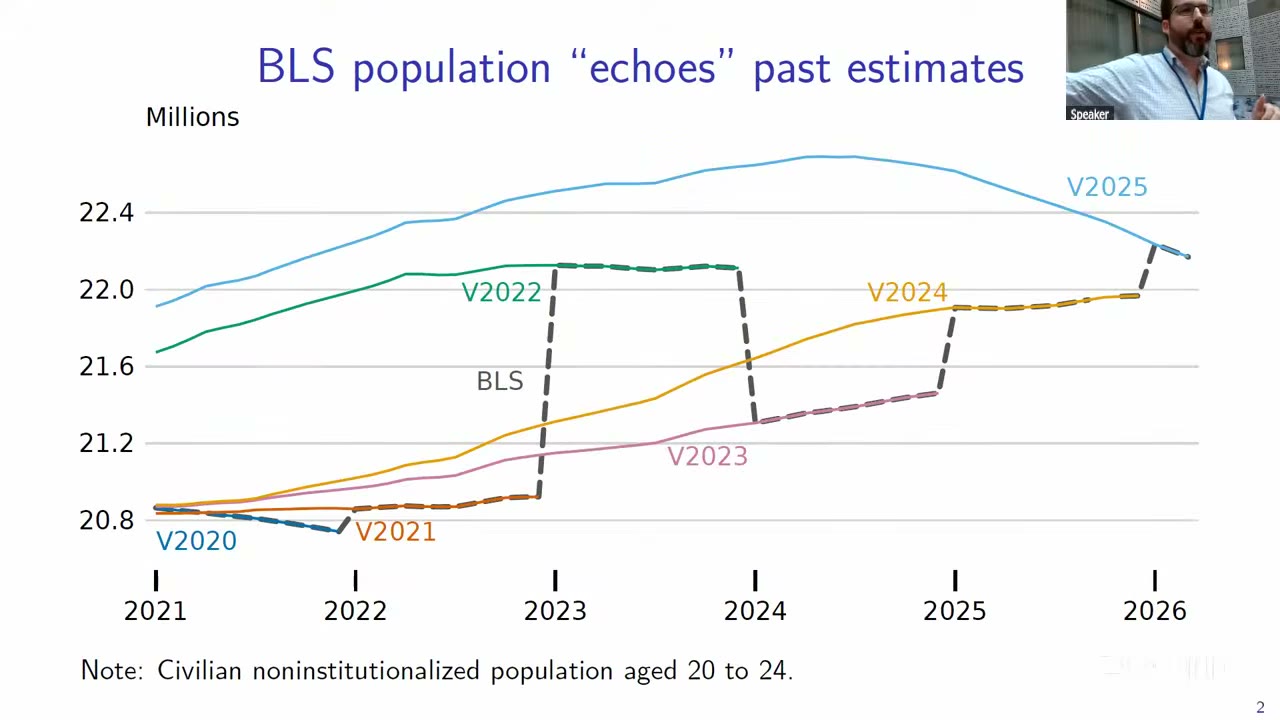
The obvious repair — smooth the jumps away — does not work, and the slide above is the reason. The gap between what was published and what we now believe alternates sign, so there is no direction to smooth in. Worse, a new vintage changes the slope and not just the level: the yellow V2024 line has the 20-to-24 population drifting up through 2025, while the blue V2025 line has it contracting over the same months “by a fairly substantial amount.” You cannot bend a series into a shape when the shape is what got revised. And because any month’s control is built from source data up to 18 months old, the current segment is wrong too — just continuously, which is why nobody notices.
The wedge. So they rebuild the targets from the censuses instead. Every ten years there is an exact count for one month; in between there are postcensal estimates that accumulate error until the next census reveals how much. Take the last postcensal estimate of a decade, difference it against the census that follows — the error of closure — and spread that error linearly backwards across the decade, for every single-year-of-age by sex by race by Hispanic-origin cell:
Here is the last postcensal estimate for group at day of the decade, the census count at the closing April 1, the postcensal estimate for that same date, and the days in the decade. Straight-line apportionment, defended honestly: “We don’t know exactly when that error occurred.” Six census bases from 1970 to 2020 splice into one series running from January 1976, with headline aggregates carried back to 1948 through five documented pre-microdata breaks. This is Census’s own intercensal method, renamed to avoid being mistaken for the official product.
Then the part that makes the paper possible rather than merely desirable. The bls pipeline has four stages — geographic weighting, demographic reweighting to the population controls, composite estimation, seasonal adjustment — and population enters at exactly one of them. Stage-one weights are independent of the controls, so you can start from the published second-stage weights, redo the national coverage step and ten raking iterations against harmonized targets, and then rerun stages three and four. They use the published seasonal factors rather than estimating their own, which is the right call: it means seasonality cannot be a hidden margin of difference. Two admitted gaps, both volunteered from the podium. National targets only, because monthly state-level population by demographic group is not published — “if anybody’s here from bls and knows exactly how the cps group gets to monthly cnip estimates at the state level, we would be very interested to hear” — and, since 2011, perturbed ages in the public microdata, which occasionally deposit a respondent in the wrong cell. Against the bls’s own January tabulation of what the new controls did to the previous December, the reconstruction matches the labor force and employment levels to less than 0.1 percent for nearly every group and under 0.05 percent for the total, with a worst cell of 16-to-19-year-olds about 0.6 percent low — an artefact of controlling 16–17 and 18–19 separately where the bls uses one group.
What moves, and what doesn’t. Population moves by millions. At April 2020 the current estimates carry nearly a million more men aged 25 to 54 and nearly a million fewer women over 55 than the series the bls weighted to. The participation rate moves by about four tenths of a point. The unemployment rate does essentially nothing — within a tenth from 1994 forward — and the authors’ explanation is the whole logic of the exercise in one line: unemployment rates vary less across demographic groups than participation rates do, so shuffling the age-sex-race mix has very little to shuffle. Rescaling the denominator changes the level of the labor force enormously and the composition of the ratio barely at all.
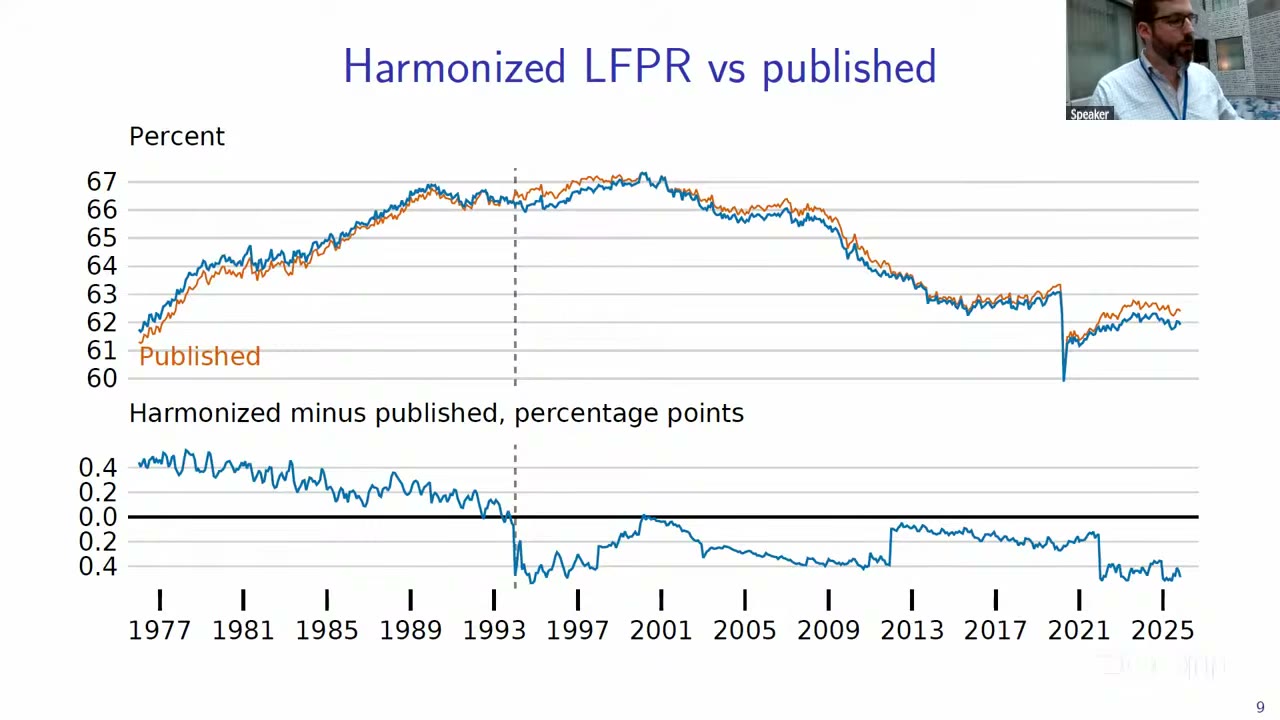
Coglianese’s reading of that bottom panel: harmonized runs a little above published before 1994, and since then below, “particularly here in the latest years, more than four tenths below, it’s more than a million people lower in terms of the labor force level.”
The vintage that flipped the sign. The draft says the opposite. In the written paper the published participation rate falls below the harmonized series in 2012 and stays there, the gap widening to about 0.4 points on the eve of the pandemic; its pandemic figure has the harmonized line above the published one in every month of 2020 through 2024. The slide has the harmonized line below the published one throughout the same window, including before the pandemic. Same chart, same colours, same labels, opposite sign.
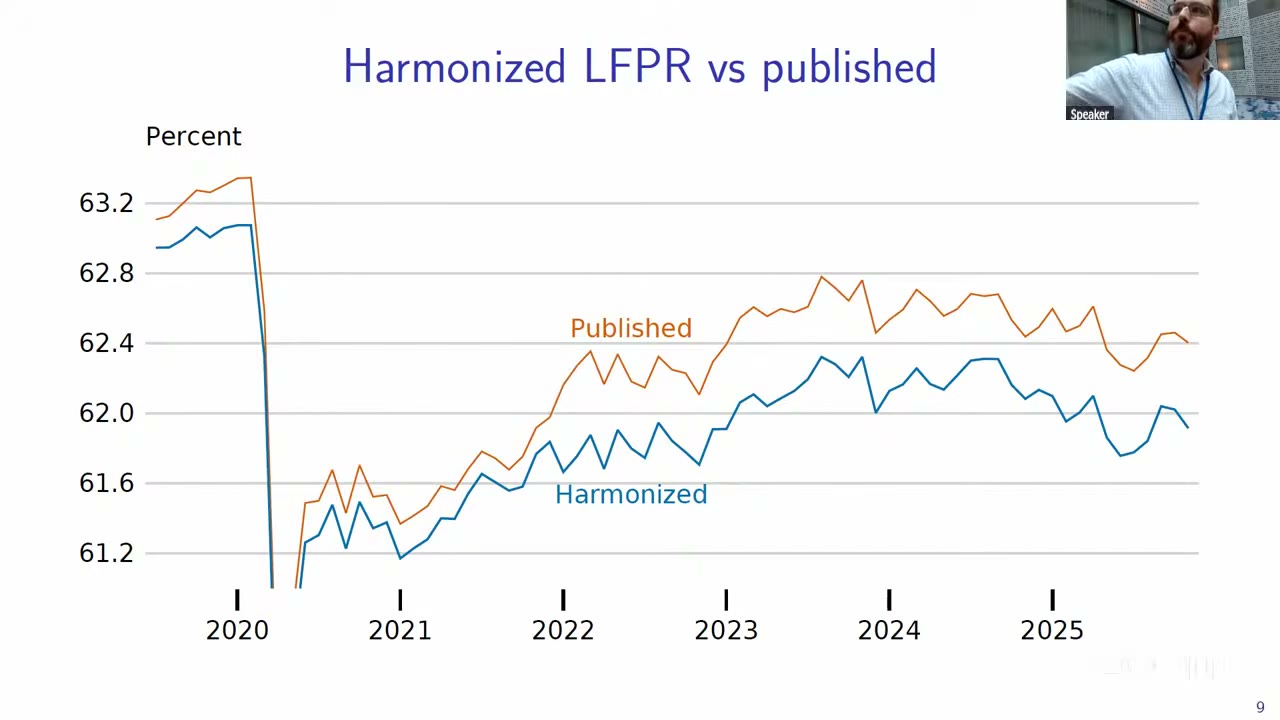
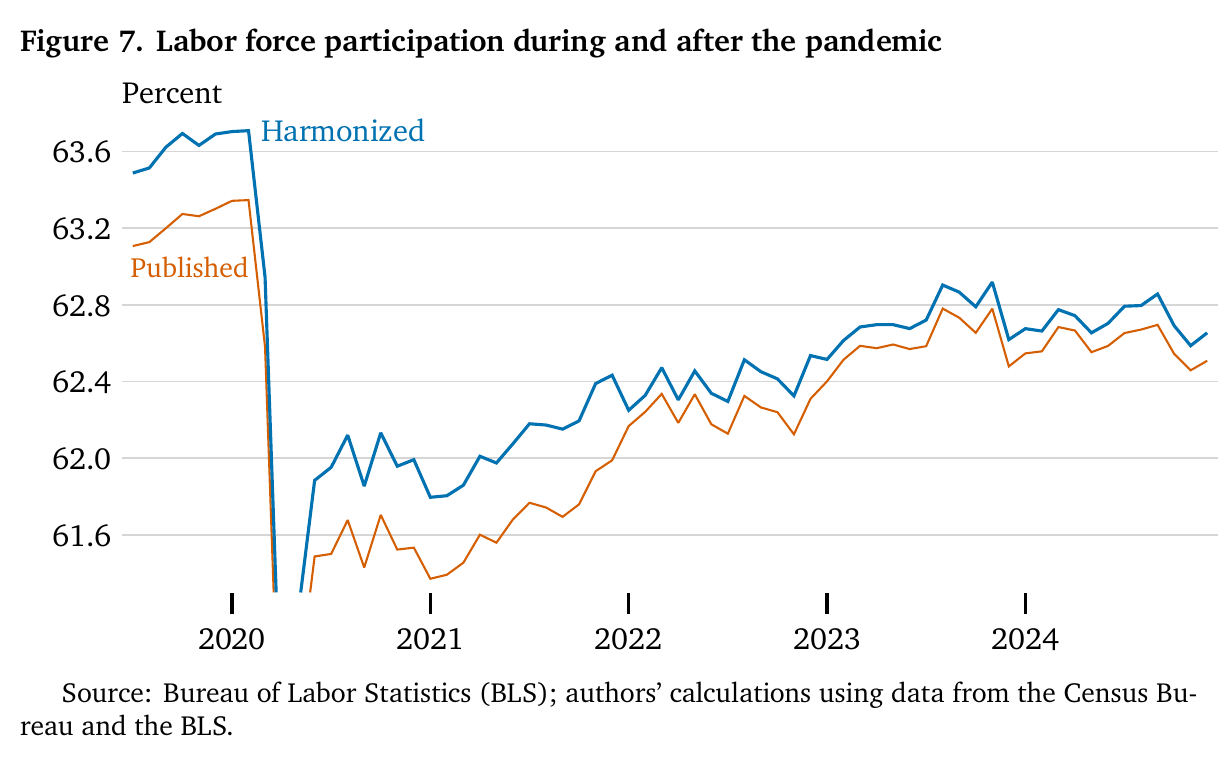
This is not a colour or an axis misreading. The published series is visibly identical in both pictures, sitting at 63.2 to 63.3 in early 2020; only the harmonized series moved, down by something like six or seven tenths of a point at that date on the draft’s own axes. Read the magnitudes as approximate, because they are read off charts. But the direction is not in doubt, and the speaker’s words match his slide rather than his paper.
Nobody in the room mentioned it, and I cannot tell you what caused it. One annual Census update moved the smooth, trustworthy, revision-free series by more than the January discontinuity it was built to remove. The draft’s headline — that the post-pandemic labor force shortfall is 1.5 million larger than the published data implied — is a claim about the change from before the pandemic to after, and survives on its own terms; the talk’s “more than a million lower” is a claim about the level in recent years, and is a different object. But the draft’s stated reason for the pandemic result was that harmonized participation was four tenths higher on the eve of the pandemic, and on the newer vintage it is lower. That much is simply contradicted.
Crossley. Thomas Crossley, discussing both papers in the session, liked this one — “the methods as far as I can tell are sound,” plus a data product for the research community — and then spent his time on the question of why the bls might be right to do the thing the paper is fixing. His frame is a two-by-two: how badly do you need to revise (must you publish before the data are in?) against how much revising costs (is anything legally tied to the number?). gdp has a strong need and a low cost, so it revises. The cpi has a high cost — tips, colas — and little need, because prices arrive quickly and the quantities are lagged anyway, so it doesn’t. Neither position is a fact of nature; Törnqvist indices would move inflation into the awkward corner, and so would gdp-linked bonds, “like I guess the Greeks do.”
Labor force statistics sit in the corner where both pressures bind. New population information really does arrive, and the numbers really are tied to things — “like triggering extended ui benefits, and so you wanna keep them frozen.” Forward-only rebasing is not laziness; it is a frozen benefits basis. Nor is it an American quirk: the uk ons does the same, and rather worse, since its rebasings do not arrive on a predictable schedule the way the American ones do, every January, “everyone knew what was gonna happen when it was gonna happen.” Canada is the counterexample. Statistics Canada rolls population forward from each census on vital statistics and administrative immigration data and then, at the next census, “they do revise backwards, unlike the bls or the ons, but only back to the last census” — every five years, bounded. This paper revises backwards at every annual update and as far back as it needs to go.
Which is where his one real worry lands. The cost is not the arithmetic, it is bookkeeping: “We no longer have a single canonical record of what the employment rate was in June 1990, for example. We will have multiple unemployment rates.” Every update mints a new backwards series, so you trade jumps for version control and release stamping. He has sat on Canadian and uk statistical advisory groups where colleagues “really dislike proliferating series, because they worry that it’ll undermine confidence in the official statistics,” and he was never persuaded by that argument either. Manageable, benefits exceed costs, welcome contribution.
He is right that it is manageable and right that it is not nothing, and the draft-versus-slides discrepancy is his hypothetical arriving inside the conference. The two vintages are exactly the multiple histories he described, one year apart, disagreeing about the sign of the correction.
Coglianese’s reply was two minutes and used the null result as the defence, which is the strongest move available. The real-time objection binds on the number that triggers benefits, and the effect on the unemployment rate “was de minimis essentially. So I think you’d be unlikely to draw different conclusions in real time.” On proliferation, a straight concession: “we don’t have a great solution to that other than by noting there still is an official series and we would point you to that for official statistics.” That reads differently once you know the sign flipped, though in fairness nobody in the room knew.
Katharine Abraham, from the floor, took apart Crossley’s cpi corner rather than the paper. There is already a revised cpi used for a legally consequential purpose — indexing the tax code — “and we found a way to do it.” She recalled arguing the point with Janet Yellen at the cea when the measure was introduced, and concluded it was doable, “but it makes life a little more complicated.” The legal-tie objection to backward revision is an institutional problem someone has already solved once.
The paper’s only technical challenge came from a questioner from the Federal Reserve Board, who asked whether the participation gap is really a broad population-weight story or whether it concentrates in the gray area — part-time for economic reasons, the marginally attached — because if it does, “the implications for assessing the economic slack can be different.” Coglianese said the differences are “driven by people at older ages versus population at younger ages, sort of very broad differences,” so he would be less worried about that, “but that’s something we can have an exact answer to.” A promise to check.
The harmonized series, the weights, and time series back to 1948 are on the Board’s website; swapping the weight variable into your extract and rerunning is a one-line change, which is the sort of public good that gets used precisely because it costs nothing to try. And the finding everyone should actually take away is the one that survived the vintage change unscathed. The revisions move the population by millions and the participation rate by four tenths of a point in whichever direction this year’s estimates prefer, and they leave the unemployment rate alone — which is convenient, since the unemployment rate is the one with the benefits attached. Coglianese called it “one of the best labor market indicators we have,” and this is a decent argument for that: it is the statistic that the mismeasurement of the population cannot reach, mostly because it is a ratio that happens not to care how many people there are.