Notes on:
Charting the Uncharted: The (Un)Intended Consequences of Oil Sanctions and Dark Shipping
NBER Working Paper 33486
2025
geoeconomics · sanctions · evasion · shipping
Paper · PDF · Transcript
Made with AI: Fable 5 (reading), Fable 5.1 (writing)
Jesús Fernández-Villaverde, Yiliang Li, Le Xu and Francesco Zanetti. Presented at nber si International Economics and Geopolitics, July 10, 2025 (discussant listed as Jay Shambaugh); no recording is available. Video used here: the dark-shipping segment (25:41–44:43) of Fernández-Villaverde’s Oxford “Geoeconomics is Back!” lecture, May 30, 2025, plus a February 2026 Kleinman Center “Energy Policy Now” podcast with him as supplementary material. Neither has a discussant. Paper: the July 3, 2025 draft (nber Working Paper 33486) and the July 8 si slide deck.
You can turn off the transponder, but not the physics
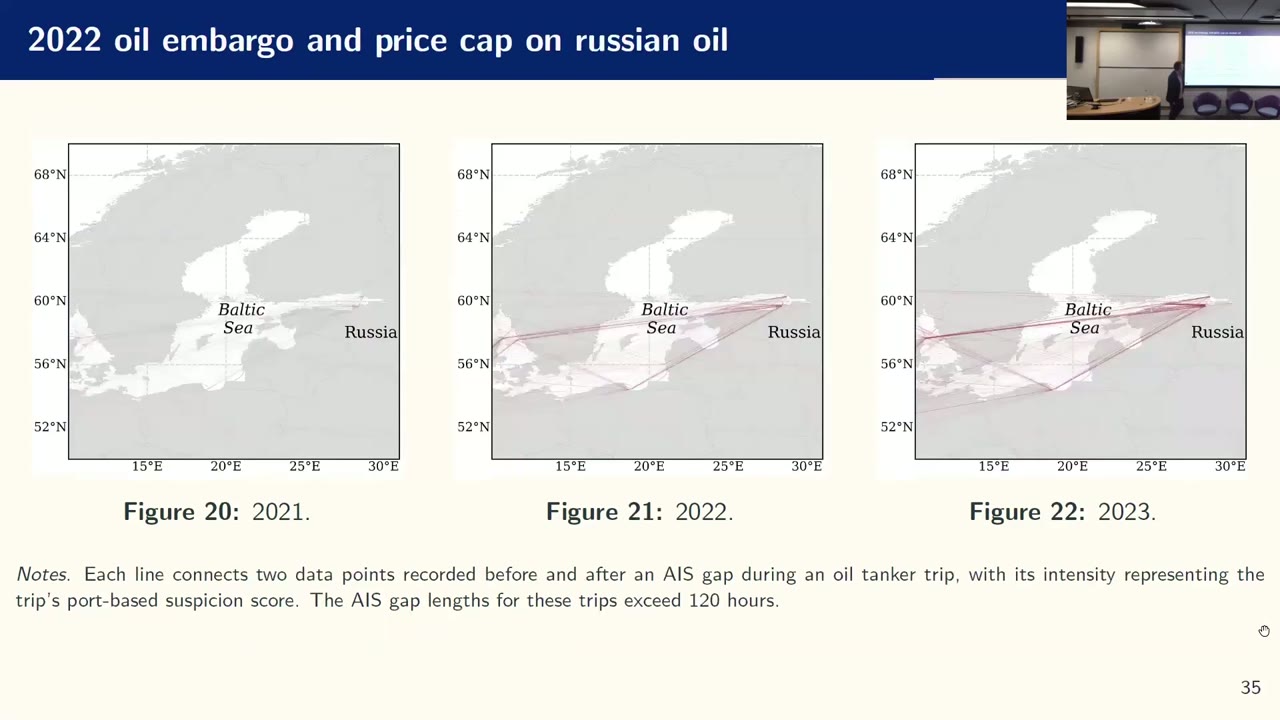
Every ship over 300 gross tons on an international voyage is required to carry an ais transceiver — a box that costs about 700 dollars on Amazon, the lecture says, and broadcasts its position, heading and speed so that it does not hit anyone at night in a storm; the same signal goes up to a satellite and down into a public database. Oil tankers serving Iran, Syria, Venezuela and Russia have taken to switching the box off near sanctioned ports, or near each other in international waters in the Persian Gulf, off Gibraltar and off West Africa, where cargo changes hands ship to ship. This is dark shipping, and the authors’ first contribution is to measure it from the one thing a dark ship cannot hide: the gap. A tanker leaves southern Nigeria broadcasting, the signal vanishes, the signal reappears somewhere else. Transceivers do fail — the lecture puts the innocent rate at about a tenth of a percent; the paper, more carefully, flags any gap longer than the vessel’s own 99th percentile — and they are failing in clusters. The raw material is over 330 million satellite ais records on the world’s crude tankers from 2017 to 2023, updated as often as every two seconds, curated down to about 2,160 tankers a year. (In the lecture this becomes “billions of observations” and “the population of the world. I’m not going to report the standard errors” — the spirit if not the letter, since the paper concedes that some 700 crude tankers a year broadcast nothing at all and cannot be classified either way.) Each trip is scored on three levels — does it start or end at a sanctioned port, does it go dark somewhere suspicious, does it move oddly — and the trip scores are pooled with vessel traits (age, the size of the operator’s fleet, the flag state’s risk ranking on the Paris MoU list, how often the ship sits idle) and fed to a K-means clustering that sorts the fleet into dark and white each year, no labelled training set required. “Somewhere suspicious” is two scores: proximity to a sanctioned port during the gap, and the probability of a ship-to-ship transfer, inferred from two vessels’ gaps overlapping in space and time. “Moves oddly” is idling, speed variability and the kind of route deviation Fernández-Villaverde compared to an American tourist lost in a roundabout. Validation is the fun part. Satellite imagery is, in the paper’s phrase, “costly or inaccessible” — the lecture and the si deck price it at 10 to 25 dollars a square kilometre, more than 3,000 dollars a trip — which rules out photographing the ocean but not a few thousand targeted photographs of where the algorithm says a ship will be, and when: the Roma loading at Kharg Island on August 20, 2022, transceiver off; the Abyss and the Shanaye Queen alongside each other in the Persian Gulf on January 28, 2022. They name names, and imo numbers (9182291, 9157765, 9242118), which is the maritime equivalent of printing the licence plate.
The scale is the headline. The dark fleet averaged 555 tankers over 2017–2023, about a quarter of the world’s crude tanker fleet, and moved an estimated 9.3 million metric tons of crude a month — nearly half of global seaborne crude exports, about seven percent of all crude exports in Comtrade. Iran and Russia dominate; the flows jump after the U.S. left the jcpoa in 2018 and after the embargo and price cap on Russia in late 2022. China takes 15 percent, over 117 million tons; South Korea, the uae and India follow; and volumes fall with distance, exactly as a gravity model would predict, which is a nice reminder that smugglers face the same freight costs as everyone else. One detail from the lecture is better than anything in the abstract: Iranian dark trade in the Gulf fell in 2022–23, because there are only so many tankers willing to run dark and the Russians were offering a better deal. The clearest loser from sanctions on Russia, on this evidence, is Iran. (The paper puts it more drily: Russia “overtook Iran as the largest exporter of sanctioned oil via dark shipping,” and ais-gap trips near Hormuz fell sharply after 2021 as tankers moved to Russian premiums.)
Anyway, the macroeconomics
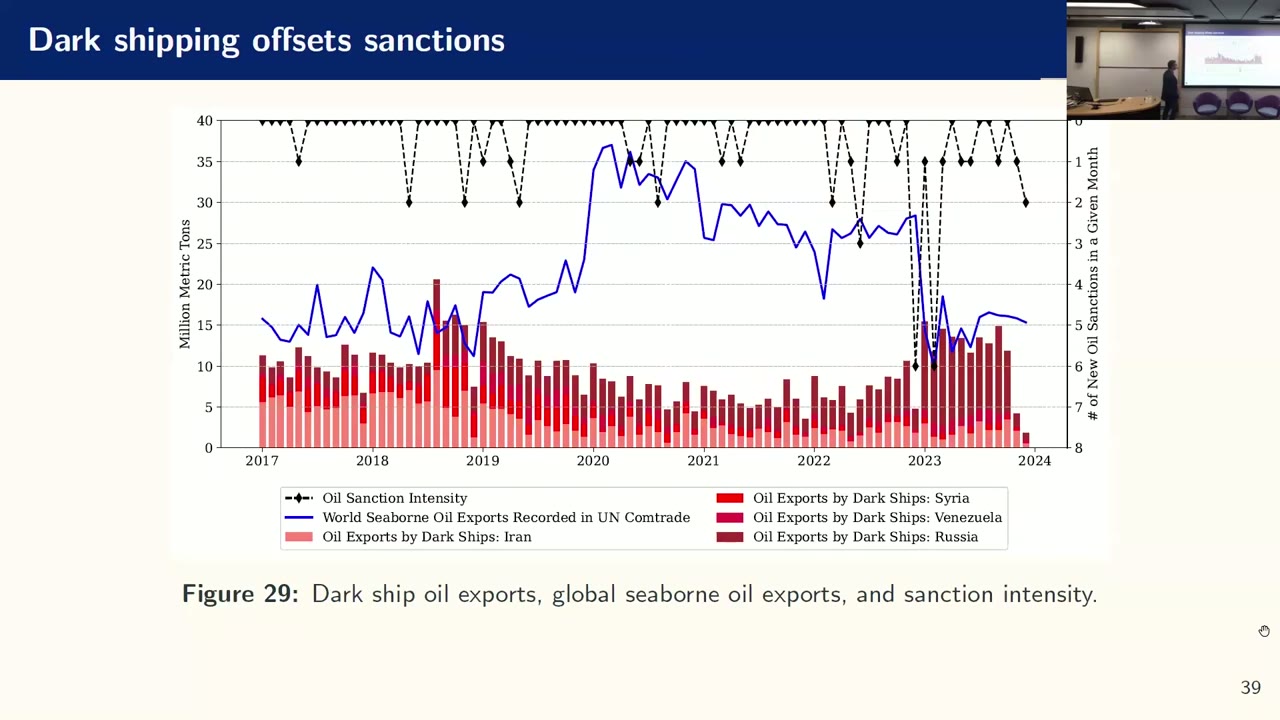
The sharpest single fact in the paper sits at the right-hand edge of that chart. After the six-country 60-dollar price cap on Russian crude took effect in December 2022, recorded global seaborne oil exports fell by nearly half in January 2023, and exports by dark ship more than doubled. Here is the question that makes this a paper rather than an investigation. If you are the Bank of England and the West stops Russia exporting oil, you expect an oil supply shock, higher prices, inflation, and a reason to tighten. But if Russia is not stopped, only rerouted — to a buyer who knows it has no other buyer — then the oil still gets produced, and it gets sold at a discount. The paper’s local projections find that an unexpected tightening of sanctions cuts recorded seaborne exports immediately and for about a year; that dark shipments surge and largely offset the loss for the first six months, peaking around month six and then falling sharply; and that Brent stays muted for as long as the dark oil is flowing. Once the dark exports fall away, prices do rise, and significantly, so the finding is not that sanctions never reach the oil price but that dark shipping buys the world roughly six months of insulation. (Drop the dark-export series from the regression and the estimated Brent response comes out lower still, which the authors read as omitted-variable bias: the missing variable is discounted oil pushing prices down.) The model that explains this has segmented markets and costly reallocation: when eu sanctions bite, Russia redirects to China via dark ships while Opec adjusts sluggishly; the Russian oil glut in China pushes down Chinese import prices, which offsets the scarcity in Europe, and the world price comes out nearly flat. The calibration is to Russian and Opec export and price data, and the discount is the mechanism: in the podcast Fernández-Villaverde’s worked example, offered as his “educated guess,” is 60-dollar oil on which Russia used to net 57 after freight, and now nets 50 minus an 8-dollar freight bill after China takes a 10-dollar haircut — 42, a quarter less.
Then the part the title is about. Cheap Chinese oil is cheap Chinese manufacturing, and China is the hub of global value chains, so the discount propagates. The United States, a net oil exporter, loses some producer revenue from softer prices but gains more from cheaper Chinese inputs — a deflationary, supply-driven expansion. The eu, a net importer, pays more for energy yet gets cheaper imports and stronger Chinese demand, and ends up with robust output and moderate inflation. China expands industrial production and transmits the effect abroad. The classical trade insight underneath, which the authors flag, is that when factor flows are blocked, trade in goods embodying the factor gets around the block — and here the factor is oil and the goods are everything China makes. The deadpan policy conclusion from the lecture is that the optimal U.S. policy may be to sanction Russian oil not because it stops Russia but because it forces Russia to sell to a tough negotiator who passes the discount back to American consumers — “unless of course you decide that importing cheap goods is a bad idea,” as, he added, some people do.
What the sanction actually does, then
The podcast is where the interpretation gets most careful, and it is worth taking seriously because the lecture is deliberately a crowd-pleaser. Dark shipping is not the same as the “shadow fleet” that operates outside Western insurance while technically complying with the price cap; the paper’s category is behavioral and broader. The insurance system, not the transponder, is the real chokepoint — a tanker without P&I cover is driving without insurance, and Turkey, for one, checks. On the podcast the fleet share is put at one in five tankers and 30–40 percent of seaborne oil, a bit lower than the paper’s sample average, which tells you the measure moves with events. And on what the policy achieves: sanctions do not keep Russian or Iranian oil off the market, but they make it costly enough to hurt — the haircut, the older ships, the premium for running dark — with the gain captured by China, because “the Chinese suddenly understand that now they have a lot of market power,” and a portion recycled to Europe and the U.S. as cheaper goods. The Bank of England, in other words, should read an oil sanction as a relative-price shock whose sign depends on where you sit in the supply chain, not as a supply shock — and should set a calendar reminder for month six.
(No discussion or Q&A is available for this paper. The obvious places a discussant would press: the lp identification of “sanction intensity” shocks, which is a recursive-ordering assumption that new sanctions are unanticipated within the month; whether the muted price response is China’s bargaining or simply Opec’s and shale’s supply response; and whether the cheap-Chinese-inputs channel for the U.S. survives 2025’s tariffs, which post-date the sample. Shambaugh’s discussion at the si session is not recorded.)