Notes on:
Changing Global Linkages: A New Cold War?
Journal of International Economics 153: 104042
2025
geoeconomics · fragmentation · gravity · FDI
Paper · doi · PDF
Made with AI: Opus 5 (reading and writing)
Gita Gopinath, Pierre-Olivier Gourinchas, Andrea F. Presbitero and Petia Topalova (all International Monetary Fund; Gourinchas, Presbitero and Topalova also cepr). This digest uses the published version: Journal of International Economics 153 (2025), article 104042, received 30 July 2024, accepted 12 December 2024, editor Jesse Schreger — ten pages of main text plus an online supplementary annex. It supersedes the April 2024 draft that circulated as imf Working Paper 24/076, whose tables it does not reproduce: sample windows, coefficients and exhibit numbers all moved. No seminar recording of the paper exists, so this is a pdf-only digest; the table and figures below are crops of the published article.
The aggregate is hiding the thing
Here is the puzzle the paper starts from. Since 2018 the United States has tariffed a wide range of Chinese imports, China has run Made in China 2025, Europe and the U.S. have each written down industrial strategies whose vocabulary is “de-risking” and “friend-shoring,” and a war in Ukraine has produced the largest sanctions programme in history. And yet, as the published version reports on p. 2, world goods trade as a share of gdp has sat between 41 and 48 percent since the global financial crisis and has not budged; global fdi drifted from about 3.4 percent of gdp before the crisis to 2.5 percent after, which is a slump but not a rupture. If you only looked at the aggregate you would conclude that nothing had happened.
The paper’s point is that the aggregate is the wrong place to look, because “geoeconomic fragmentation” — which the authors define, carefully, as policy-induced change in the sources and destinations of cross-border flows — “may or may not be associated with a decline in world trade relative to gdp” (p. 2). It is a who-with-whom object, not a how-much object. Force the jargon to say what it literally means and it turns out to be a claim about the composition of a matrix, not about its total. Which means the total can sit perfectly still while every cell underneath it rearranges.
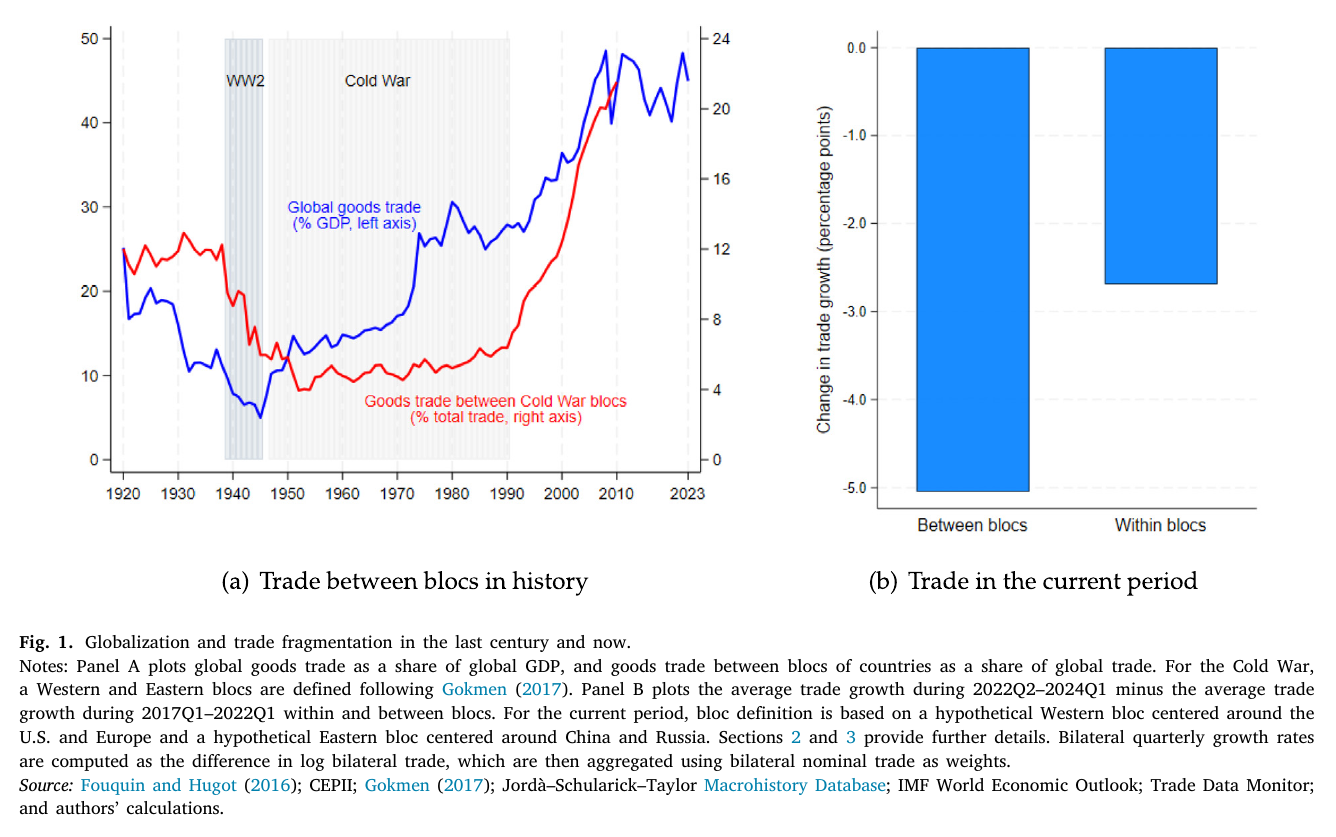
And it has. The paper’s first stylized fact, which is easy to skip past, is simple reshuffling: the Lilien (1982) index of reallocation across import sources rose roughly 15 percent above its 2003–2021 average after Russia’s invasion, and by almost 40 percent in advanced economies (p. 4, with the year coefficients plotted in Fig. 2, p. 5). Panel B of Fig. 1 puts the same thing in growth rates. Trade growth slowed everywhere after 2022; it slowed about five percentage points across bloc lines and about 2.7 points within them. Everyone is changing suppliers, and the advanced economies are changing them fastest.
A line, and a regression that only sees the line
The who-with-whom measure needs blocs, and the authors do not want to argue about who is in which. So they outsource it to un General Assembly voting: countries in the top quartile of political proximity to the U.S. in the 2021 Ideal Point Distance of Bailey, Strezhnev and Voeten (2017) form a U.S.-leaning bloc, the top quartile of proximity to China a China-leaning bloc, everyone else nonaligned (p. 5). A narrower alternative — a Western bloc of the U.S., Europe, Canada, Australia and New Zealand against an Eastern bloc of Belarus, China, Eritrea, Mali, Nicaragua, Russia and Syria — appears in panel B of Table 1. The specification, eq. (1) on p. 5 of the published version, is
where is bilateral trade in dollars, the count (or value) of announced fdi projects, or the change in the share of portfolio assets held by reporting country in counterpart ; marks pairs in different blocs and pairs with at least one nonaligned country, with same-bloc pairs the omitted category; switches on at 2022:q1 (a 1947–1990 dummy in the Cold War columns); and , , are the country-pair, source × time and destination × time effects.
Those last two are what make this a fragmentation measure rather than a trade-volume measure. They absorb, in the paper’s own inventory, “gdp growth, change in country risk, implemented and announced policies affecting all partners, and countries’ multilateral resistance terms” (pp. 5–6). Anything that hits a country’s trade with everybody is gone. What survives in is only the part of the movement specific to pairs that straddle the line. There is no instrument here and the paper does not pretend there is one; the identification is entirely the fixed-effect stack, and every coefficient reads as “relative to flows between friends.”
Eleven, twelve, and half a point
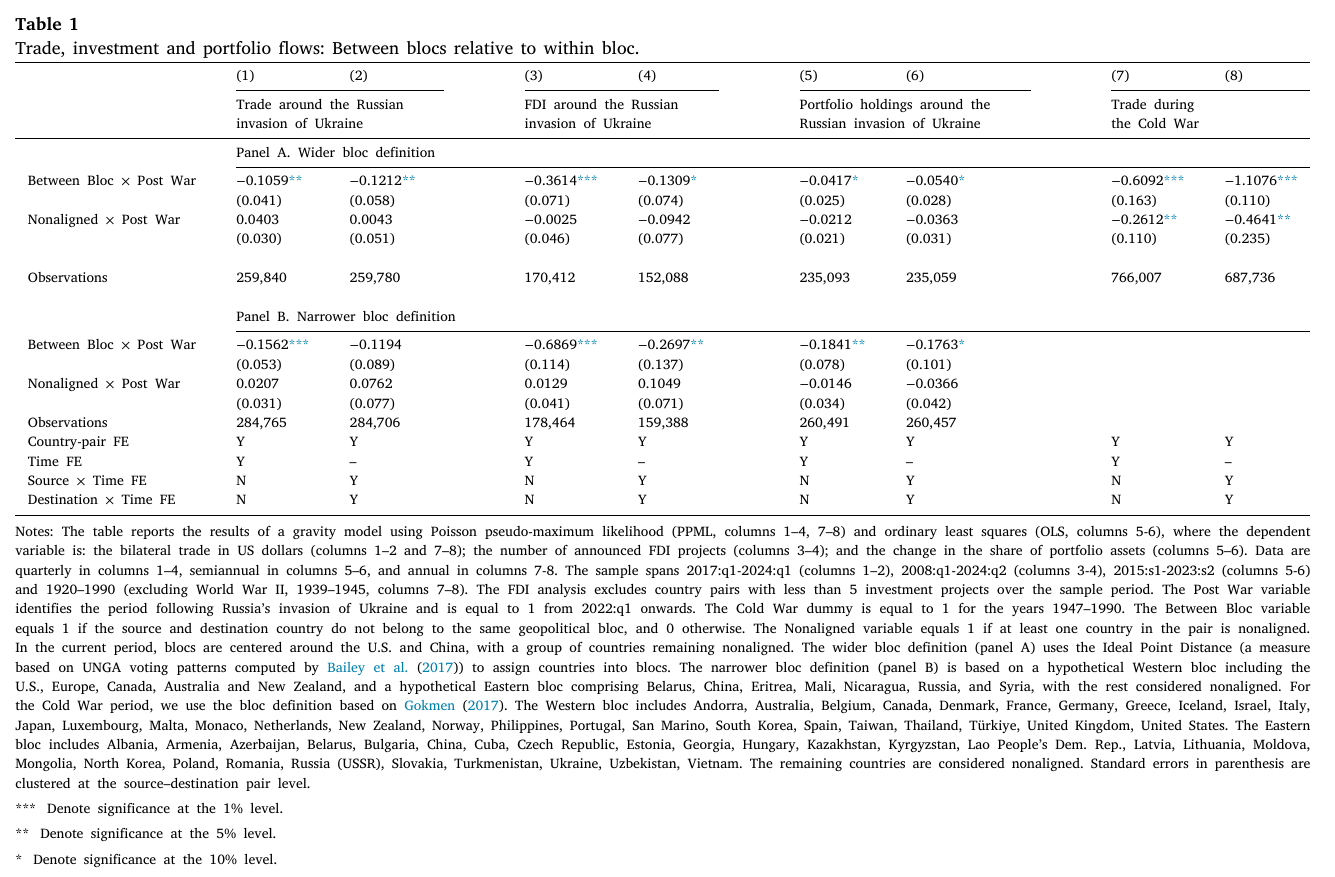
In the fully saturated columns of panel A, on quarterly trade over 2017:q1–2024:q1 and quarterly fdi project counts over 2008:q1–2024:q2, between-bloc trade runs and between-bloc fdi . The paper does the exponentiating itself in footnote 11 on p. 6: −11.4 percent for trade, −12.3 percent for fdi. Portfolio holdings, added here as a third pillar and estimated by ols on semiannual cpis data over 2015:s1–2023:s2, give −0.0540, a half a percentage point fall in the between-bloc share — which sounds like nothing until you notice that the average portfolio share in the sample, conditional on being positive, is 1.5 percent (p. 6). A third of the typical position, gone.
Anyone who read the April 2024 draft should register a change here, because one of these numbers moved a lot. The draft’s between-bloc fdi shortfall was about 20 percent; in the published version, with the fdi window extended back to 2008 and forward to mid-2024 and pairs with fewer than five projects dropped, it is 12.3 percent and significant only at 10 percent. The fdi effect roughly halved between drafts. The trade number barely moved, from about 12 to 11.4 percent. It is worth saying plainly rather than swapping the labels quietly: the striking finding of the working paper is now the smaller of the two, and the honest summary is that trade and fdi fragmented by about the same modest amount.
The robustness check that matters is dropping the U.S. and China, and the published version passes it with a caveat the draft did not carry: results are “broadly robust,” but “the decline in fdi between blocs and the resilience of those with nonaligned countries seems to be driven by Chinese and us flows, respectively” (p. 6, Table S2.2 in the online supplementary annex). So the trade line is genuinely global; the fdi line leans on China. The event-study version, Figure S1.2 in that annex, dates the divergence to the invasion rather than to 2018, and Figure S1.3 supplies the mechanism: between-bloc trade fell partly because Russia’s trade with the euro area collapsed, while within-bloc trade rose because Russia’s trade share with China more than doubled. The war, the authors write, acted as a “developing agent.” Fragmentation in both directions at once.
The Cold War as a ruler
Eleven percent is a number without a scale, so the paper reruns the same regression on annual bilateral trade from 1920 to 1990, dropping the war years, with the Cold War dummy on from 1947 and blocs as in Gokmen (2017). Between-bloc trade in that episode ran 67 percent below within-bloc trade (column 8, and footnote 12 on p. 6). Campos, Heid and Timini (2024) put the Cold War at the equivalent of a 48 percent ad valorem tariff, roughly halving East–West flows, which the authors note is “somewhat larger but in the same order of magnitude” than their own estimate — two rulers, both saying the same thing. Against either, “fragmentation so far is an order of magnitude smaller” (p. 6).
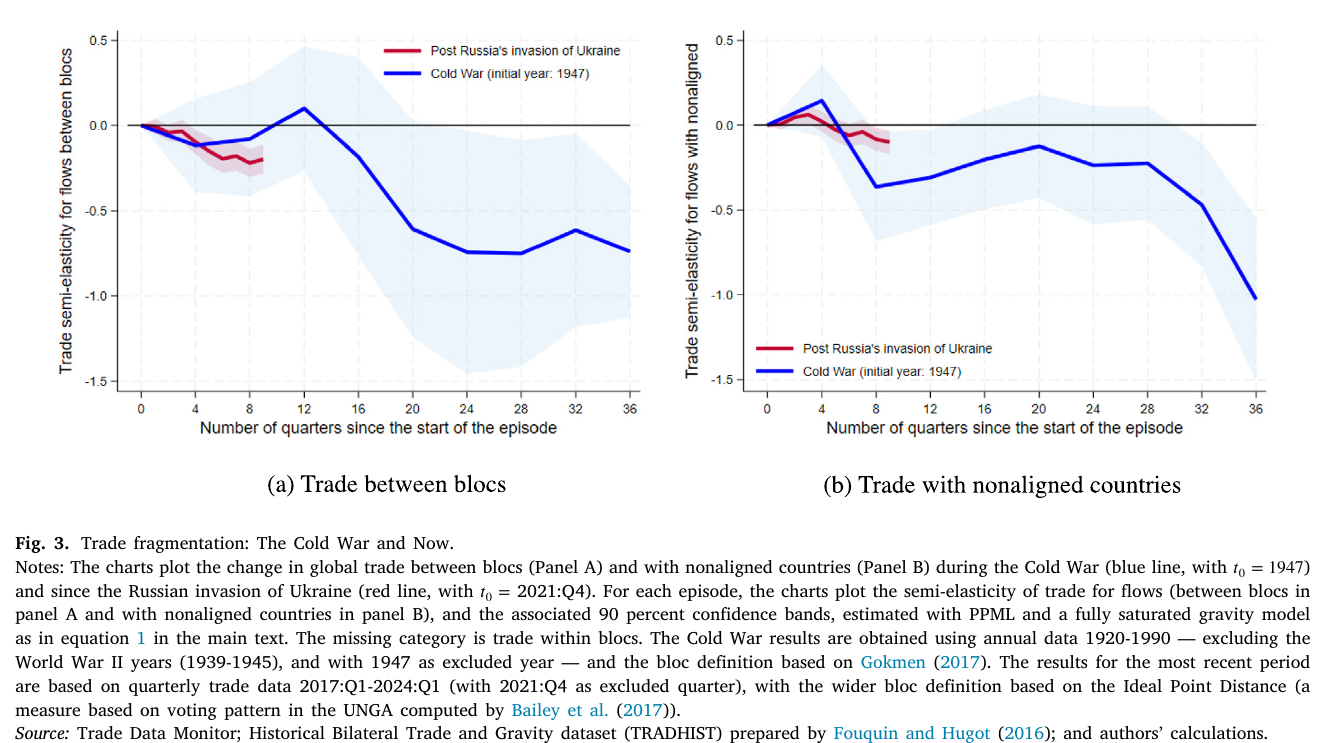
Fig. 3 is the more honest way to read that comfort. The Cold War did not fragment overnight either: it took at least five years for between-bloc trade to decline significantly and over a decade to reach its nadir (p. 6). Nine quarters into the present episode — quarter 0 is 2021:Q4, the red line ends at 2024:Q1 around −0.2 — the current path sits inside the Cold War’s confidence band. Which is to say the data cannot yet distinguish “a small permanent shift” from “1949.” What can be said is that the treatment is not comparable: us policy toward communist countries eventually meant tariffs restored to pre-gatt 1930 levels, export controls on military and strategic goods, and total embargo on North Korea and China (p. 6). Nobody is there.
The stage is different too, and in a direction that cuts against complacency. Global goods trade was 12 percent of gdp in 1947–1952 and averaged roughly 44 percent in 2019–2023; including services it exceeded 60 percent of world gdp in 2022. Primary goods were more than 40 percent of trade then and 14 percent now (pp. 7–8). A 67 percent between-bloc shortfall applied to today’s interdependence, in intermediates rather than ore, would be a categorically different event from the one the analogy invites you to picture.
Connectors, or why the aggregate didn’t move
Panel B of Fig. 3 carries the finding that has done the most work in the policy conversation since. During the Cold War trade with nonaligned economies also fell short of within-bloc trade, by 37 percent (p. 8); the nonaligned then were poor, tariffed and barely integrated, and they bridged nothing. Today the nonaligned coefficient is 0.0043 for trade and −0.0942 for fdi, both statistically indistinguishable from zero. Trade with the unaligned has kept pace with trade among friends.
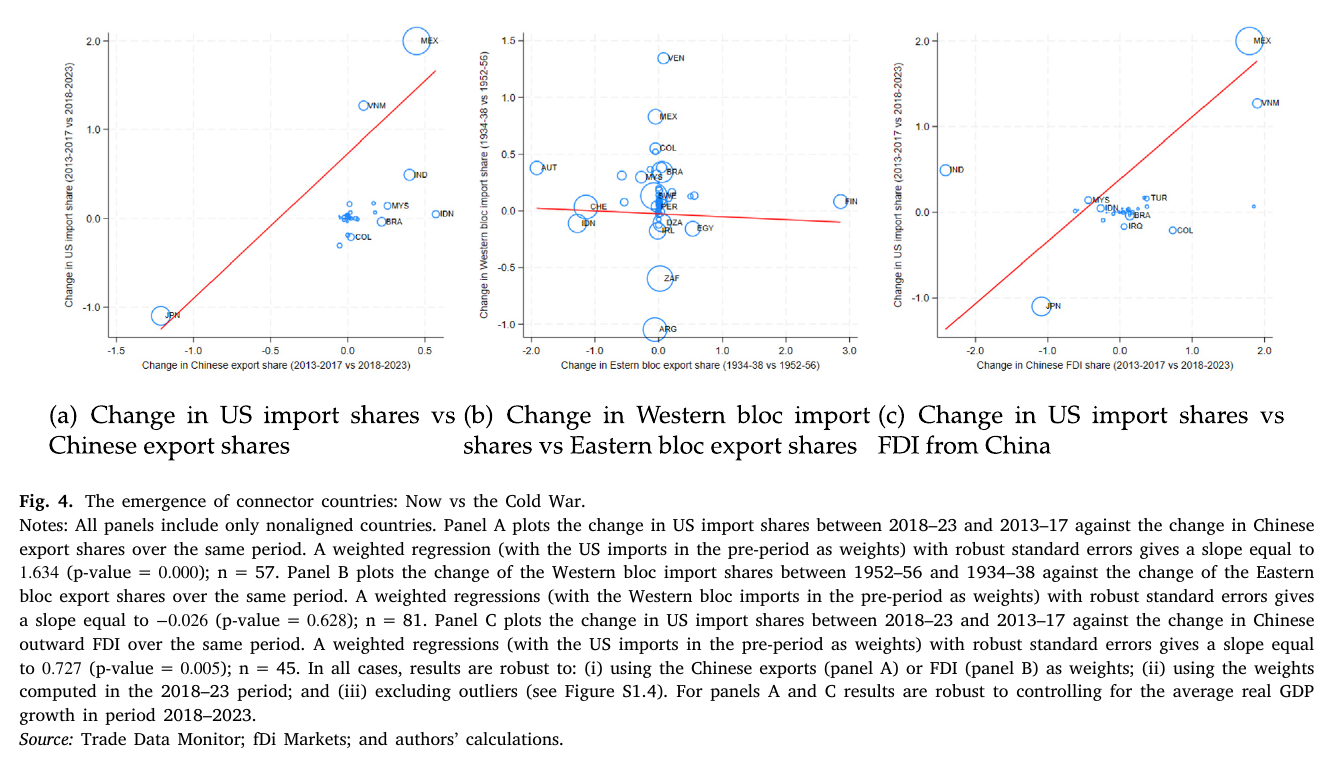
Fig. 4 is the mechanism in three scatterplots. China’s share of us goods imports fell roughly 8 percentage points in six years, from 22 percent in 2017 to 14 percent in 2023, and China lost rank as a destination for outward us fdi projects to India, Mexico and the uae (p. 8). The countries that picked up that import share — Mexico, Canada, and a number of Asian economies, “most notably Vietnam” — are the same countries that gained share of China’s exports (slope 1.634, p = 0.000, n = 57) and the same countries receiving Chinese greenfield projects (slope 0.727, p = 0.005, n = 45). Run the identical exercise on the 1950s and the cloud is flat: slope −0.026 with a p-value of 0.628 on 81 countries, or as the paper puts it, “the two series are completely orthogonal” (p. 8). The correlation holds at 2-, 4- and 6-digit hs and weakens as products get finer, which is what you would expect if some of this is re-export and some is real value added on Chinese inputs; it is strongest for exactly the products the U.S. tariffed in 2018; and a placebo run before the escalation finds nothing.
The authors are explicit that they cannot sign the causality, and they are right to be. But the shape is hard to miss. The policy severed the direct link and the indirect link grew to fill it, which is what a rational firm facing a tariff on one route and no tariff on another route would do, and which is why trade-to-gdp never moved. Why the nonaligned can play this role now and could not in 1950 is a matter of arithmetic: the two Cold War blocs were about 85 percent of global gdp and more than half the world’s population, while today’s median nonaligned economy has a trade-to-gdp ratio of 80 percent against 40 percent in 1960, a median mfn tariff of 12 percent against 40 percent, and free trade agreements covering partners worth a fifth of global gdp against none at all (p. 8).
One hedge, added in the published version, should not be left out, because it complicates the tidy version of this story. Zooming in on the most recent quarters of Figure S1.2, the authors detect “a small but statistically significant decline even in trade with nonaligned countries,” which they read as “the rising uncertainty regarding the connector role played by the unaligned economies as geopolitical tensions intensify” (p. 8). (Their sentence says this decline is relative to trade between blocs, though eq. (1)’s omitted category is trade within blocs; the point survives either reading.) The zero is a sample average, and the end of the sample is not the average.
What it is and isn’t
The paper is a set of stylized facts and calls itself one: no model, no welfare number, no decomposition of how much rerouting is genuine re-sourcing versus relabelled Chinese content. That question belongs to the product- and firm-level literature — Alfaro and Chor (2023); Freund, Mattoo, Mulabdic and Ruta (2024) in the Journal of International Economics 152 (2024); Fajgelbaum, Goldberg, Kennedy, Khandelwal and Taglioni (2024) in aer: Insights 6(2) (2024) — and this paper’s contribution is breadth rather than depth. The line is global rather than bilateral, it shows up in fdi and portfolio holdings as well as trade, and the Cold War supplies a unit of measurement that nobody else had bothered to estimate.
What it also supplies, and states plainly in the conclusion, is a conundrum: “the global economy is more resilient in part because it is increasingly substituting away from tariffed or sanctioned trade. But this substitution does not necessarily increase diversification, resilience, or lessen strategic dependence” (p. 9). The policies were sold as reducing exposure to a rival. Measured at the border they worked; measured at the exposure they added a hop. The world economy is robust to de-risking precisely because it found a way not to de-risk, and the paper’s closing sentence hands policymakers the choice it implies — preserve the gains from integration, “perhaps turning a blind eye to the re-routed flows, or opt instead for more severe forms of decoupling.” The blind eye is cheaper. It is also the option under which the −0.0942 on nonaligned fdi eventually stops being insignificant.