Notes on:
New U.S. Business Establishments: Surging or Stalling?
FEDS Working Paper 2026-040; Census CES Working Paper 26-36
18 September 2026
firm dynamics · business entry · administrative data · firm-dynamics models
Talk · Paper · doi · PDF · Transcript
Made with AI: Opus 5 (reading, diagram and writing), GPT 5.6-Sol (reading), Fable 5.1 (adjudication), Sonnet 5 (verification)
Part of Innovations in Measuring Employment, Fall 2026
The United States counts its own workplaces twice and gets two answers. In March 2023 the Bureau of Labor Statistics put the number of private-sector employer establishments at 9.2 million; the Census Bureau put it at 7.4 million. In the early 2000s the two lines sat on top of each other at about 6.5 million and they have been separating ever since — a gap averaging some 35,000 establishments a year in the late 1990s and 2000s, about 70,000 a year through the 2010s, and then, in the single year from 2021 to 2022, 461,000 against 155,000. bls has since published March 2025, and its count is now north of 9.3 million.
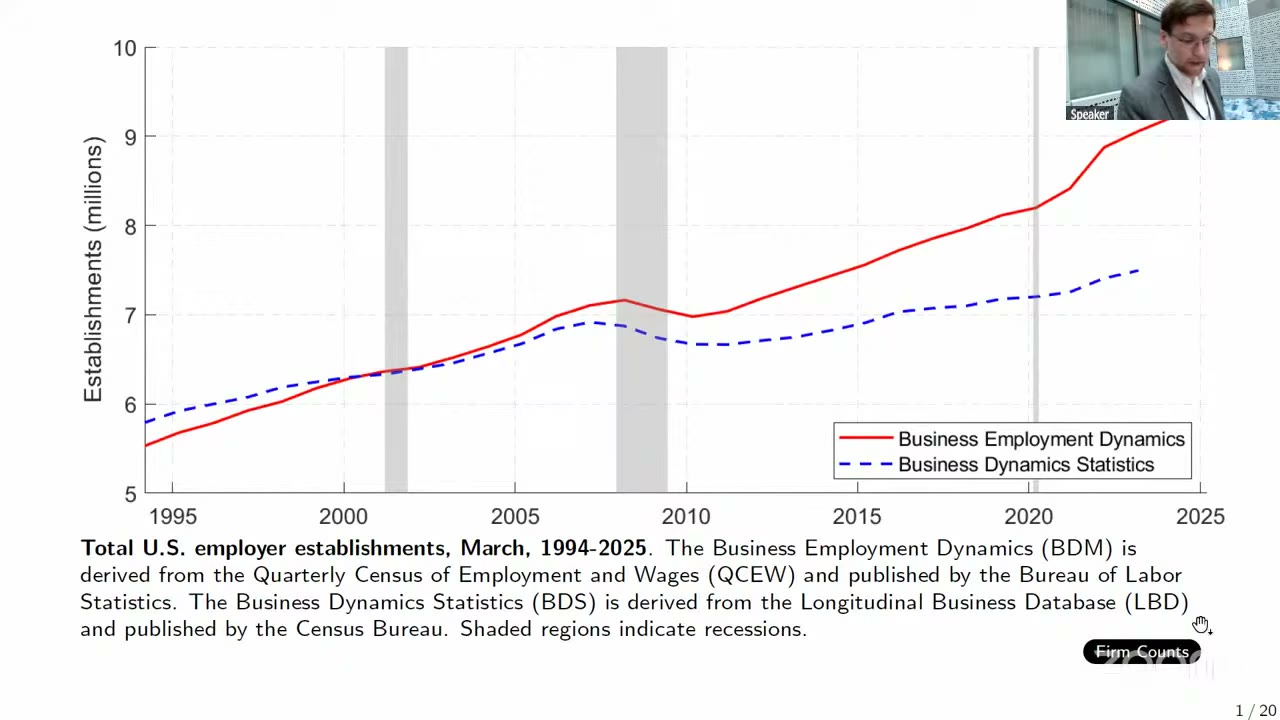
Henry Hyatt noticed this in 2018 while preparing discussant comments on a paper by Dan Cao, Toshihiko Mukoyama and Erick Sager, who had reported rapid growth in establishments in the bls microdata. He made a version of the chart above to check them. He is now their co-author, and the four of them have spent the intervening years inside the Census research environment finding out which of the two numbers is lying. The answer is neither, which is worse. The draft is unpublished — it carries a June 2026 date, circulates in both the Fed’s Finance and Economics Discussion Series and Census’s Center for Economic Studies series, and its disclosure clearance is from FY24 — and it is inconsistent with itself in two small places that are worth knowing about before you quote it, which I will come to.
Two pipelines, and the point where one of them stops
Two frames, two filing systems, and the difference is baked in before anyone counts anything. Census’s Business Register is fundamentally a register of irs Form 941 filers — the Employer’s quarterly Federal Tax Return — supplemented by the Company Organization Survey and the economic census, and it assigns establishments to firms administratively from federal tax records. The bls frame is assembled from 51 separate state unemployment-insurance accounting systems, plus the Multiple Worksite Report, a survey whose entire purpose is to go back to a business holding one ui account and make it enumerate its worksites. One system reconstructs the firm from federal tax filings; the other reconstructs the worksite from state payroll-tax filings. They were never going to give you the same number, and the interesting question is which direction each one errs in.
What makes the reconciliation possible is that the states hand their qcew microdata to Census’s lehd program too, where it sits as the Employer Characteristics File, and lehd keeps an ein-level crosswalk to the Business Register. So inside the research data centre you can look at the same firm through both lenses at once. Complete coverage for all fifty states and dc exists for 2004 to 2016, and every microdata result in the paper is March 2016. Each firm is aggregated up and dropped into one of five bins: single-unit in both frames, multi-unit in both, multi-unit in only one or the other, and present in only one source at all.
Engine one: about half a million households
The largest published gap by supersector is Education and Health Services, where bls reports more than 1.7 million establishments against Census’s roughly 1.0 million. Almost all of that turns out to be firms the bls frame has and Census does not have at all, and almost all of that sits in a single six-digit industry: naics 624120, Services for the Elderly and Persons with Disabilities — home health aides, adult day care, homemaker services.
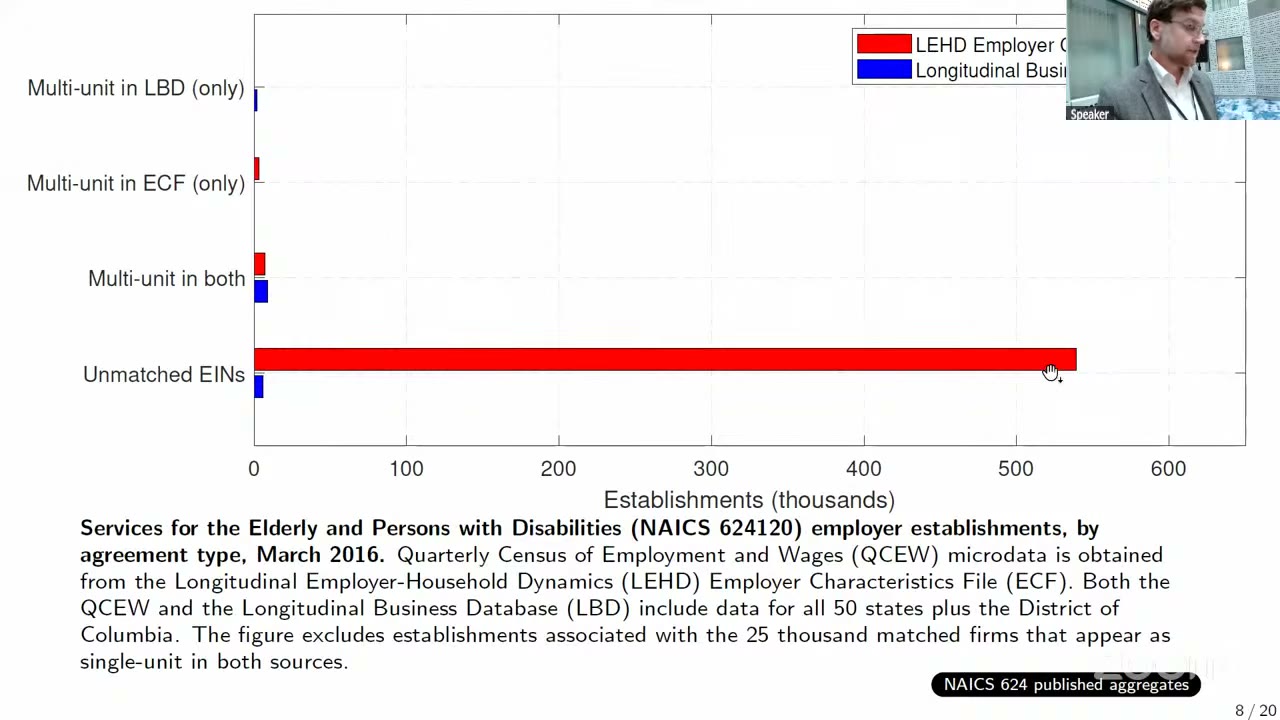
The paper’s account of why is a tax form, and it is careful to present it as an account rather than a proof. When a private household employs someone to care for an elderly or disabled relative, it does not file Form 941. It files Schedule H, Household Employment Taxes, stapled to its own Form 1040. Census’s register is a 941 register, so the household is not a business and the aide is not at an establishment. On the other side, the paper says the aide “may be covered by unemployment insurance and therefore enter into the bls establishment frame” — the conditional is theirs, as is the “likely” in front of the whole explanation — and where the coverage holds, the household is an establishment. On the order of half a million employer establishments in 2016, by the paper’s reckoning, hinge on that asymmetry. A footnote concedes the other direction: an aide working for several households at once could be counted more than once.
Engine two: the same firms, chopped differently
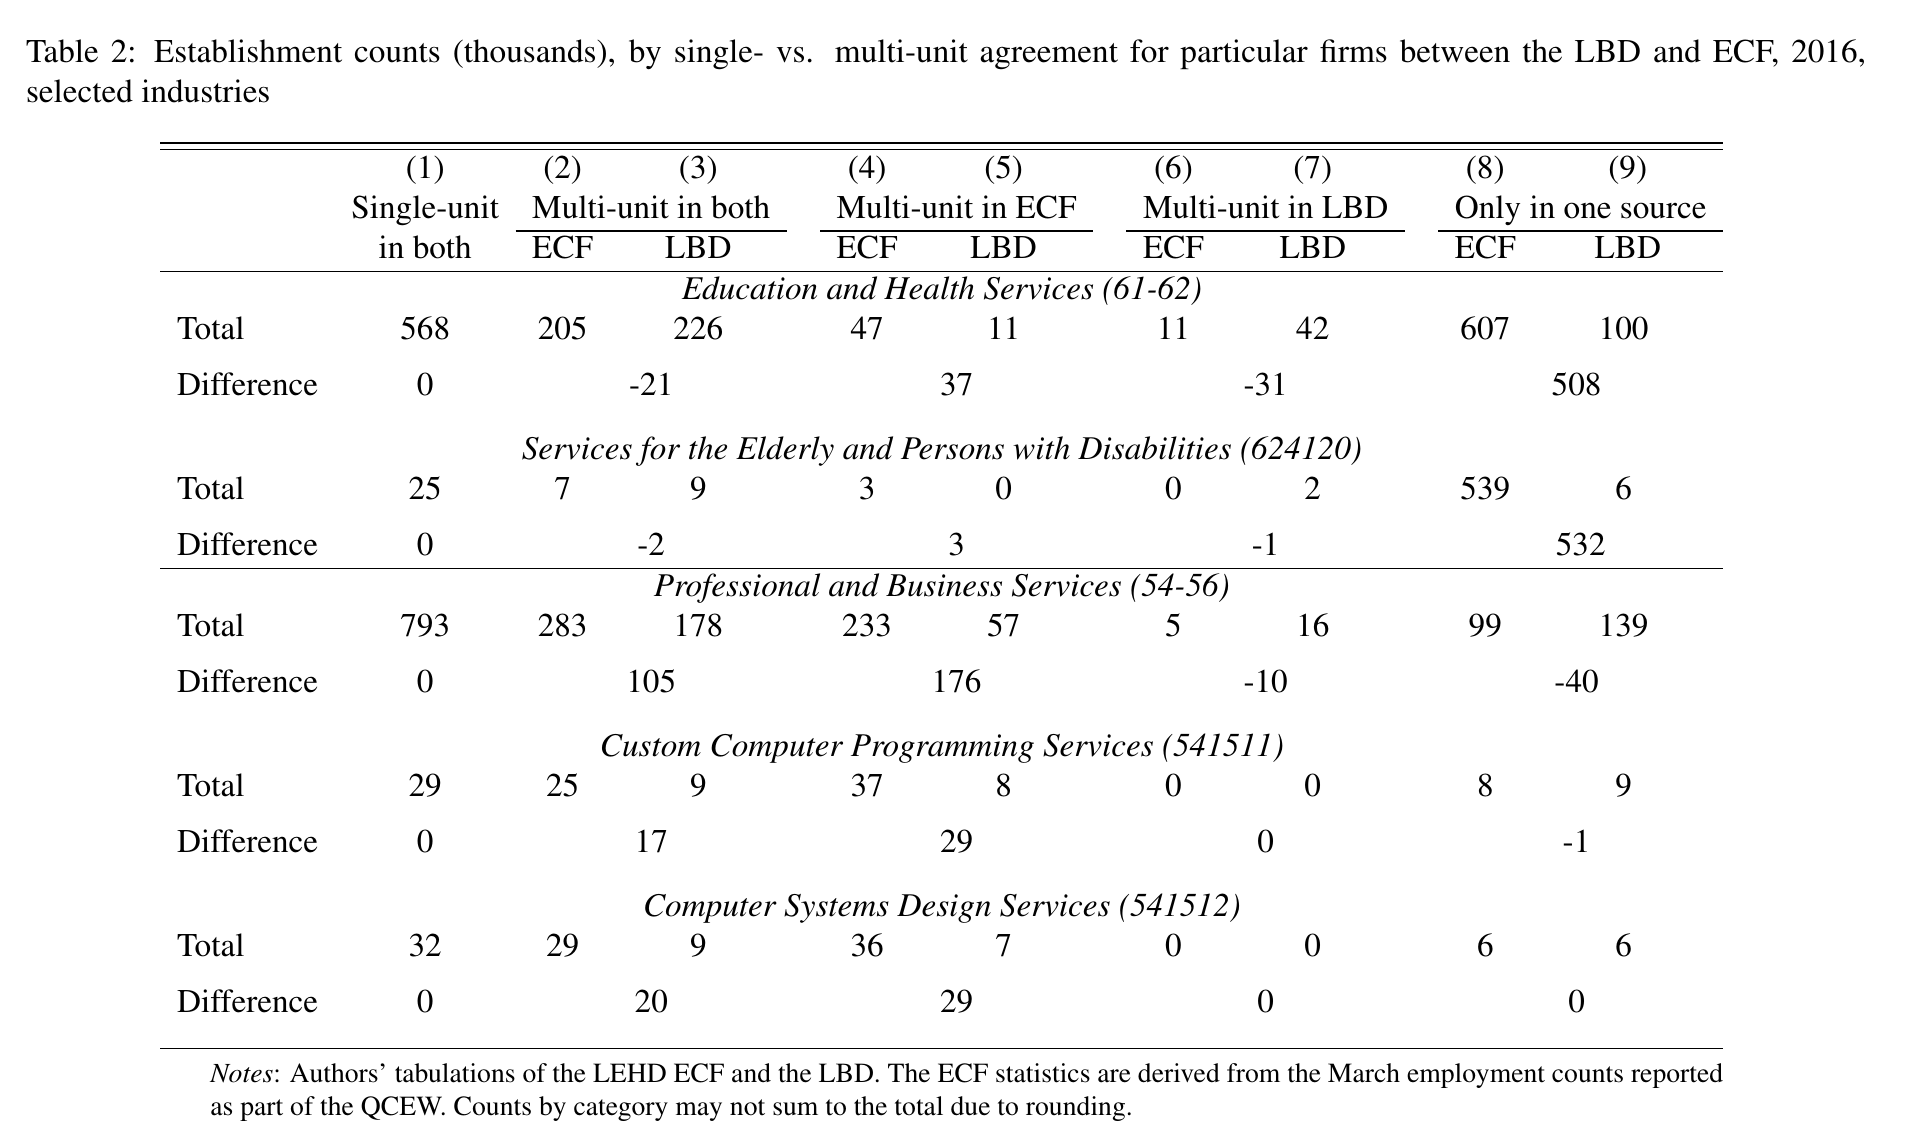
Everything outside home care looks nothing like that. Take Professional and Business Services, the second-largest published gap. The two frames broadly agree on which firms exist there — the only-in-one-source columns run the other way, 139 thousand against 99 thousand, a net 40 thousand in Census’s favour. The disagreement is about structure. There are 57 thousand firms that Census sees as a single establishment and bls sees as 233 thousand establishments, and among firms both frames already call multi-unit, bls finds 283 thousand establishments where Census finds 178 thousand. Across the whole economy the same pattern: 167 thousand firms are single-unit to Census and multi-unit to bls, operating 621 thousand establishments in the bls frame, which Hyatt called “more than half of the disagreement.” The obvious suspects are not the culprits — Custom Computer Programming and Computer Systems Design together supply barely a third of the professional-services gap, and the rest is spread thinly across everything else.
The twist: the two gaps run opposite ways
Here is the part that makes this more than an accounting exercise. bls finds 1.6 million more establishments than Census. It also finds about 9.5 million fewer employees — 127.9 million against 137.5 million in 2023, per the paper’s appendix. (The main text says Census’s employment exceeds bls’s “by as much as five percent,” which its own appendix contradicts; the appendix has 7.4% in 2023 and a record 9.6% in 2022. Use the appendix. While you are at it, the introduction rounds Census’s establishment count to 7.5 million where the body says 7.4 million, and the abstract sensibly gives only the gap.) Hyatt was blunt about what the employment gap is not: Census publishes a total “about 10 million higher” than bls, he said, and “it’s not due to differential coverage.” The greatest source of it is firms that both sources agree are multi-unit — the same firms, seen whole by both frames, credited with different amounts of employment.
So the two agencies are not disagreeing about how much work is happening in America. They are disagreeing about how finely it is chopped up. The discussant, Benjamin Pugsley of Notre Dame, put it as well as anyone: total private payroll employment largely agrees, “what’s diverging is the number of establishments,” which means the frames “disagree over the allocation of this employment across places.”
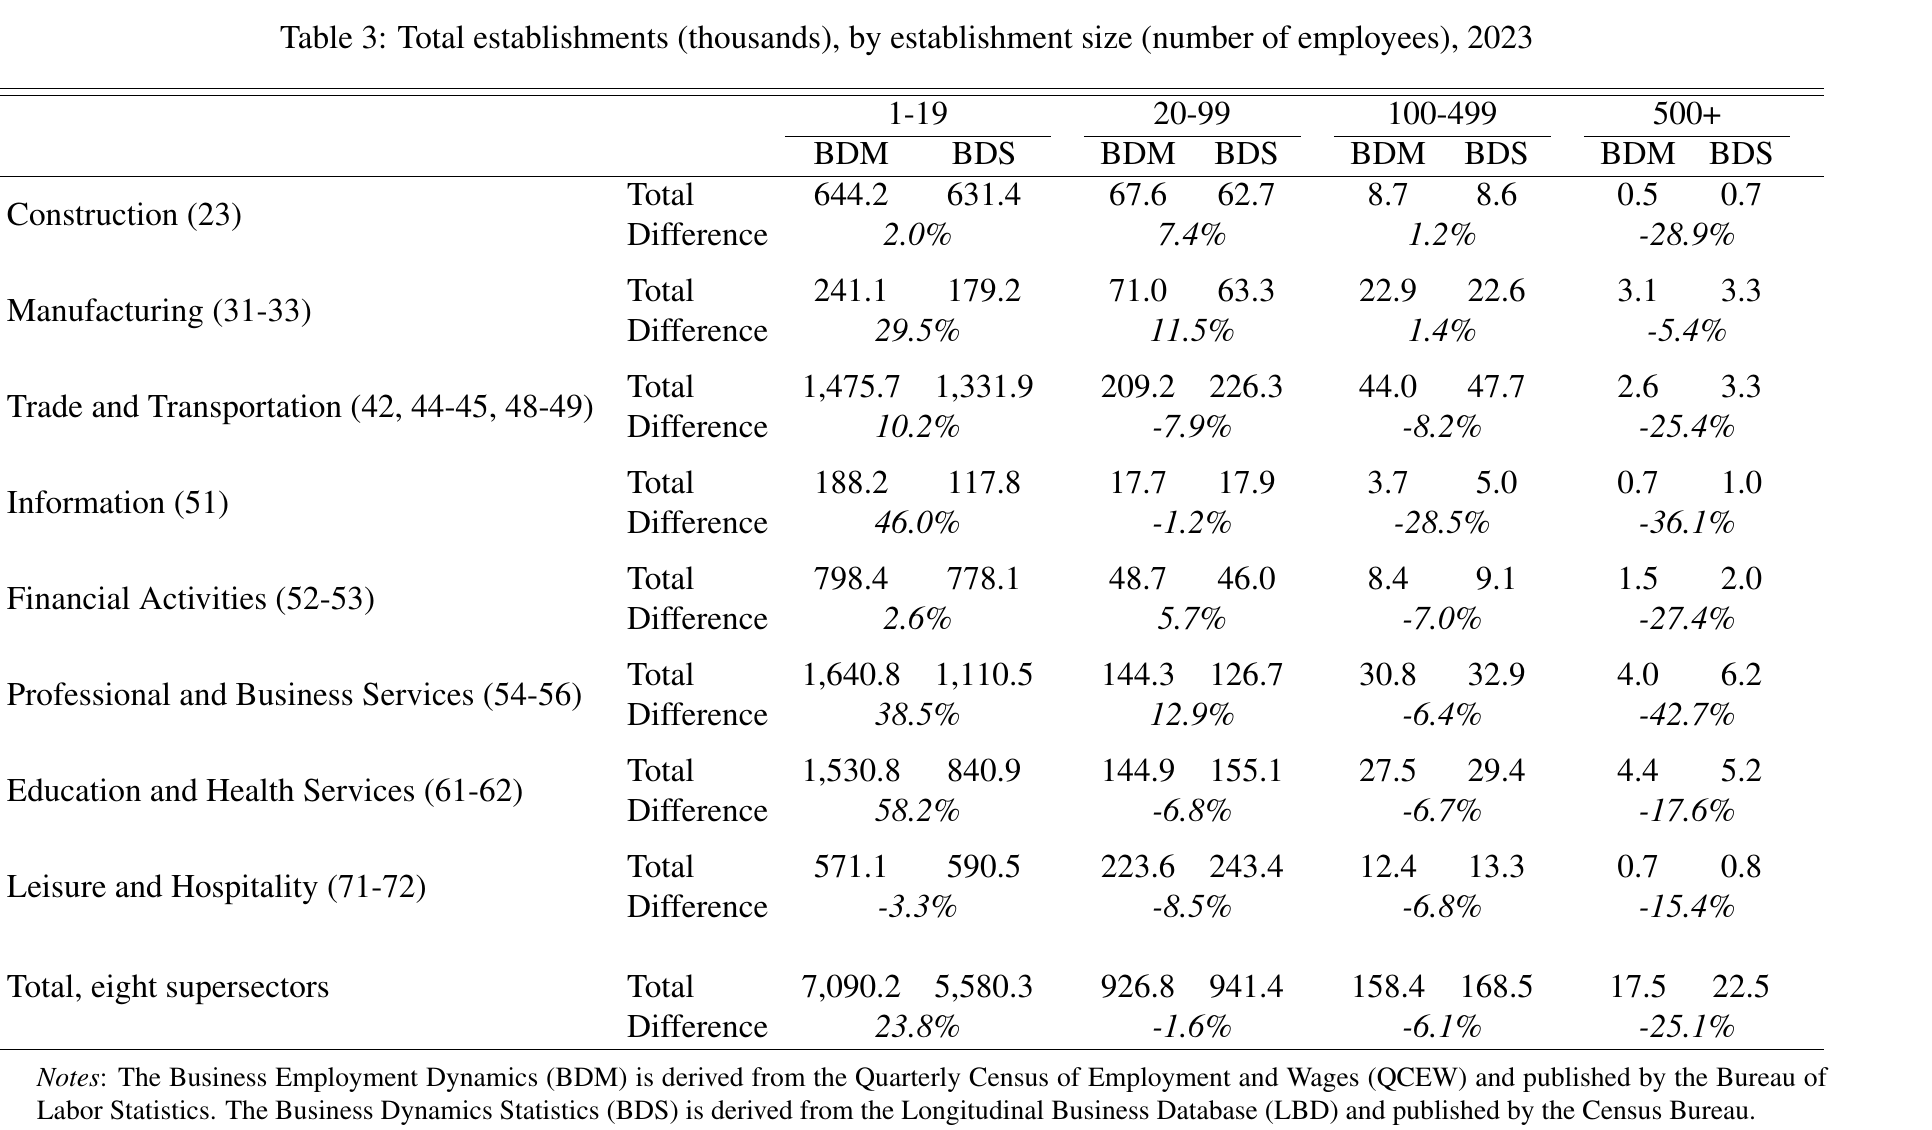
And that tilt is the paper’s real payload. bls’s frame describes, in the authors’ phrase, “a vast sea of micro-establishments”; Census’s emphasises “the continued importance of large-scale employment centers.” Same country, same year, same underlying payroll.
Which is why the policy number moves
Most measurement papers stop there, with a table of discrepancies and a plea for caution. This one does something more aggressive: it takes the same Hopenhayn–Rogerson economy, calibrates it twice — once to each frame’s establishment size distribution — and asks both worlds the same policy question.
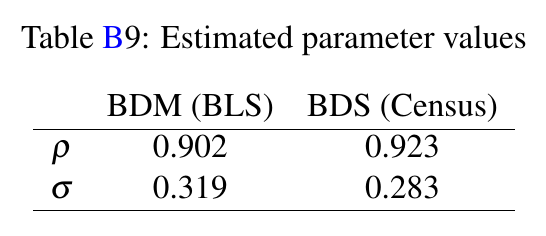
The mechanism is compact enough to state without algebra. Establishments have decreasing returns, so each has an optimal size; productivity follows an ar(1); a firing tax is paid only on workers shed, so it bites exactly when an establishment has to shrink toward a new optimum. Fat right tails are hard to generate, and the way you generate them is persistence. Hyatt’s version from the podium: “being a rare big establishment is easier when shocks are more persistent.” So matching Census’s heavier right tail forces a calmer productivity process out of the estimation, and matching bls’s heavier left tail forces a more volatile one.
Then impose a firing tax of one year’s wages — τ = 0.2, because a model period is five years and the five-year wage is the numeraire.
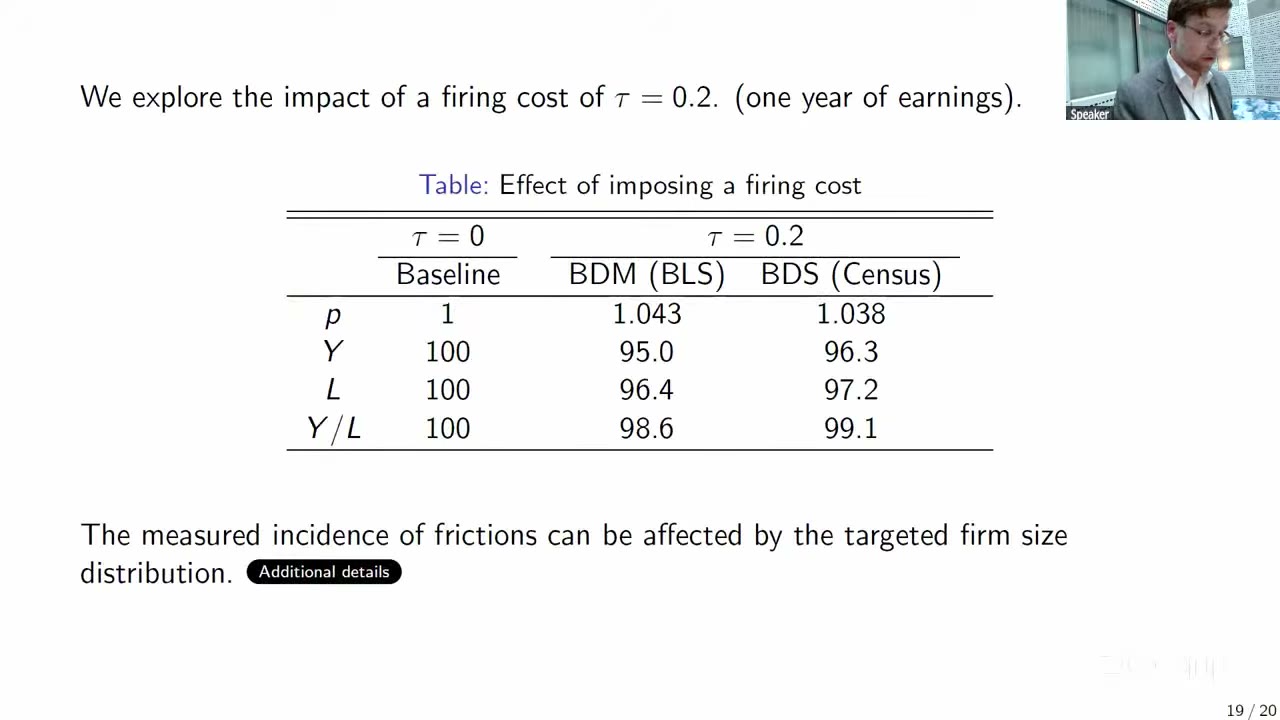
Output falls 5.0% under the bls calibration and 3.7% under the Census one; employment 3.6% against 2.8%; productivity 1.4% against 0.9%. Take that as a transmission result rather than a contribution to firm dynamics — which is how the room took it, and, to be fair, roughly how the paper positions it. Nobody in the room claimed we had learned something new about Hopenhayn–Rogerson. What we have learned is that a decision about which administrative form defines an establishment travels, unimpeded, all the way down to a number an economist would hand a legislator, and moves it by something between a quarter and a half.
Pugsley declines the model and goes after the dates
Pugsley discussed this alongside the Census Frames programme overview and opened with a confession that made the paper’s case better than the paper does: he had hit the same bls-versus-Census entry-rate discrepancy years ago, could not get to the bottom of it, and defaulted to the Census data because it was easier to use. Then, on the model: “I love the Hopenhayn–Rogerson model. I don’t have a lot to say about the Hopenhayn–Rogerson model in this particular paper because I think it’s just an instantiation of something that matters. That depends on the establishment size distribution. So we gotta get the establishment size distribution right.” Asked which frame is correct, he did the thing he says he hates when students do it: “They’re both right to some extent.”
His narrowing move was to split both published series into 1–4 employees and 5-plus. The 5-plus lines track each other closely, even in logs. The 1–4 lines diverge enormously. “Very small establishments are growing really quickly in the qcew frame and they’re not growing as quickly on the census side.” If you work on larger establishments, he said, “I wouldn’t sweat it.” And the title, he thought, is a red herring: the paper “doesn’t read as a critique on declining dynamism. What it tells us is there’s more employment in these small establishments, potentially, and that could be good or bad for efficiency. The problem is that there’s real discrepancies in these publicly facing tabulations that are designed to measure similar things.”
Then the comment that actually has teeth, and it is about a date. State ui tax follows where the work is performed. The Multiple Worksite Report tries to strip remote employees out of worksite counts, but a remote employee in another state generates another reporting unit on the state side, and resyncing that back to “not actually an establishment” is hard — it is “just somebody who is a coder… working in New Jersey but actually living in Michigan.” Remote work has roughly tripled since 2020. And naics 54 and 56, the authors’ second-biggest gap, were early adopters of it. The linked microdata ends in 2016. So the paper’s best evidence comes from before the mechanism that may now be doing most of the work, and Pugsley’s question — “how much of this divergence of small establishments is explained by the changes over time in work arrangements?” — is one the data physically cannot answer. Hyatt had flagged the same suspicion in his own introduction and conceded the same limitation, which is the honest position and also not a defence.
His wish was a challenge: “I’m less interested in the… outcome of a Hopenhayn–Rogerson model that’s matched to a particular establishment size distribution than I am in a user guide for how to harmonize the data. We have these two data sources that are both providing signal, not just one adding noise.” He wants qcew used to enhance the bds, and he thinks the higher-frequency ui flow has more to offer the Frames programme’s geospatial and business frames than just the jobs frame. He also conceded the Census side’s own weaknesses without being asked: timeliness, and the timing of establishment births and deaths.
The floor, where the good stuff was
The chair — addressed by later speakers as Catherine — made two points. First, she was not surprised bls has more establishments, because the frame is not just ui reports; the Multiple Worksite Report is a deliberate effort to enumerate worksites inside a single ui account, which is to say bls is trying to find more establishments and Census is not. Second, and sharper: when do you care about the establishment at all? For productivity and shock response, the object you want may be the decision-making unit, which is the firm. For local development and property taxes, you want where people physically are. Hyatt’s answer was entirely sympathetic — “what are the boundaries of a firm, why do firms matter, what are the boundaries of an establishment” — and amounted to agreeing that the conceptual question is upstream of the measurement one.
A questioner the chair called John produced the best internal puzzle of the session. Build a longitudinally consistent establishment count from the bls flows — pick a base year, add every opening, subtract every closing — and the resulting series is much closer to the Census total than the published bls stock is. So the divergence is not coming from measured births and deaths. Hyatt’s answer was the one moment where you could see the next paper: when a business that already existed responds to the Multiple Worksite Report or the Annual Refiling Survey for the first time, those transitions are suppressed, which is why the flows do not add up to the stock, and the states give lehd what is needed to quantify it. “That’s where the bodies are buried.”
Andrew Reamer of George Washington asked how much of the within-sector difference is just the two agencies putting the same establishment in different naics codes at the four-, five- and six-digit level — noting that in developing the Annual Integrated Economic Survey, Census told omb that naics classifications “can be unnatural or challenging for some businesses,” and businesses self-report. Hyatt: “industry largely agrees, and it agrees except when it doesn’t,” and settling it needs establishment-to-establishment linking rather than the firm-level aggregation used here.
Ryan Decker of the Federal Reserve Board landed the hardest punch, in three parts. One: the 624120 mass is partly an artefact, because those employers were naics 814, private households, until a 2013 qcew decision that was never pushed back through history — “qcew is not a time series, they will tell you if you ask them about that.” Two: these units look like individuals with employer records who behave like nonemployers, roughly one employee apiece, and if we are going to let one qcew classification decision count, what about temp help, dispersed-location construction workers, contractors, remote work? “When we’re gonna go calibrate these models to the firm size distribution, saying okay, well this one decision qcew made, we should probably let that count. But what about all these other decisions?” Three, the elephant: the employer/nonemployer boundary. “I’d be very hesitant to say okay, let’s go with qcew for this firm size stuff or establishment size. I think we have a much bigger mess on our hands.”
Hyatt’s reply was the best line anyone delivered in the session, and it was a correction of himself. “I am gonna say the Census Bureau doesn’t publish seven and a half million establishments. It doesn’t publish eight million. It publishes 32 million establishments operating in 2023” — because if you add employer and nonemployer establishments, and Census does call nonemployers establishments, that is the honest total. A home health aide is one person going to one location, employed by a household reporting the services of the person they employ. “It looks very similar to a nonemployer.”
Nobody disputed the decomposition; the whole room accepted it. What nobody would do is declare a winner. The conference spent two days on the proposition that the United States is losing its ability to count its workers, and this paper is the one that says the workers are fine — both agencies find them, within a few percent, and the residual disagreement runs in Census’s favour. It is the places that have come apart, and the places are a definitional artefact of which tax form an employer happens to file, which state an employee happens to sit in, and a classification decision made in 2013 that was never backdated. The establishment is the unit on which a large share of applied macro rests, and it turns out to be the one thing in the system nobody has ever agreed to define.