Notes on:
Measuring Geopolitical Risk
American Economic Review
2022
geoeconomics · geopolitical risk · text as data · uncertainty shocks · VAR
Paper · doi · PDF
Made with AI: Fable 5.1 (reading and writing)
Dario Caldara and Matteo Iacoviello, both at the Board of Governors of the Federal Reserve. American Economic Review 112(4), April 2022, pp. 1194–1225, doi:10.1257/aer.20191823; the published version was read. Two searches turned up a Simons Foundation lecture by Robert Engle and a talk on the authors’ later inflation paper, neither of which is this paper; no talk recording was found, so this is a pdf-only digest. Tables 1, 2 and 3 and Figures 3, 4, 9 and 10 are cropped from the pdf. A data paper, and the one thing the list keeps from the applied-finance corner of the field.
An index of what the newspapers were afraid of
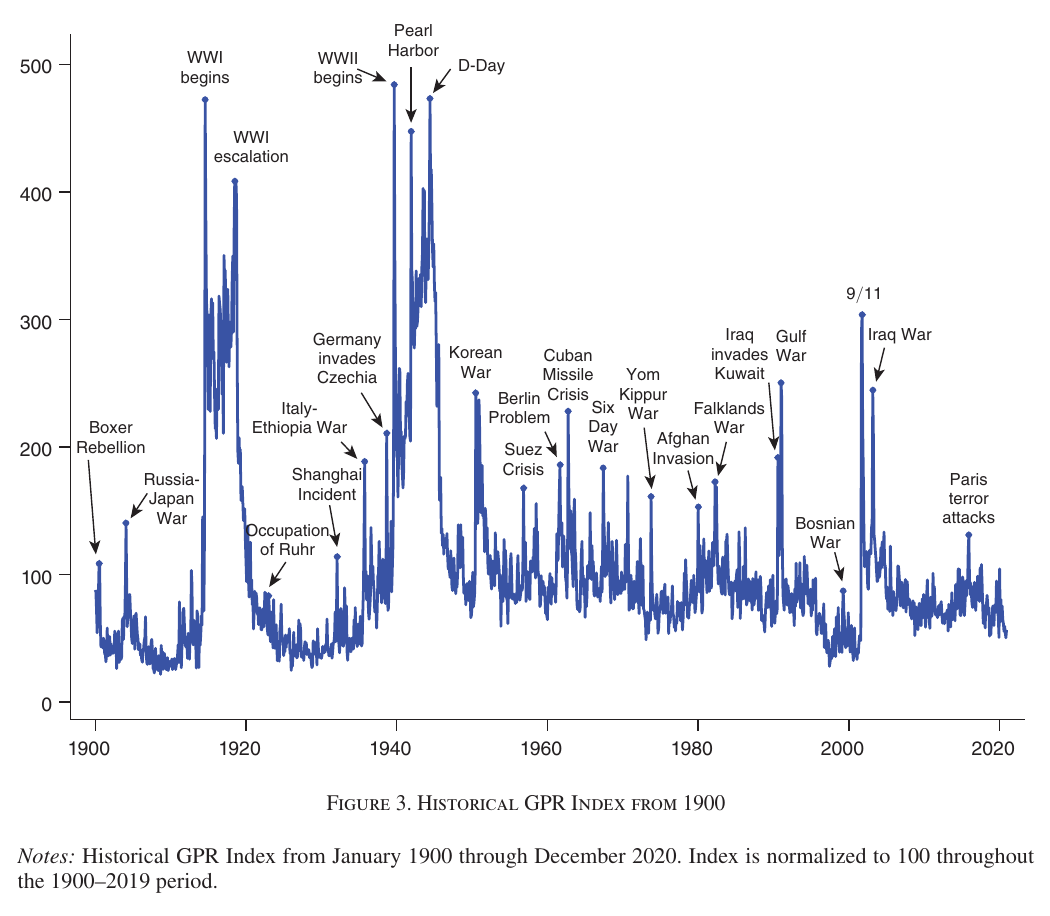
Suppose you want a monthly series for “geopolitical risk” running from 1900 to last Tuesday. No market prices it, no survey goes back that far, and the thing itself is not well defined: is the Cuban Missile Crisis, which never became a war, a bigger reading than the Yom Kippur War? What does exist, continuously and in machine-readable form, is the newspaper. Editors have a fixed number of column inches and allocate them to whatever their readers are anxious about, so the fraction of a month’s articles that talk about war, in the way people talk about war when they are worried about one, is a revealed-preference measure of collective alarm. That is the whole idea. The gpr index is the share of articles in ten English-language newspapers (six American, three British, one Canadian) matching a search query for adverse geopolitical events, monthly and daily since 1985; a historical index does the same on the Chicago Tribune, the New York Times and the Washington Post back to 1900, about 25 million articles in all. Country-specific indices restrict the count to articles that also name the country or its capital, and are therefore, as the authors say plainly, the us press’s view of the risks involving Japan rather than Japan’s view of anything.
The definition behind the query is “the threat, realization, and escalation of adverse events associated with wars, terrorism, and any tensions among states and political actors that affect the peaceful course of international relations” (p. 1197). Footnote 3 concedes that “risk” is therefore a misnomer, since the index counts wars that have started as well as wars that might; the name was kept because that is how the press uses the phrase.
The dictionary is worth understanding, and for a data paper it is worth looking at. The query has eight categories, each a pair of word sets that must co-occur, usually within two words of each other. The first member is a topic: war and conflict; peace and truce; military and troops; a few nuclear bigrams; terror and hostage. The second is either a threat word (threat, warn, fear, risk, concern, and the period-appropriate menace, peril and brink) or an act word (declare, outbreak; attack, invade; bomb, kill, hijack). Five categories use threat words and three use act words, and that split is what later lets the index be pulled apart. One category deserves its own sentence for this list. “Military buildup” pairs the military words with buildup, mobilisation, ultimatum, blockade, embargo, quarantine and sanction, joined by a plain AND anywhere in the article rather than by proximity, and it is the largest single contributor to the index, 23.5 percent of matched articles over the full sample and 25.8 percent since 1960; the peace category likewise counts boycott among its disruption words. Sanctions, embargoes and blockades therefore sit inside the threats half of the query, which is where a geoeconomics reader would want them and worth remembering whenever the threats index is glossed as fear of war. An exclusion list drops articles mentioning movies, museums, anniversaries, obituaries, sport, “price war,” real estate and tax, where the audit found the false positives. The words were chosen because they are the words that appear on tense days: “crisis” shows up in 0.25 percent of text on high-tension days against 0.04 percent on an ordinary one. The result is normalised to average 100 over 1900–2019 (historical) or 1985–2019 (recent).

Why you should believe a word count
About a quarter of the paper checks that the count means something. The authors and a team of assistants read every above-the-fold headline on 44,000 New York Times front pages from 1900 to 2019 and scored each day 0, 1, 2 or 5 by whether geopolitical tension was absent, present, the lead, or the banner; this narrative index correlates 0.86 with the automated one. A human audit of more than 7,000 sampled articles correlates 0.93 with it at annual frequency, and alternative dictionaries (no exclusion words, core words only, plain AND instead of proximity) all do worse. us-only and non-us-only indices correlate 0.88. Against outside data, the index correlates 0.82 with worldwide conflict deaths (0.83 for the acts component, 0.46 for threats) and 0.29 with Ramey’s (2011) military spending news, and it is not Granger-caused by industrial production, private employment, oil, stock returns, the two-year yield, the vix or the epu index.
Two things the audit turns up matter more than the correlations. The index is higher in nearly every post-1945 year than in any interwar year while deaths are low, which the authors read as the world wars having made humanity “more attentive to the risks posed by armed conflicts”; and the mean of the log index breaks upward in September 2001, driven by reporting on terrorist threats and the war on terror. The authors say they cannot tell whether that reflects more risk or more perception of risk, and call the difference “an important question for future research.” They also concede that a story unfolding over years and recognised as geopolitical only in hindsight, such as the fall of communism, may not be measured properly. Attention has its own dynamics.
Threats and acts are different series
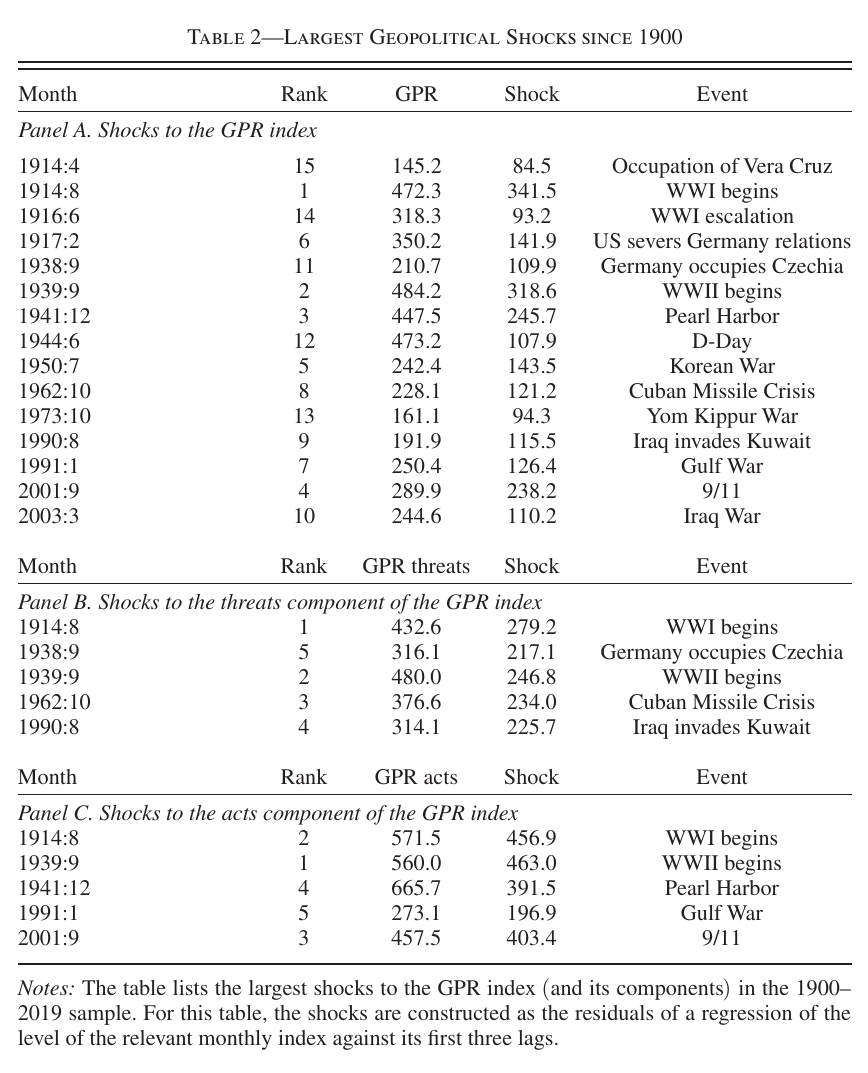
The split that makes the paper useful to this list is the one between the five threat categories and the three act categories, which give a threats index (gpt) and an acts index (gpa). The two correlate 0.59 over the full sample and only 0.45 since 1985, and the distinct part is where the history lives. World War I is the clearest case and worth stating exactly, because it is easy to state backwards. Nothing in the threats index anticipates it: the series is flat through the first half of 1914, and the authors describe the war’s beginning as appearing “largely unexpected.” Then August 1914 registers as the single largest threat shock of the whole 1900–2019 sample and the second-largest act shock, in the same month. After that the two series part company. Acts stay elevated for four years while threats fall back and stay subdued, with one exception, a spike in February 1917 when the United States severs diplomatic relations with Germany, two months before it enters the war. The war frightened the press once, on arrival, and thereafter the papers reported fighting rather than the prospect of it. World War II is the opposite shape: the run-up is all threats, rising through the occupation of Czechoslovakia, and then acts spike at the outbreak, at Pearl Harbor and around D-Day.
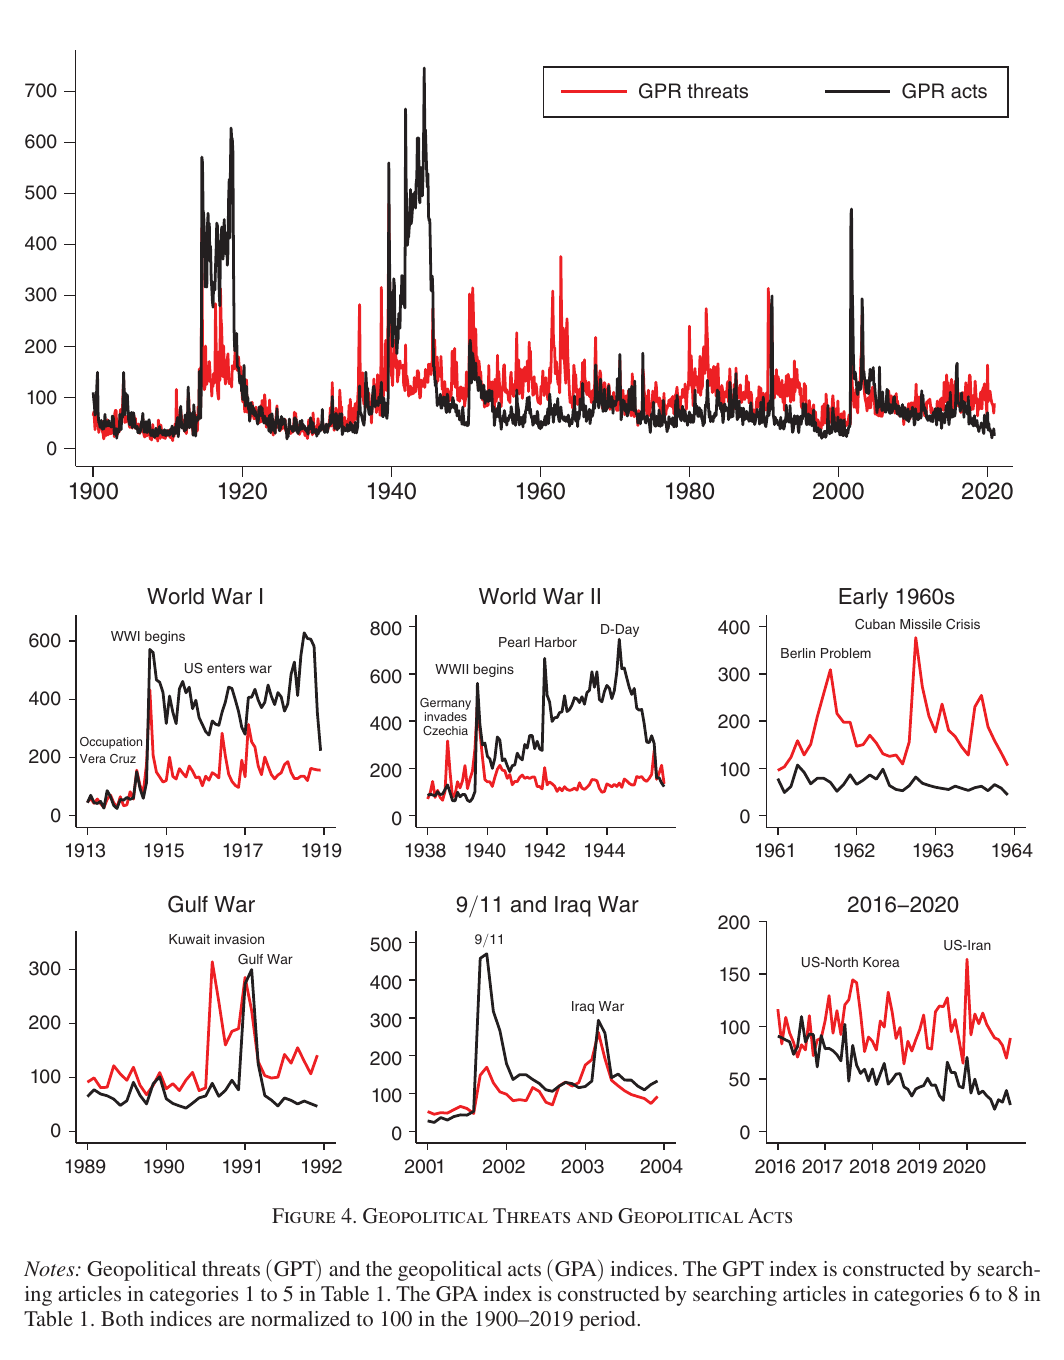
The 1960s are threats with nothing behind them: the Berlin crisis and the Cuban Missile Crisis are large threat shocks and no act shock at all. The missile crisis, thirteen days long and slow to reach the front page in its first week, is among the three or four largest threat shocks of the 120 years; the paper’s Table 2 puts it third, behind the outbreaks of the two world wars, and the text on p. 1205 says fourth, and the two are not reconciled. Either way it is only eighth on the headline index, which is the point: the split sees what the aggregate blurs. The Gulf War is threats in August 1990 and acts in January 1991; the recent us–North Korea and us–Iran tensions register on threats alone.
What a shock to the index does
The macro evidence is a quarterly eight-variable var on 1986:I–2019:IV: log gpr, the vix, real business investment and private hours per capita, the real S&P 500, real oil, the two-year yield and the Chicago Fed’s financial conditions index. Identification is a Cholesky ordering with gpr first, which says that any contemporaneous correlation between the index and the economy runs from the index to the economy; the Granger tests and the index’s indifference to recessions and elections are the paper’s case for that. The shock is two standard deviations, calibrated as the average innovation in the right 10 percent tail, so it is a typical bad quarter rather than a world war.
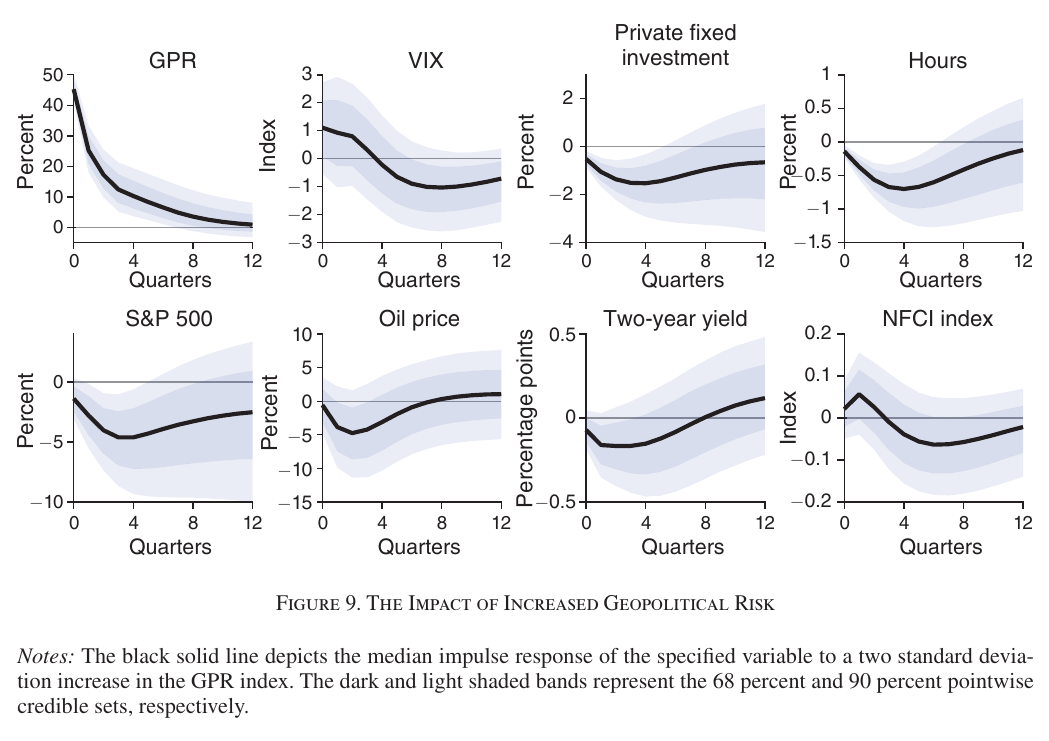
The index rises and stays up for nearly two years. Investment declines gradually and bottoms about 1.5 percent below trend after a year; hours fall 0.6 percent; stock prices and oil fall, the two-year yield dips a little, and the vix rises briefly. Adding gdp to the system gives a 0.3 percent drop over the first year (footnote 17).
Then they rerun the system with the acts and threats indices in place of the aggregate, acts ordered first, so an act can move threats on impact but not the reverse. An act shock produces a sharp rise in threats; a threat shock produces a small and brief rise in acts. Both lower investment and hours by similar amounts, the act response being more persistent. The move that matters is a counterfactual: after an act shock, feed in the threat shocks that would keep the threats index flat, and see what is left. In the authors’ words:
Were threats to remain unchanged in response to an acts shock, the response of investment and hours would be smaller, thus supporting the notion that unrealized threats about future events could have contractionary effects. This result is corroborated by the decline in activity associated with increases in threats, keeping acts unchanged.
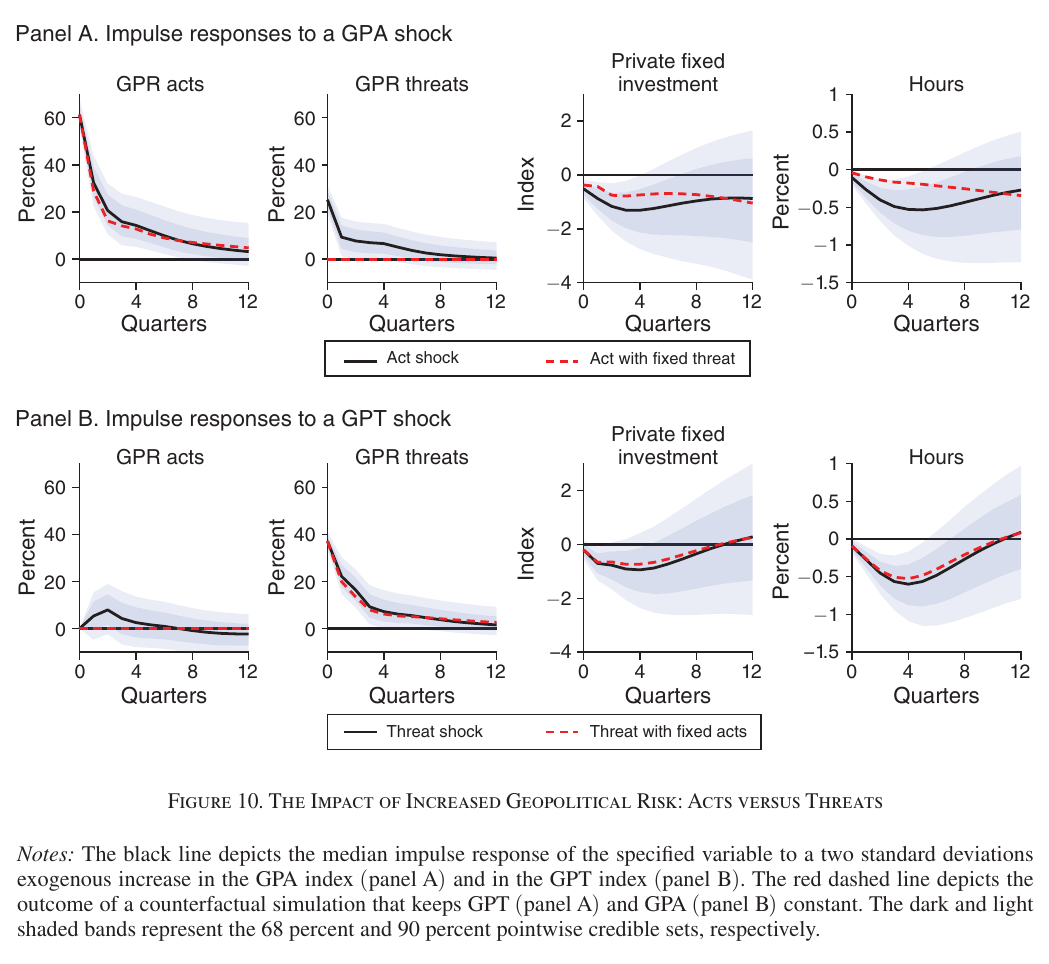
Panel B is the picture the list cares about. A rise in the threats index with acts held flat, a quarter in which the papers are full of what might happen and nothing does, still lowers investment and hours by nearly as much as the unconstrained shock. The authors connect this to models where agents plan against a worst case (Ilut and Schneider 2014) or reassess macroeconomic tail risk when threatened with an adverse event (Kozlowski, Veldkamp, and Venkateswaran 2019), and add that with the exception of 9/11 almost nothing in the sample hit the United States directly, so this is the response of a country that mostly watches.
The long panel, and the firms
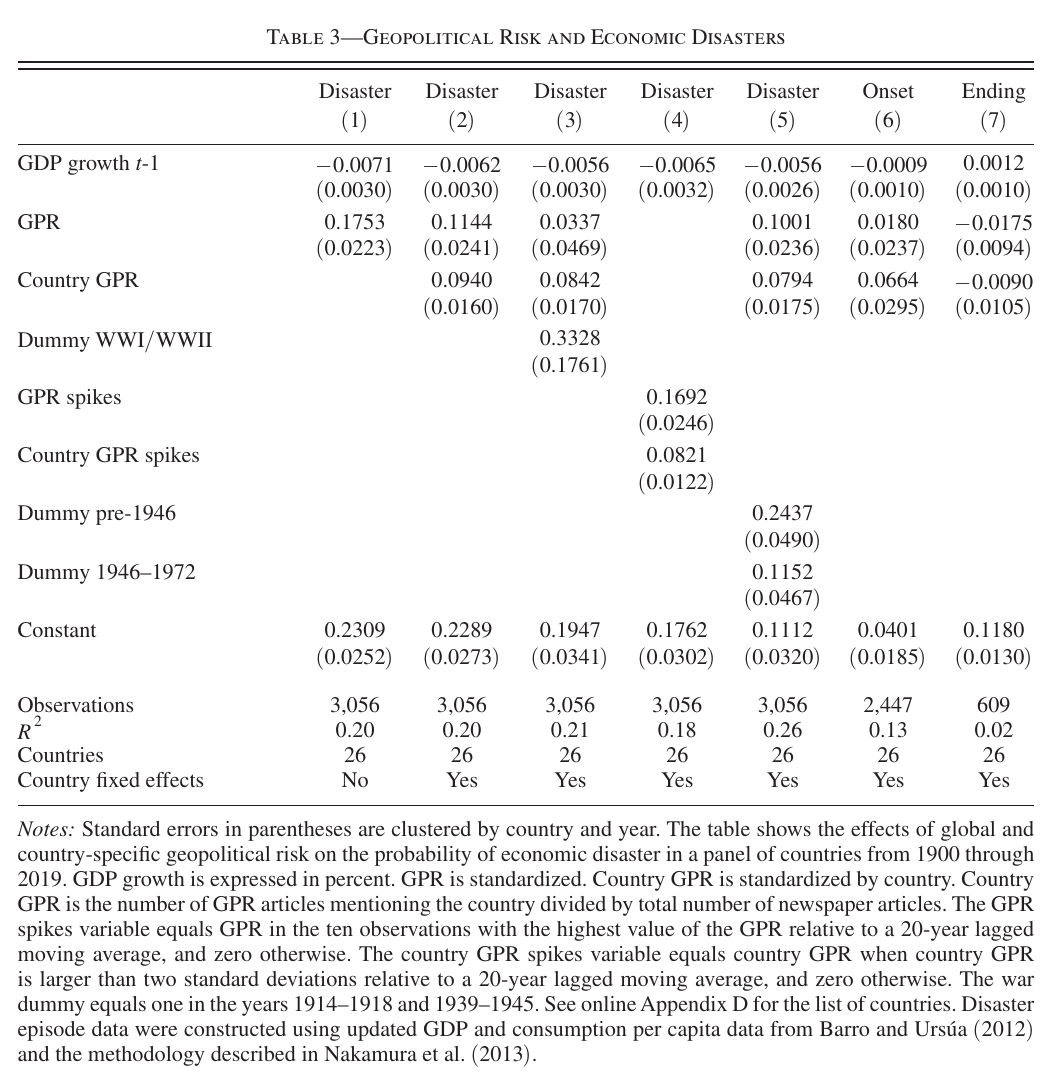
In a panel of 26 countries over 1900–2019 the authors regress a disaster dummy, built with the Nakamura–Steinsson–Barro–Ursúa (2013) procedure, on the global and country-specific indices,
(eq. 1 in the paper), where is one in a disaster year, is the global index, the country-specific one, and a country effect. Without fixed effects a one-standard-deviation rise in global gpr raises the probability of disaster by 18 percentage points against a base rate of 17 percent; with fixed effects and a world-war dummy the global coefficient loses significance but the country-specific one survives, and a one-standard-deviation rise in country gpr takes the probability of a disaster starting from 2.2 percent to 9. At the firm level, industries whose stock returns fall most on days the index jumps cut investment about a percentage point more than unexposed industries, and an index built from earnings-call mentions of geopolitical risk, purged of aggregate and industry components, predicts a decline in the firm’s own investment of more than 1 percent at the trough. The earnings-call aggregate correlates only 0.19 with the newspaper index, which the paper reports as reassuring; on a short sample it is a modest reassurance.
What the index is and is not
It is an attention series. Nobody in the paper threatens anybody; there is no state choosing whether to invade, no target deciding whether to comply, and the “shock” is a residual. What the var delivers is the average response of the us economy to a quarter in which the newspapers got more frightened, and the threats-versus-acts split turns that into something the theory papers can use: a threat that is never carried out shows up in investment and hours about as much as one that is. That is the reduced form of the claim the interdependence papers make in structural terms, that the value of a geoeconomic instrument lies in the off-equilibrium threat rather than its exercise, and it is the one place on the list where the claim is read off the data rather than derived. The same reading fixes the caveat. An index that cannot say who threatened whom, or why, or what the threatened party did about it, can establish that off-path threats are costly; it cannot say whether they work, and the perception-versus-risk problem the authors flag means the threats series may partly be measuring the press rather than the threat. The post-2001 level shift is the visible instance.
Where it sits
Data, opening sub-block 3.3 on geopolitics as a macro shock, and the one survivor of a large applied-finance literature that regresses oil, equity and crypto volatility on the index. That literature was left out as a strand: it is a toolkit in which the gpr is a regressor and no paper is committed to a claim about geopolitics. The index stays because the block needs a shock series, and the paper that follows it, Ambrosino, Chan, and Tenreyro (2026), treats fragmentation as exactly such a process, without a strategic agent, which is why both are geoeconomic macro rather than geoeconomics in the narrow sense. It is the third text-based measure on the list, after the trade policy uncertainty index (Caldara et al. 2020) in block 1 (same machinery, same finding that threatened tariffs cut investment before any are enacted) and the Geoeconomic Pressure measure (Clayton et al. 2025) in block 2. Read Section I for the construction and Section III for the var, and download the series, which the authors keep updated on Iacoviello’s own website. Two economists at the Federal Reserve Board maintain, on a personal web page, a count of how often “war” appears within two words of “fear”; the ecb, the imf and the World Bank track it; and the authors’ own footnote says the name is wrong.