Notes on:
The Safe Assets Shortage Conundrum
Journal of Economic Perspectives
1 August 2017
safe assets · interest rates · zero lower bound · international monetary system
Paper · doi · PDF
Made with AI: Opus 5.5 (reading and writing), GPT 6.1-Sol (reading), Fable 5.1 (adjudication), GPT 6-Astra (verification)
Ricardo J. Caballero, Emmanuel Farhi and Pierre-Olivier Gourinchas, “The Safe Assets Shortage Conundrum”, Journal of Economic Perspectives 31(3), Summer 2017, pp. 29–46. No talk; written from the published version. No recorded talk or discussant was found, so this explainer comes from the paper alone.
Caballero, Farhi and Gourinchas argue that the world economy has a market whose price can no longer move, and that the market therefore clears through output. The market is for safe assets, and the price is the safe real interest rate. The paper is a jep survey, so it has no model of its own. It is a tour of a decade of the authors’ formal work (the safety-trap paper with Farhi (2017), the currency-wars (2015) and aer P&P papers with all three), with three exhibits and a long, honest list of policy fixes, each of which costs something.
What counts as safe, and who can make it
The definition is deliberately narrow: a safe asset is “a simple debt instrument that is expected to preserve its value during adverse systemic events.” The interesting word there is expected. The authors pile three ideas into the definition. Safe assets are information-insensitive (Dang–Gorton–Holmström 2015), so you can trade them without doing any analysis. They are simple, which matters when the crisis is complex (Caballero–Simsek 2013). And safety involves a strategic complementarity: “an asset is safe if others expect it to be safe.” So safety is partly an equilibrium selection, which is a nice property for a store of value right up until everyone selects the other equilibrium. Reputation and history are what keep you in the good one, and that is why supply is concentrated. Making safe assets takes a deep financial system, a sovereign with fiscal capacity and a central bank with a record on prices and exchange rates. Few countries have all three, and the main one is the United States.
From there the imbalance is close to arithmetic. Demand for safe stores of value scales with world output. Supply scales with the output of the issuers, who grow more slowly than the high-saving emerging economies (China, mostly) that drive world growth. “If demand for safe assets is proportional to global output, this shortage of safe assets is here to stay.” Reserve accumulation, regulation and demographics add to the demand side.
The price adjusts until it can’t
In normal times, a market with excess demand raises the price. Here that means safe real rates falling, as they have since the 1980s, and emerging-market savers buying American safe assets, which is the authors’ account of the global imbalances (an update of Bernanke’s (2005) savings glut that singles out the safe part of the asset shortage). The signature they look for is that the safe rate falls while the expected return on risky assets does not.
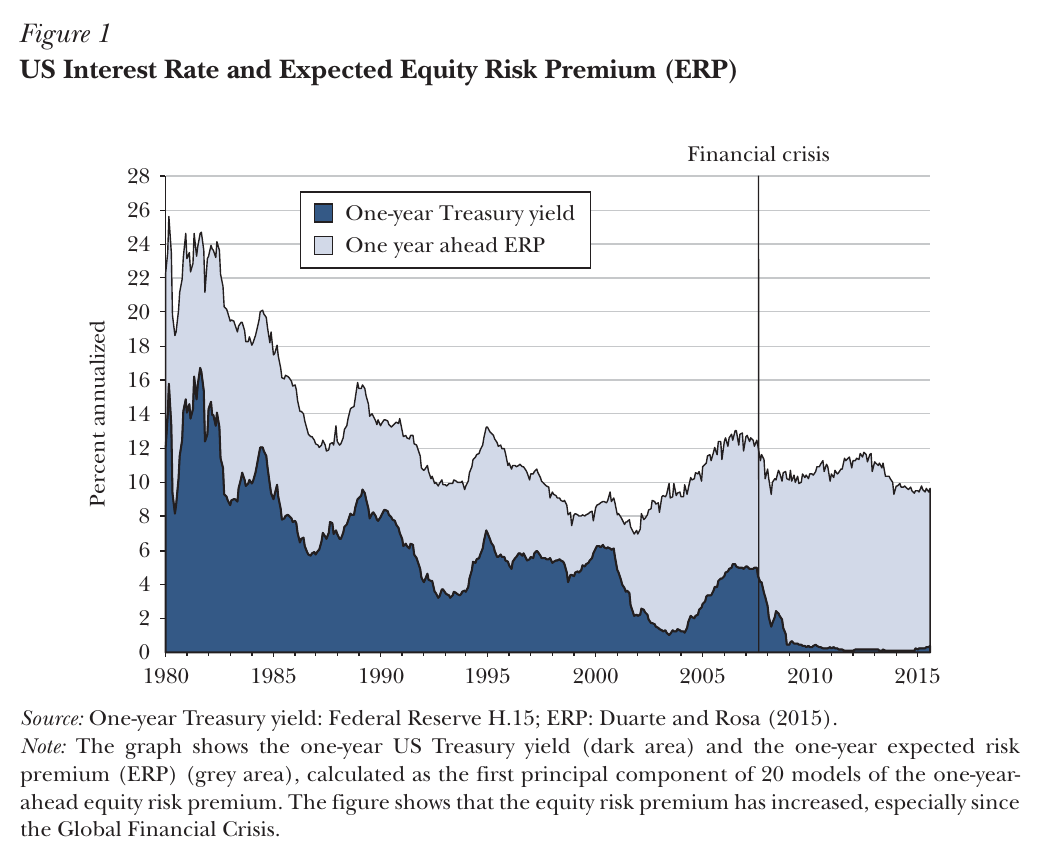
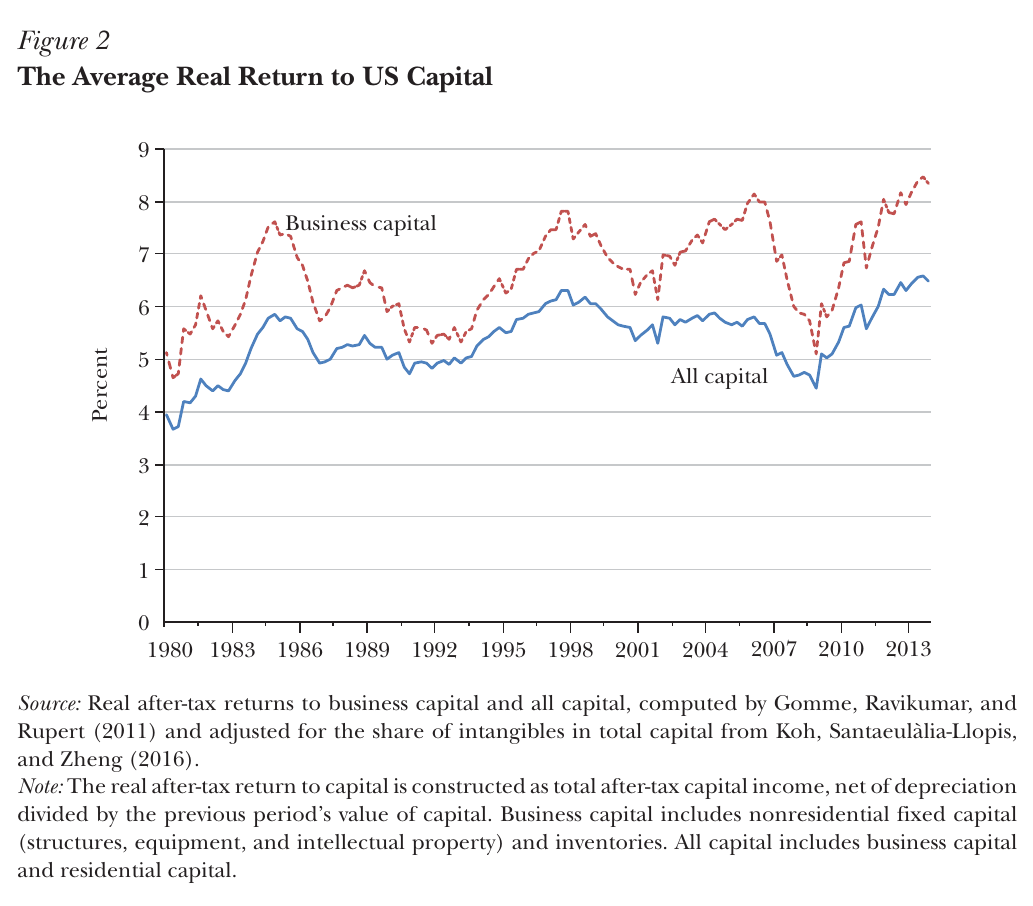
Figure 1 is the main piece of evidence. The one-year Treasury yield trends down and goes to zero in the crisis. The expected return on equity, which is the top of the stacked chart, follows it down until the early 2000s and then levels off. The gap, the equity risk premium, is “particularly salient after 2002, and even more so since the beginning of the Great Recession”; on my reading of the chart it is about ten points after the crisis. (The dark area is a nominal yield, so don’t read it as the natural real rate.) Figure 2 makes the same point with accounting returns: the real after-tax return to us capital “remained remarkably stable” while safe rates collapsed. A footnote cites Del Negro, Giannone, Giannoni and Tambalotti (2017), who find that the decline in the us safe real rate came mostly from a rising safety-and-liquidity premium on T-bills. Another footnote admits the one thing that fits awkwardly: some credit spreads compressed. The authors guess this is reach-for-yield by intermediaries bound by mandates, the kind of positioning that later snaps in a risk-off episode.
So the price did adjust, and for a while the market also produced more supply. In the 2000s the shortage paid American finance to make “private label” aaa securitizations, and it let Greece and Italy borrow as if they were Germany. Naive investors treated these pseudo-safe assets as safe, which eased the shortage and slowed the fall in rates. Then the subprime and euro crises took their safe status away all at once. That hit both sides of the market: supply shrank and, because everyone was deleveraging, demand rose.
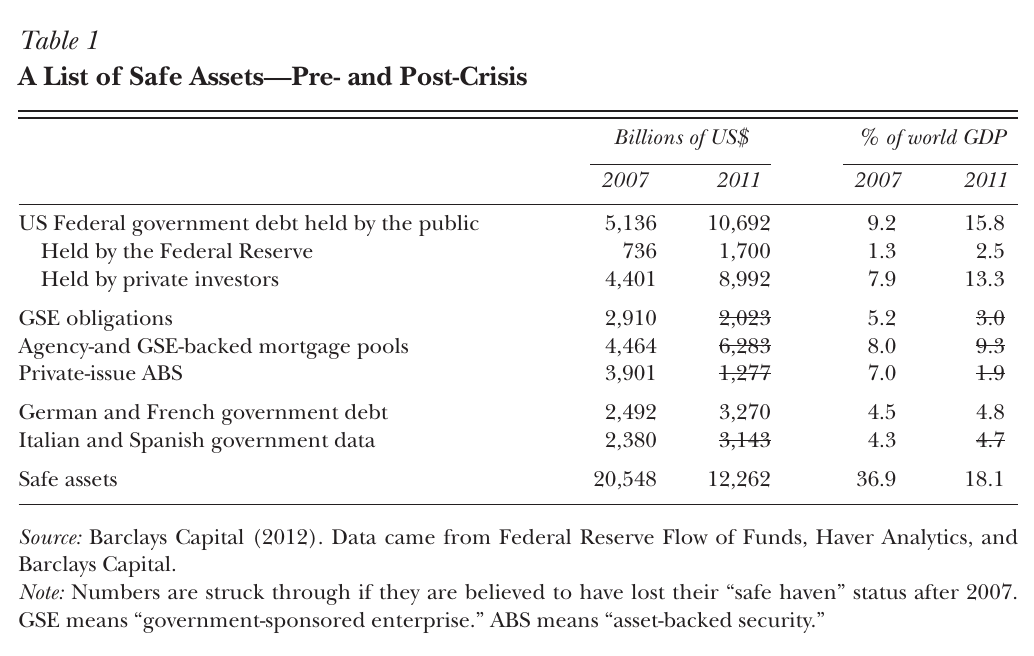
Table 1 sizes the hit. On Barclays’ (2012) count, safe assets were $20,548bn in 2007, or 36.9% of world gdp, and $12,262bn in 2011, or 18.1%. The strikethroughs need careful reading. They do not mean the debt went away. Agency mortgage pools grew from $4,464bn to $6,283bn, and Italian and Spanish debt from $2,380bn to $3,143bn. They mean the debt stopped counting as safe. By 2011 only privately held Treasuries ($8,992bn) and German and French debt ($3,270bn) are left in the total, and those two do add to $12,262bn. The safe-asset stock halved without anyone defaulting on most of it. (The row for Italy and Spain is labelled “government data” in the original, a typo. The authors also call the classification rules behind all such counts “somewhat crude”.)
The safety trap
This is the mechanism. The crisis pushed the natural safe rate, the real short rate consistent with full employment, “well below zero.” Nominal rates were already low, so they could not follow (the effective lower bound need not be exactly zero, and the authors also mention Brunnermeier and Koby’s (2018) “reversal rate”). When the price is stuck, the quantity moves. Excess demand for safe assets remains until income and wealth fall far enough that people want fewer of them. Households keep saving at a safe rate that is too high, firms facing weak demand and high risk premia hold back investment, and the paper’s summary is that “equilibrium is achieved through recession.”
The authors separate this from a liquidity trap, and the difference matters for policy. A liquidity trap is excess saving across all assets. A safety trap is excess demand for safe assets specifically, so the only ways out are more safe supply or less safe demand, and a policy that leaves the safe stock unchanged achieves little. It is also stickier. In a liquidity trap without risk premia, long-lived assets become very valuable as rates approach zero, and that revaluation creates enough supply to end the shortage. In a safety trap the risk premium caps the revaluation, so the trap can last a long time or be permanent. With some price flexibility it “can also trigger” deflation, which raises real rates further.
In an open economy the shortage spreads through capital flows until safe rates are equal everywhere. Once the global lower bound binds, world output does the adjusting and monetary policy can no longer insulate a country from capital flows. Surplus regions like the eurozone export their weak demand, and the us absorbs it. Even with us and uk output gaps nearly closed by 2016 (−0.42% and −0.17% by the imf’s estimate), the authors expect “recurrent global safety traps”: any new scarcity anywhere can bring one back.
The escape valves, and what each one costs
The first valve is the exchange rate. If the safe-asset rate can’t fall, the safe asset can still get more expensive for foreigners if the dollar rises. To keep up with the trend, the issuer’s currency has to appreciate at least as fast as the growth gap between non-issuers and issuers. The cost falls on the issuer’s exporters: net exports fall, “and potentially output”. This is the authors’ “paradox of the reserve currency.” Away from the lower bound, reserve status is the exorbitant privilege of cheap funding. At the lower bound, it means the rest of the world sends you its demand for safety and its recession along with it. The authors read the recent period this way: us accommodation in 2008–2014 “was associated with” a weaker dollar, and then the Bank of Japan’s purchases in 2013 and the ecb’s in late 2014 pushed the burden back to the us. Their general claim is that at very low rates, safe assets are a global public good whose benefits the issuer does not internalize, so you get both under-issuance and beggar-thy-neighbour devaluations. The us, they say, “has clearly experienced the short end of this bargain.”
The second valve is public debt. Its appeal is that a safe sovereign borrowing while is well below seems to have little cost. The authors call this “fragile and even bubble-like”: it carries rollover risk, it is exposed to coordination runs, and if demand for safety suddenly fell, issuers “could rapidly face exploding and unsustainable debt dynamics.” It is limited by fiscal capacity, meaning the believed ability to raise future taxes if the crisis lasts. On the authors’ account a substantial share of the Table 1 collapse was large eurozone sovereigns losing that belief. This is the modern Triffin (1960) dilemma: world demand for an issuer’s debt grows faster than the issuer. The authors still conclude that, because of the public-good externality, core economies are probably under-issuing. Two complements follow. One is tranching pools of quasi-safe sovereign debt into a safe senior claim (ESBies (2017), or imf-run tranching of emerging-market debt). The other is publicly funded infrastructure, which raises issuer growth and fiscal capacity “with maximum issuance of safe asset per unit of installed capital.” New issuers would help too, but China is “a few decades away,” and having several issuers creates the risk of self-fulfilling switching between them.
The third valve is private supply, which has already been tried, so the authors are wary of it. Firms can make themselves safer by paying steady dividends and buying back shares instead of investing, which helps the shortage and does nothing for investment. Finance can build safe tranches from risky pools, and overcollateralization works in principle. But the private sector’s ability to insure a truly systemic event “is limited,” and even senior tranches keep some tail risk, which makes them unstable “in the absence of an explicit public insurance overlay.” The 2000s produced micro-aaa assets, not macro-aaa ones. The suggested fix is that banks keep producing safe short-term claims but buy tail-risk insurance from the government, which runs back into fiscal capacity.
The fourth valve is reducing demand, and this is where the paper says something central bankers may not like.
Quantitative easing may make it worse
Central banks hold an enormous amount of safe assets. Of the $18 trillion of us Treasuries outstanding, more than 30% sits at central banks, two-thirds of that at foreign ones and one-third at the Fed. Major central banks’ total assets rose from about $6 trillion in 2008 to $16.3 trillion by 2016. Emerging-market reserves are expensive self-insurance against sudden stops, and swap lines, imf facilities and reserve pooling could do part of the job (the Fed’s crisis swap lines get credit for containing contagion).
qe is the harder case. The authors point out that qe is not insurance. It is a policy to compress spreads after the shock, and nothing requires it to buy safe assets. If a safe-asset shortage is the main cause of the slump, and the people demanding safety cannot easily move into risk, a central bank buying Treasuries is removing the scarce good from private hands, and that “may aggravate the problem.” What matters is the composition of the purchases. Swapping private risky assets for public safe ones, as in QE1 (December 2008 to March 2010) or the eurozone ltros from late 2011, adds safety to private portfolios and stimulates. Swapping long government bonds for short ones, Operation Twist style, they call “ineffective or even counterproductive,” and they list QE2 (November 2010 to June 2011) and QE3 (September 2012 to December 2013) as examples. The better policy is to buy risk: the Fed’s mbs, the BoJ’s equities and real-estate bonds. Developed-market central banks “should not be hoarding assets that have a large safe asset component beyond those required for the conduct of conventional monetary policy.” Basel III gets similar treatment: by raising mandated safe holdings for banks and insurers it was “well-intentioned but perhaps shortsighted.”
The evidence for all this is thin, and the authors don’t hide it. The paper has no causal estimate of how much of the recession the shortage caused, no welfare ranking of the four valves and no threshold for fiscal capacity. The exhibits describe and the mechanism is borrowed from the formal papers. The qe classification is presented as an implication of Caballero–Farhi’s model, not something estimated here.
The authors end with a list of symptoms to expect: very low safe rates, “bubbly expansions of seemingly safe assets,” recessions, and episodic sharp appreciations of core currencies. In other words, the next crisis will look like the last one. Before that, someone will again find a way to make aaa paper from things that aren’t safe, and for a while the market will be glad to buy it.