Notes on:
Finance and Development: A Tale of Two Sectors
American Economic Review
1 August 2011
financial frictions · development · TFP · misallocation · entrepreneurship
Paper · doi · PDF
Made with AI: Opus 5 (reading, diagram and writing), GPT 5.6-Sol (reading), Fable 5 (adjudication), GPT 6-Astra (verification)
Francisco J. Buera, Joseph P. Kaboski and Yongseok Shin, “Finance and Development: A Tale of Two Sectors,” American Economic Review 101(5), August 2011, pp. 1964–2002 — read in the published article. There was no talk and no discussant; this digest is from the paper alone.
The threshold, not the price
You have an idea. Suppose it is a good one, and suppose you are poor.
In the version of this story most people carry around, what happens next is about interest rates. The bank charges you more than it charges a rich person, you build a somewhat smaller business than you otherwise would, and the wedge between your cost of capital and his is the friction. In Buera, Kaboski and Shin’s version, nobody quotes you a bad rate at all. Instead the lender does a piece of arithmetic on your behalf: if he hands you capital, you can produce with it and then simply refuse to pay, keeping some fraction of the revenue and the machines. The only thing he can do about it is seize the deposits you left with him. So he lends you up to the point where reneging is not worth your while, and not one unit further. Your credit limit is a function of your wealth. It is not a price. It is a threshold, and you either clear it or you do not.
Whether you clear it depends entirely on how big a business you were planning. If the idea is a hair salon, the capital you need is small and the threshold is low. If the idea is a plant, the capital is large, the threshold is high, and you are out — not operating at 70 percent of efficient scale, just out, waiting, saving. This is the whole paper in one observation: a single national parameter for how well courts enforce contracts is not experienced nationally. It is experienced as a tax on scale, and since some industries are intrinsically bigger than others, contract-enforcement law functions as an industrial policy that nobody legislated. In this model it happens to be an industrial policy against manufacturing.
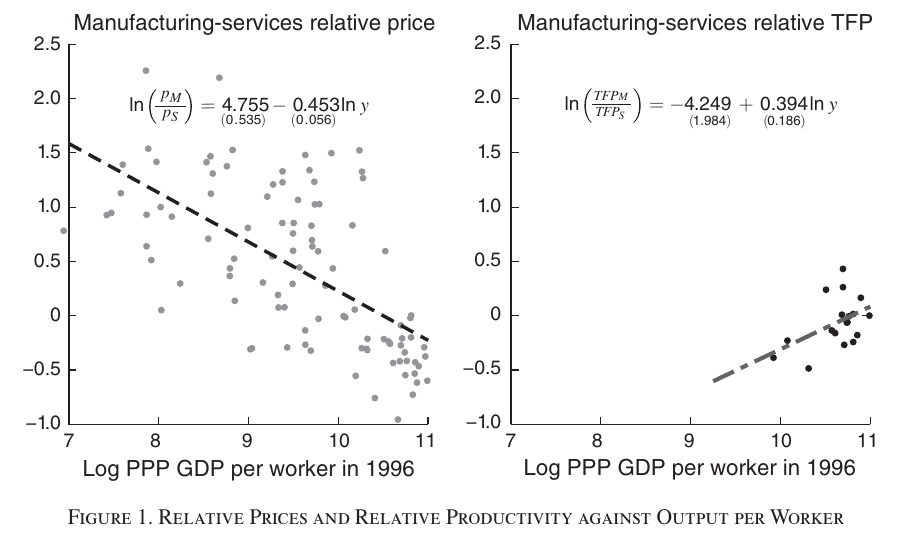
Anyway. The paper opens with two pictures of the world it wants to explain. Poor countries pay a lot for manufactured goods relative to services: regressing the log manufacturing-to-services relative price from the 1996 icp on log ppp output per worker across 102 countries gives a slope of −0.453 with a standard error of 0.056 and an R² of 0.40. Under constant returns and equal factor shares, a relative price is the inverse of a relative productivity, and the sectoral tfp data agree — but only where they exist. For the 18 oecd countries in the ggdc Productivity Level Database (Inklaar and Timmer 2008), log relative manufacturing-to-services tfp on log output per worker gives 0.394 with a standard error of 0.186 and an R² of 0.22. That is a near-mirror of −0.45, which is comforting, and it is also 18 rich countries, which is not. The authors say so themselves, in a line worth keeping: no direct sectoral productivity evidence exists for the vast majority of poor countries, and “the absence of such evidence is made conspicuous by the large tracts of emptiness in the right panel.”
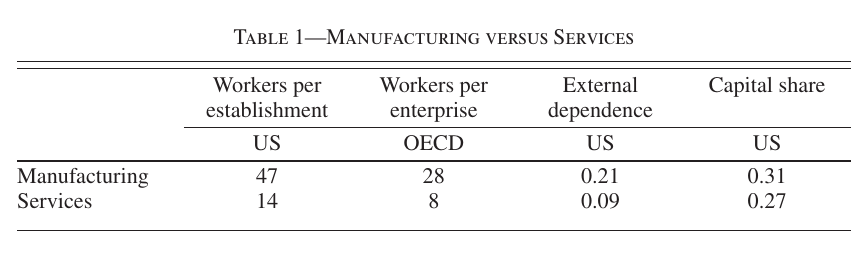
The second picture is the one that makes the mechanism measurable. In the 2002 us Economic Census, the average manufacturing establishment has 47 workers and the average service establishment 14, a ratio of 3.4. In the oecd’s structural statistics for the same year, measured per enterprise, it is 28 against 8, a ratio of 3.5. Manufacturing firms are also about twice as dependent on external finance by the Rajan–Zingales (1998) measure, 0.21 against 0.09, while their capital shares of gross output differ hardly at all, 0.31 against 0.27 — which is the paper’s licence to build a model where the sectors differ in exactly one thing.
The model
There is a measure of infinitely-lived people. Each carries wealth and a pair of entrepreneurial talents, one for each sector, and each period picks whether to work for a wage or run a single establishment in services or manufacturing. Talent dies at a constant hazard, at which point a fresh pair is drawn — which is what keeps generating a need to move capital and labour from yesterday’s good entrepreneurs to today’s, and therefore what makes a financial system worth having. Talent is inalienable: there is no market for managers, so a good idea attached to a poor person cannot simply be sold to a rich one. Financial intermediaries are competitive and earn nothing, so the rental rate on capital is the interest rate plus depreciation.
The friction is the enforcement condition, and it is a static one because a defaulter is back in the credit market next period with a clean record:
The left side is what an entrepreneur of talent and wealth keeps by honouring his obligations at price , rental rate and wage ; the right side is what he keeps by reneging and walking off with fraction of revenue net of wages plus undepreciated capital, forfeiting only his deposits — and the binding version defines the rental ceiling , increasing in wealth, in talent and in . That is equation 2 in the paper, with Proposition 1. Note what is: one number, running from autarky at zero to perfect credit at one, indexing legal quality for the whole economy. It is not sector-specific. The ceiling is, because technology and prices are.
The sectors differ in one parameter, a per-period fixed cost paid in units of that sector’s own output, with . Since production has diminishing returns in capital and labour, a positive fixed cost makes the technology non-convex — viable only above a minimum scale — so a bigger fixed cost means a bigger efficient establishment, which means a bigger capital requirement, which means a higher threshold to clear. And because agents are forward-looking, they have a second route: save. Self-financing is a partial substitute for credit, and it is easier the smaller the target. In services you save your way past the ceiling quickly; in manufacturing the amount you must accumulate before entry is worth it is large, so entry is delayed rather than merely undersized. The occupational problem is where those two forces meet:
That is equation 5 in the paper: the value of running an establishment in sector , compared each period against being a worker or switching sectors, with talent surviving at rate , the fixed cost due in every period of operation, and next period’s wealth as the self-financing margin that widens tomorrow’s ceiling.
One more piece, and it is the piece that makes the asymmetry a measurable object rather than a free hand. In the perfect-credit benchmark, under mutually independent Pareto talents with a common tail parameter and with active entrepreneurs a small fraction of the population — about 5 percent in the calibration — the paper derives an approximate closed form:
The ratio of average establishment sizes across sectors equals the ratio of fixed cost plus wage. That is Proposition 3, and it is the logic — approximate, and only in the frictionless benchmark — by which an observed 47-versus-14 employment gap tells you something about unobservable fixed costs.
Calibration, which is a fit and not a test
Eleven parameters. Four are set outside the exercise to conventional values: risk aversion 1.5, the elasticity of substitution between manufactures and services 1.0, depreciation 0.06, and the capital elasticity chosen to deliver an aggregate capital income share of 0.30 — deliberately low, the authors say, so as not to inflate the role of capital misallocation. The remaining seven are calibrated jointly to seven us moments, and the sectoral asymmetry falls out as against , the latter about three times the equilibrium wage.
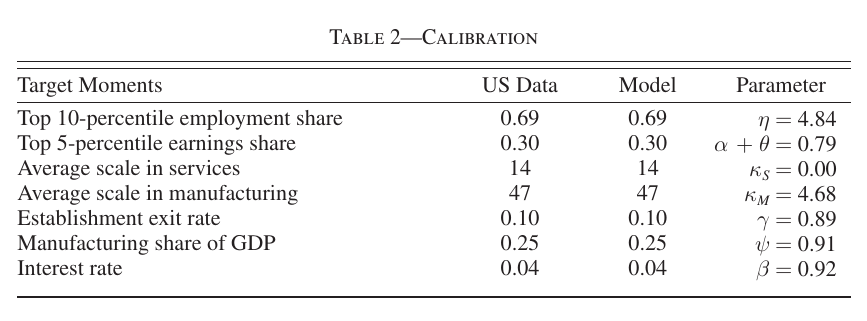
Every model column in that table equals its target exactly, which is what a seven-on-seven joint calibration is for and is not evidence of anything. The one genuinely over-identifying check on the financial side is that external finance to gdp comes out at 2.3 in the calibrated perfect-credit equilibrium against 2.5 in the us data — which matters more than it looks, because has no empirical counterpart, so every result in the paper is plotted not against but against this endogenous ratio.
What varying one dial does
Thirteen values of from zero to one, spanning model external finance to gdp from 0 to 2.3. In the data the ratio averages 0.1 in the bottom quintile of countries by output per worker and 2.1 in the top. Model quantities are computed at common fixed prices unless stated.
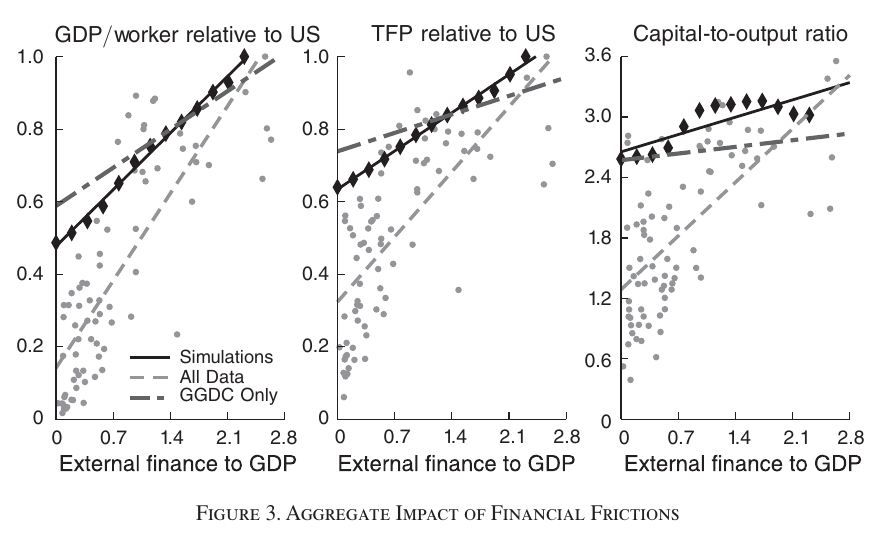
Going from perfect credit to autarky cuts model output per worker by 52 percent — to less than half, comparable to the Malaysia–us gap, or about 80 percent of the us–Mexico gap. Model aggregate tfp falls 36 percent. The capital-output ratio at common prices falls 15 percent, and that decline is almost entirely the relative price of investment goods: saving and investment rates measured at each economy’s own equilibrium prices are roughly constant across , because a lower interest rate depresses saving while lower wages and rentals raise the return to self-financing, and the two roughly offset. That is the runner-up surprise of the paper — the capital accumulation channel is a price story, not a thrift story.
Set beside the data, the model slope of output per worker on external finance is 0.22 against 0.34, of tfp 0.15 against 0.26. The paper’s phrasing is that “one may conclude that our model explains as causal two-thirds” of the output relationship, and about 60 percent of the tfp relationship. Hold onto the hedge in that sentence; those are two descriptive regression slopes divided by each other, not a decomposition. On non-agricultural output — the right comparison, since there is no agriculture in the model — 82 countries in the Restuccia–Yang–Zhu (2008) data give a slope of 0.24, so close to the model’s 0.22 that the model nearly accounts for the whole thing. Against the 18 ggdc countries, whose data slopes are 0.15, 0.07 and 0.09, the model over-predicts on all three.
Where the damage lands
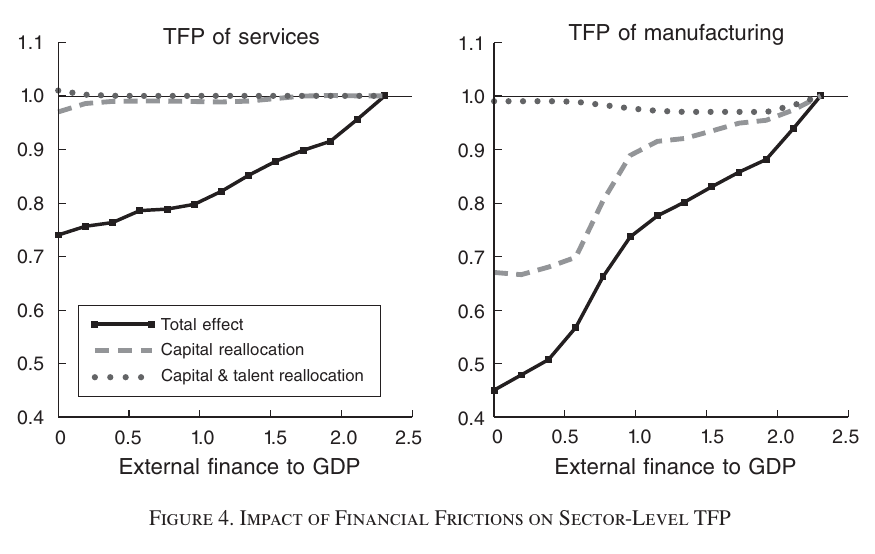
Service-sector tfp falls 26 percent; manufacturing tfp falls 55 percent, each against its own perfect-credit level. The decomposition is the interesting part. If you take the entrepreneurs who are actually operating and reallocate capital efficiently among them, you recover almost all of the service sector’s loss and less than half of manufacturing’s. If you then also select the most talented people into entrepreneurship, you recover more than half of manufacturing’s loss but less than a tenth of services’. If you finally let the number of establishments adjust, you get very little more — which is the sort of finding worth stating flatly: restricting entry per se does not do much damage unless it distorts who enters. Services suffer from capital being in the wrong hands; manufacturing suffers from the wrong hands being there at all.
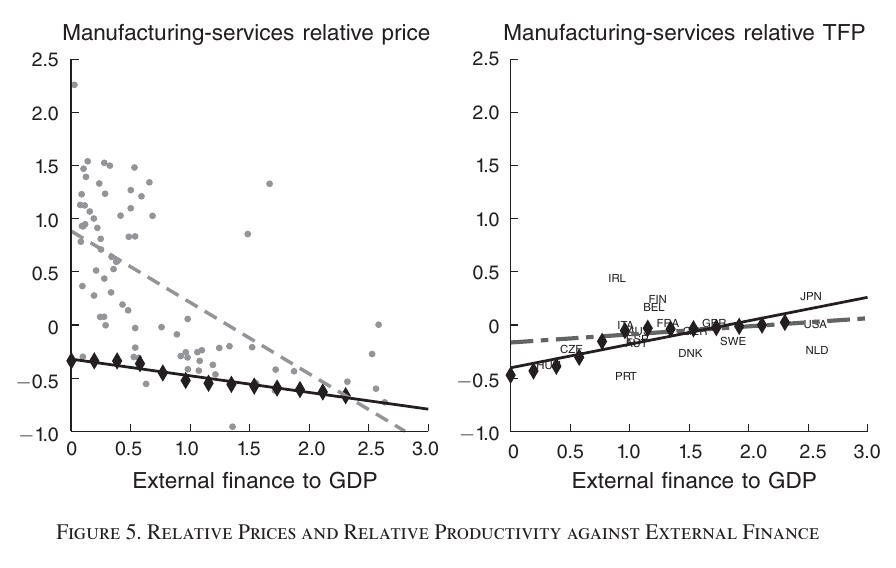
On the two sectoral relationships the model lands on opposite sides of the data, which is awkward under its own logic. The relative price of manufactures to services has a model slope on external finance of −0.16 against −0.67 in the icp data: a quarter of the relationship, leaving three quarters to taxes, tariffs, transport and everything else. Relative sectoral tfp has a model slope of 0.22 against 0.08 in the ggdc data: nearly three times too steep. If prices really are the inverse of productivities, these two should be mirror images the way −0.45 and 0.39 are in Figure 1, and they are not.
The surprising thing: frictions make factories bigger
Everyone arrives at a credit-constraint model expecting the same conclusion — constrained producers operate below efficient scale, therefore poor countries have small firms, therefore the missing middle. The model delivers a smaller average establishment, by up to 30 percent, and delivers it non-monotonically, rising from 22.1 workers to 24.5 before falling to 15.4. But it delivers it entirely through services. Lower equilibrium wages mean a lower opportunity cost of entrepreneurship, so marginal and untalented people set up on their own, and they overwhelmingly set up in services, where the ticket is cheap. Meanwhile the collateral ceiling and the large manufacturing fixed cost screen all but the wealthy out of manufacturing, the relative price of manufactures rises, and wages and rental rates fall — so the manufacturing establishments that do exist are fewer and larger than under perfect credit. The ratio of manufacturing to service scale rises with financial frictions. Too few, too big on one side; too many, too small on the other.
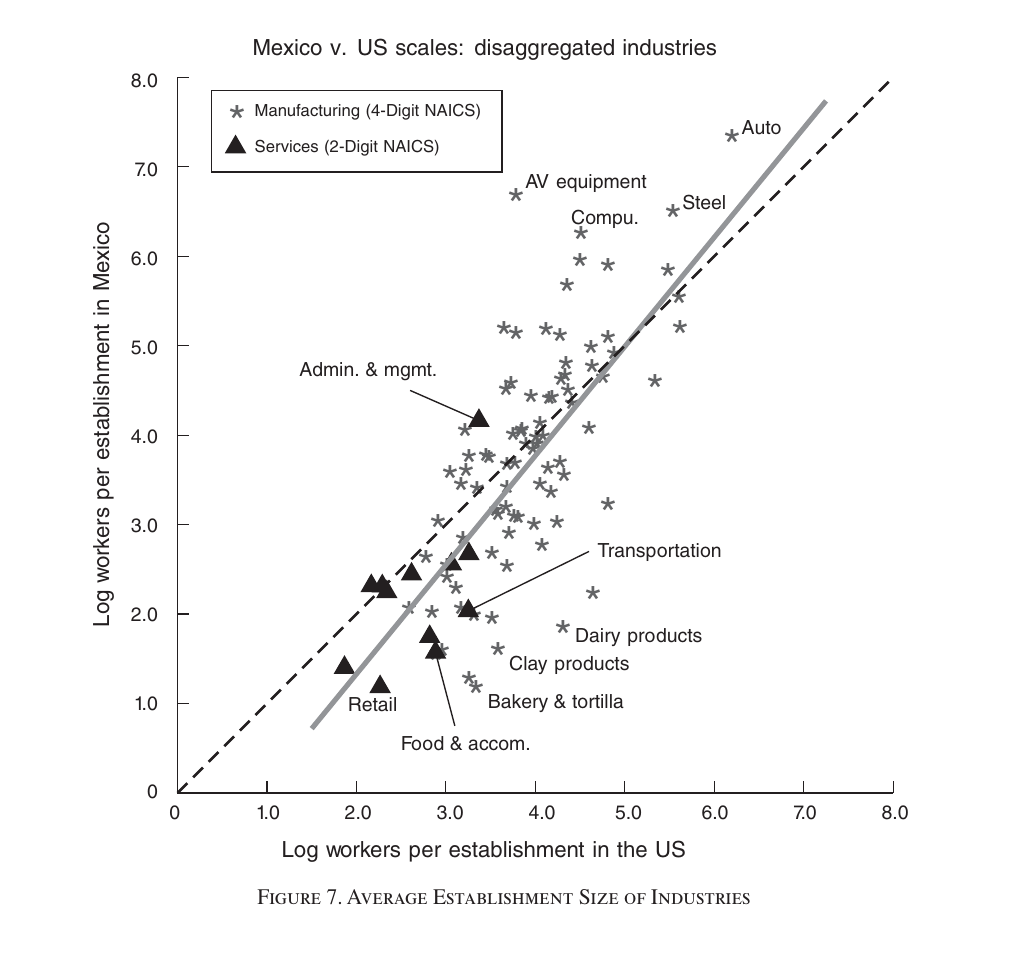
Then they go and check it. Comparing the 2002 us Economic Census with the 2004 Mexican one on a common naics basis — 86 four-digit manufacturing industries and 12 two-digit service industries, with a 1998 Mexican micro-enterprise survey used to impute comparability corrections — the average Mexican establishment is smaller than the American by almost a factor of three, and yet the regression of log Mexican scale on log us scale has a slope of 1.22 with a standard error of 0.11. Significantly steeper than 45 degrees. Large-scale us industries are even larger in Mexico; small-scale ones even smaller; autos, audiovisual equipment, computers and steel sit above the line, and apart from administration and management services, everything above the line is manufacturing. The paper says the finding was previously undocumented, which is a modest way of describing a prediction that runs against the standard reading, comes out of general equilibrium rather than the constraint itself, and is then confirmed on data assembled for the purpose. It is also the one place where the rival modelling device can be told apart: the authors report that if you generate sectoral scale differences through span-of-control rather than fixed costs, relative manufacturing scale decreases with frictions, the opposite sign.
What to press on
The identification is calibration, not estimation. Every cross-country result is comparative statics in one free parameter, with the talent distribution and every technology parameter held identical across countries by assumption. There is no exogenous variation behind the data slope that the model slope is compared to, and reverse causality, omitted institutions, human capital and exogenous tfp can all load on both external finance and income. The authors hedge in the text; the abstract and conclusion do not.
The joint between model and data is load-bearing and the two objects are not the same thing. Since has no counterpart in the world, everything is projected onto data through an endogenous model statistic — the funding an entrepreneur uses beyond his own assets, which is exactly zero in autarky even though capital still flows and output continues, and for which the paper gives no explicit computational formula. On the data side it is private credit plus private bonds plus stock market capitalisation scaled by an average book-to-market of 0.33, including consumer credit the authors cannot strip out (9 percent of us private credit in the 1990s; they assume it is smaller elsewhere and leave it in). One check disciplines the correspondence: 2.3 against 2.5.
The benchmark treats the United States as a perfectly enforced credit market, so any real American misallocation is absorbed into the calibrated technology — and the that carries the whole sectoral asymmetry is identified from a us 47:14 scale ratio that may itself partly reflect us financial conditions. The asymmetry is, in the end, one number from one moment pair, resting on an approximate proposition that holds only under perfect credit, independent Pareto talents and a small entrepreneurial share. A discussant would want to know what else produces a 3.4-fold scale gap: span of control, product-market structure, regulation, or plain differences in what an “establishment” means in a service industry. Note also that Table 1 puts a us establishment column next to an oecd enterprise column, and that the Mexican level comparison depends on imputations that remove non-employers and add fixed-location-less entrepreneurs in an economy with a very large informal sector — the factor of three is sensitive to those; the slope of 1.22 less so.
The broad-sample evidence is price evidence, and the translation to productivity leans on equal factor shares and constant returns, with taxes, tariffs and transport costs relegated to a footnote. Direct relative-tfp evidence exists for 18 rich countries whose poorest member is Hungary, and its slope on financial development is 0.08 with a standard error of 0.08 — statistically indistinguishable from nothing. The conclusion’s claim that the mechanism “almost fully explains the relationship between financial development and relative productivity of sectors in the available data” is anchored to precisely that null.
Everything is a comparison of stationary equilibria. Self-financing is central to the argument and self-financing is intrinsically a transition phenomenon, and there is no computed transition, so how long the escape takes is never shown. There is no agriculture, no informal sector, no human capital, no labour-market friction, no trade — a relative-price story about the tradable-ish sector, run in closed economy — and no cross-country differences in talent, which the authors say they do not know how to discipline. The financial contract has no default in equilibrium, no interest spread, no reputation and no bankruptcy, which is to say none of the machinery that actual financial underdevelopment consists of. And the conservative choices the authors flag — a unit elasticity of substitution rather than the near-Leontief the structural-change literature reports, per-period rather than setup fixed costs, a 0.30 capital share, the low us manufacturing share — are all defended as making the answer a lower bound, which is true, and are also a list of dials none of which was turned the other way. The authors do report what happens when you turn some: one-time setup costs give larger effects; a one-sector model with the same fixed-cost burden spread thinly gives 39 percent on output rather than 52; a two-period version that forbids self-financing inflates the aggregate effect by about half.
That last comparison is worth sitting with. The paper’s own conservatism is the finding. Give people a lifetime instead of two periods and a lot of the damage from bad courts disappears, because they save their way around them — and the ones who can save their way around them are the ones running small businesses. What survives is a country full of hair salons and short of factories, which is not what a credit constraint is supposed to look like, and is what the census in Mexico shows.