Notes on:
Using Administrative Payroll Data to Improve Official Labour Market Statistics in the UK
NBER EMRI conference paper
17 September 2026
employment measurement · administrative data · United Kingdom · official statistics
Talk · Paper · Slides · PDF · Transcript
Made with AI: Opus 5 (reading and writing), GPT 5.6-Sol (reading), Fable 5.1 (adjudication), Sonnet 5 (verification)
Part of Innovations in Measuring Employment, Fall 2026
Every time a uk employer pays an employee, it deducts income tax and National Insurance at source and sends the tax authority a record of the payment. Not once a year. Every time. “If I’m paid monthly then they’ll send a monthly submission,” John Forth told the room; “if I’m paid weekly, every week they send a submission to the tax office.” That is paye Real Time Information, live since the 2013/14 tax year, and it is transaction-level coverage of every payrolled employee in the country. Forth said the quiet part about a session in which the two preceding papers had been squeezing signal out of Homebase, Advan and a private payroll vendor: “the difference with some of the sources we’ve heard about is that we cover everybody.”
So you would assume the uk has had a linked employer–employee dataset since about 2014, and you would be wrong. “In the uk we have historically had no full-population linked employer-employee dataset; we don’t have an lehd, or at least we didn’t until last November.” The payroll data had been sitting inside the Office for National Statistics for years. What did not exist was the join. The paper Forth and Yohannes Lemma presented — an eighteen-page September 2026 conference draft, no tables, no equations, results Forth described from the podium as “very much work in progress” — is the join, and the enabling data-sharing agreement is dated November 2025. Forth’s own summary of the method is four words long: “what we’ve done is to use a lookup file.”
The employer identifier that isn’t one. Here is why a full-population payroll file was not already an lehd. The thing the submission carries as an employer is a payment scheme reference, and a payment scheme is not a firm. It is a payroll. “All we observe on the transaction data is the payment scheme reference,” Forth said, and then used his own university as the example: separate schemes for monthly and weekly paid staff, possibly a separate scheme again for bonuses. This is not sloppiness on hmrc’s part. A tax authority needs to know who remitted and on whose behalf; it has no institutional reason to hold an opinion about where the boundary of an enterprise falls.
The statistical system, meanwhile, counts in a currency of its own. An enterprise decomposes into reporting units, which are the observation and sampling units for the business surveys, and reporting units decompose into local units, which are physical sites. Neither layer has any reason to line up with a payroll cycle. And paye rti does not record the local unit at all: the only geography on the record is the employee’s home address. So you have a census of the workforce and no reliable way to say which survey respondent any given worker belongs to.
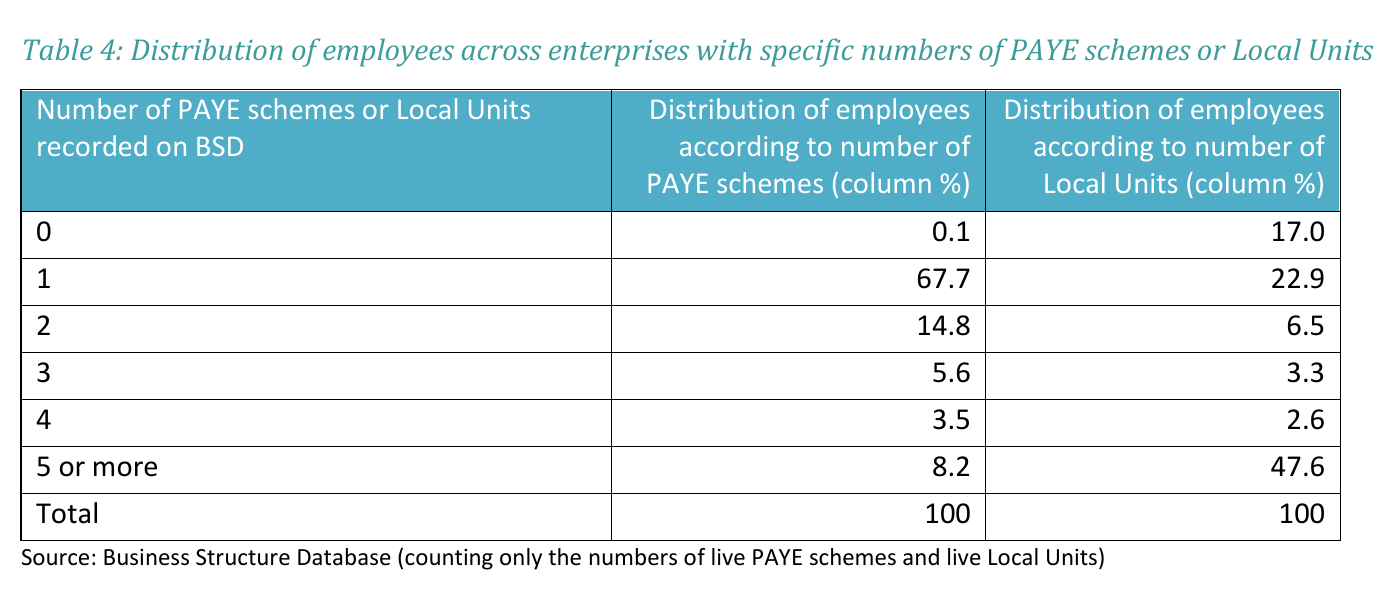
That roadmap, published fifteen months before this talk, put roughly 60% of uk employees in multi-establishment enterprises whose workplace would have to be imputed, against 30–40% in the lehd. The paper’s answer comes in two versions. The baseline, which generated every result shown, aggregates everything to the enterprise and then splits it across reporting units using the latest reporting-unit employment shares on the business register — crude, share-based, and the thing the rest of the paper is implicitly a test of. The more involved method, still in development, is a minimum cost flow assignment that pushes each worker to a local unit by minimising total straight-line home-to-site distance across all the enterprise’s workers subject to an expected headcount at each site, then rolls sites up into reporting units. Forth, generously, called it “a little bit like your establishment-level allocation in the lehd”; the paper cites Abowd et al. (2005) directly. The room’s own imputation problem, imported, with worse odds.
The wedge is a calendar. Now the results. Take the firms that responded to the Short-Term Employment Surveys — about 37,000 businesses a quarter — build the payroll counterpart for each, weight both sides identically, and plot them.
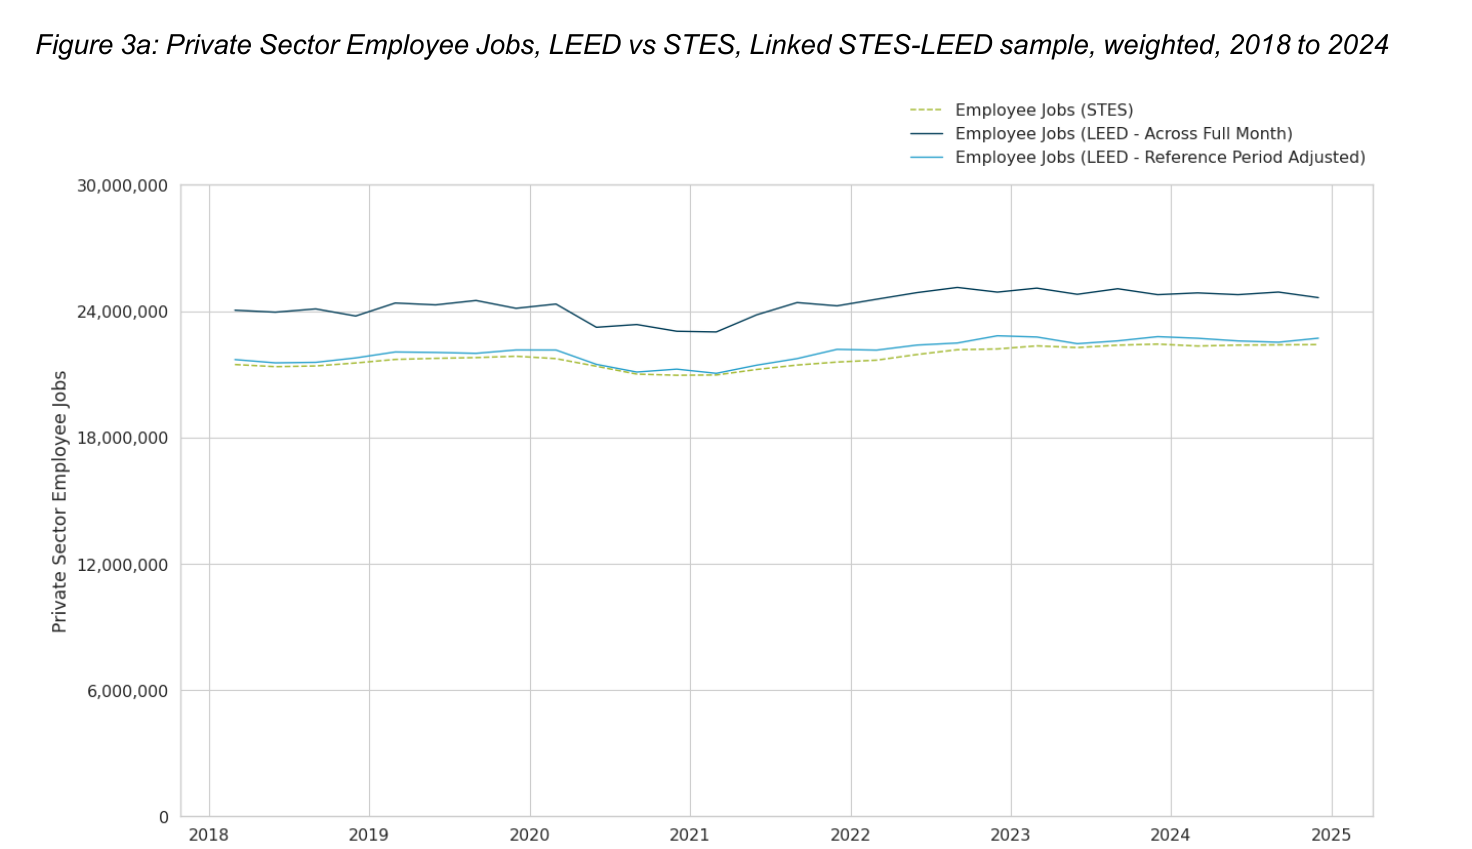
The unadjusted administrative series sits consistently above the survey. Reading the levels off the chart — the paper states no number for the gap, and neither will I — the payroll count runs around 24 to 25 million private-sector employee jobs against a survey line running roughly 21 to 23 million, so call it two million jobs, something like eight or nine per cent. That is an enormous discrepancy between two measures of the same firms in the same months, and it is entirely definitional. The administrative file counts a job in a month if any payment falls in that month. The survey asks for headcount on one date, and the date is the first Friday after the second Thursday of March, June, September or December. Worker-level start and end dates let the team impose the survey’s rule on the admin data retrospectively — drop anyone who left before the reference date or started after it — and the dark blue line becomes the light blue line, which as Lemma put it is “pretty much in line with the survey estimates.” A hair above, throughout, which is about what you would expect and is worth noticing.
Every argument in this literature about whether administrative data “agree with” survey data has a version of this buried in it, usually unrecoverable. Here it is recoverable, because the payroll file knows when the spell started.
Aggregates agree; firms don’t, and that’s the useful part.
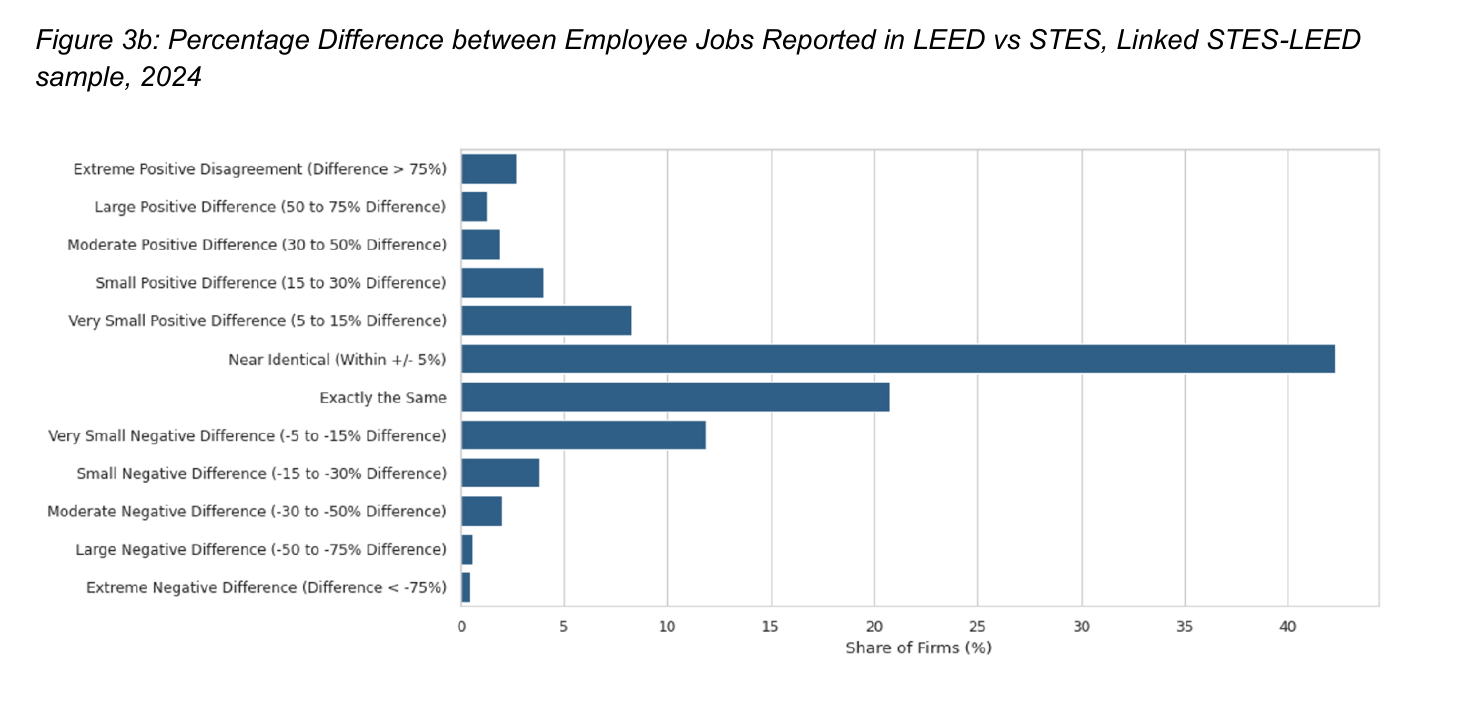
Around one fifth of firms report a headcount that exactly matches the payroll-derived figure, and a further 42% land within five per cent. The distribution is centred near zero and roughly symmetric, which the paper reads, correctly and modestly, as “limited evidence of material systematic divergence” rather than as proof that either source is right. It also means roughly a third of firms are more than five per cent apart, and the tails are not decorative: about 2.7% of firms come in more than 75% above their administrative counterpart, about 0.4% more than 75% below. Nobody in the room asked what is going on in those firms, which is a shame, because either the survey response or the apportionment is badly wrong there and the paper can tell which.
The quietest and most load-bearing sentence in the results is that apportionment errors for complex enterprises, where the survey and administrative units genuinely do not align, are “only slightly larger” than for simple ones where they do. The share-based baseline, in other words, mostly works, and the minimum cost flow machinery may turn out to be a refinement rather than a rescue.
The earnings side repeats the exercise against the Monthly Wages and Salaries Survey — about 9,000 businesses a month covering around 12.8 million employees, compulsory under the Statistics of Trade Act 1947, every firm above 1,000 employees surveyed, no firm below 20 employees sampled at all. Average weekly earnings from payroll broadly reproduce the level and time profile of the survey series, seasonal bonus spikes included, and the firm-level differences across the twelve 2024 waves are again centred near zero. Lemma flagged the limit himself before anyone could raise it: this is total pay only. The survey itemises bonuses, holiday pay and arrears; the payroll data do not break them out. The same limitation bites on the full-time/part-time split, where coherence is frankly weaker because paye rti carries little on hours; the planned fix is calibration against the annual hours-and-earnings survey.
Six weeks versus six months. For a March reference period the raw payroll data reach ons within the first week of April, take about two weeks to ingest, process and index, produce a flash extract by mid-April and a revised extract one month later with imputed records replaced by actual submissions. “In six weeks effectively we have a very strong dataset available,” Lemma said. The quarterly workforce jobs estimate for a mid-March reference date publishes on 18 June. Both extracts fit inside that window with room to spare; the monthly earnings timetable, publishing 19 May, is tighter and depends on further processing gains. The paper’s summary — “the main remaining challenges are therefore statistical and methodological rather than operational” — is the kind of sentence a statistical agency writes when it has already won the hard part. For scale, the paper notes qcew publishes with a lag of six to seven months, against one to two months for the uk’s payroll-based employment and earnings.
And having proved it, they decline to use it. The paper closes with an eight-rung ladder from doing nothing to replacing the surveys outright.
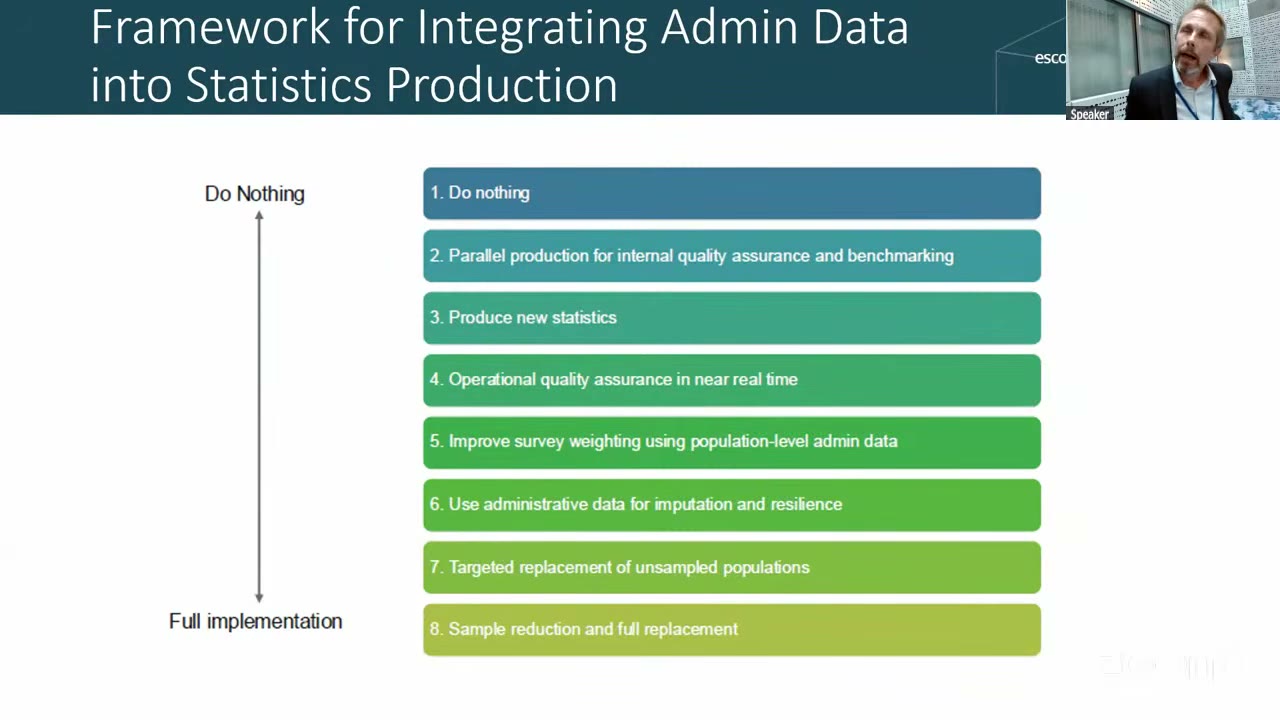
The near-term rungs are internal benchmarking, new complementary statistics, real-time quality assurance during collection, better weighting, imputation for non-response, and — the clearest single case — extending earnings coverage to the under-twenty-employee firms the survey does not sample at all. The bottom rung they rule out. “Ultimately one could even think about replacing the surveys with admin data. That’s not something we’re considering,” Forth said, “because as Yohannes indicated the surveys capture many more components of earnings, for instance, that are not observed in the admin data.” The paper’s written version is “Full replacement is unlikely.” Which is the real finding, and it is not about accuracy. The payroll data win on coverage, frequency and speed and lose on breadth, and breadth is what keeps a survey alive.
The discussion, and then the group therapy. Jason Faberman had ten minutes for three papers and spent his scepticism on the other two — the private payroll paper’s state-level correlations with qcew, he noted, “aren’t that strong across a large swath of states and even some states negative.” On this one he was almost purely positive and made the positivity itself the argument. “If you’ve worked with the lehd or worked with any of the administrative data like the qcew, maybe you found yourself a little bit jealous of how the data is collected there. And you should, because it’s kind of ridiculous how much nicer they have it relative to us.” The diagnosis was structural: “unlike in the us where the federal government has to essentially herd 51 sheep of labor market departments at the state level to get all the data — and not only wait for all of it to come in but then process all those data which are collected 51 different ways — in the uk it’s all done at the national level and it’s all done with the uniform reporting paradigm.” His verdict was the strongest line of the session: “of all of these surveys I’ve seen across several of these conferences now, this is probably the most promising in terms of something that could either complement or, if not, completely replace an existing major labor statistics survey.”
He allowed himself two limitations. One he called “the obvious kind of cheap shot caveat,” and it lands anyway: “it’s not on the household side. We know in the uk their household survey has some issues. You’re not going to get any information about the non-employed from this survey.” That is the whole uk story compressed. The survey that actually broke — badly enough that ons suspended publication of its estimates in October 2023, badly enough that, in Forth’s telling, “those responsible for feeding information to the Monetary Policy Committee” were “questioning whether they should really be taking any signal from our household Labour Force Survey at all” — is the household one, and payroll records cannot see anyone who isn’t on a payroll. Self-employment is out too, because self-assessment income isn’t filed until ten months after the tax year ends. The second limitation was really a suggestion: follow the qwi and publish worker flows. Forth answered that one well and specifically — hires, separations and job-to-job flows are “in our near-term horizon,” with something expected to publish within six months.
Then the floor took over, and the session stopped being about Britain. The co-organiser — the tape has only “Matthew”; the agenda supplies Shapiro — pushed the maximal case: if the data are this convincing, go all the way down to the bottom of the ladder, and fill the gaps two ways. Enhance the wage record the employer already submits to the tax authority, as Australia did, offered as an explicit quid pro quo along the lines of we’re not going to ask you on a survey; and get the demographics by linking to census data. “It seems like an infrastructure that could be enhanced to fill in a lot of the gaps in a fairly straightforward way.”
Forth’s answer was the most revealing thing said about this paper all afternoon. “We absolutely recognise the opportunities there, but we also recognise the responsibility that we have to not upturn the apple cart.” On asking the tax authority to collect more: “the tax office’s job is to administer tax, not to generate statistics. Like any organisation it has resource constraints and it has to fulfil its main mission. So that’s a challenging conversation to have — it’s a reasonable ambition, I think, but it’s very difficult in practice.” Conversations about collecting hours and occupation have in fact happened in the uk, repeatedly, and “usually founder on the practicality.” His counter-offer was linkage rather than collection: link to benefit receipt, so that a disappearance from the employee records can be classified as inactivity rather than unemployment, using indexes ons has already built across administrative datasets. Note what that concedes. The uniform national system that Faberman envies is uniform because it belongs to one agency with one mission, and that agency’s mission is not statistics. Centralisation buys you coverage and costs you the ability to ask for anything new — a trade the paper itself states plainly, observing that the decentralised us system at least lets individual states experiment, while in the uk “innovation has been very limited thus far.”
The next questioner declined to introduce himself and delivered the line of the conference: “it seems we lost something in 1776 when we separated. I admit to having a severe case of Jason Faberman’s — what was the word you used? — envy.” Then, seriously: “What would it take to create what you’ve built in the United States? Can somebody talk me out of the delusional notion that we could actually overcome 51 different collection agencies?”
The chair handed it to John Haltiwanger, who answered in six words. “It’s called the Internal Revenue Service.” (The line survives only in the auto-captions; the cleaner machine transcript drops it, though everything around it is consistent.) His constructive point followed: us payroll tax reports already arrive on a flow basis and are “actually much more timely in principle” than the products eventually built from them, and the binding constraint is processing time at Census, which might be improved by working with irs. Julie Hatch of the Bureau of Labor Statistics then supplied the institutional reality, which is funnier and worse: the irs “is not willing to share, and once things go to Census Bureau they never leave, which is great for Census but for the rest of us who want to work with statistics isn’t so great.” Her hope runs through the state channel instead, where many states are already adding enhanced wage records without any agreed methodology or definitions and a national standard is under discussion. “I hope that [moves] much sooner than I ever see changing in the tax records.”
And then a Census economist — Andrew Foote, on the lehd side, introducing himself in a sentence the auto-captions catch and the cleaner transcript mangles — mentioned an asset nobody had brought up. The National Directory of New Hires records every hire in the United States essentially as soon as the I-9 is filled out, along with individual-level unemployment insurance claims and wages at a shorter lag than the states manage. Statistical agencies have no access to it. It lives elsewhere in the executive branch, and letting Census and bls in would require legislation. It wouldn’t fix qcew. It exists.
So the conference spent its afternoon establishing that the uk’s advantage is not that it collects better data. Both countries already receive a record of nearly every pay event in the economy, in something close to real time. The difference is that in one of them the records can be joined to a firm, a task that took a data-sharing agreement and a lookup file, and in the other they can be joined to almost nothing, a task that takes an act of Congress. The scarce good in national statistics turns out not to be data at all. It is permission.