Notes on:
Are Ideas Getting Harder to Find?
American Economic Review
1 April 2020
research productivity · R&D · semi-endogenous growth · idea production function
Paper · doi · PDF · Appendix
Made with AI: Opus 5.5 (reading and writing), GPT 6.1-Sol (reading), Fable 5.1 (adjudication), Sonnet 5.5 (verification), GPT 6-Astra (verification)
Nicholas Bloom, Charles I. Jones, John Van Reenen and Michael Webb, American Economic Review 110(4) (2020), pp. 1104–1144. Published version, with online appendix; no recorded talk.
“Are Ideas Getting Harder to Find?” is growth accounting turned around to face the research lab. Solow (1957) took output, subtracted what measured inputs could explain, and called the leftover technology. Bloom, Jones, Van Reenen and Webb take the output of research, which is productivity growth, divide it by the input, which is researchers, and call the ratio research productivity. They say themselves that this is a Solow residual of the idea production function, and it inherits everything good and bad about Solow residuals: anything you mismeasure lands in it, and if it moves a lot, you have learned something. It moves a lot. In the us economy, research effort has risen by a factor of 23 since the 1930s while tfp growth has, if anything, drifted down, so research productivity has fallen by a factor of 41, or 5.1% a year. The rest of the paper shows this is not an aggregation artefact by finding the same thing in chips, seeds, cancer and firms.
The mechanism: growth equals research productivity times researchers
The idea production function of Romer (1990), Aghion and Howitt (1992) and many growth papers since says tfp growth is proportional to the number of researchers, (eq. 1 in the paper). Divide the left side by and the null is that research productivity is a constant, . As the paper points out, constant research productivity and “a permanent research subsidy permanently raises growth” are the same statement, so testing the first tests the policy property that made this model family attractive.
There is a units choice hiding on the left side. An “idea” is whatever raises productivity by a constant percentage, so idea output is the growth rate of , not its level. That is the quality-ladder convention, and the authors concede it is just a convenient definition, adding that a more accurate title would be “Is Exponential Growth Getting Harder to Achieve?”
Why not stop at the aggregate? Jones (1995) made the aggregate point a quarter-century earlier, and Dinopoulos and Thompson (1998), Peretto (1998), Young (1998) and Howitt (1999) answered it with models in which the number of products grows with the economy. Researchers per product then stay flat while total researchers explode, research productivity is constant product by product, and the aggregate decline is composition. That is a coherent rescue, and the only way to check it is to go to the product line and measure: Moore’s Law, a crop, a disease, a firm.
The step that does most of the methodological work is the deflator. In almost every case the authors observe R&D dollars, not bodies, and the obvious move, dividing idea output by real R&D spending, is useless. In the lab-equipment version of endogenous growth, with in units of final goods (eq. 6 in the paper), R&D is a constant share of an output that grows with , so ideas per real dollar fall in a model with no diminishing returns at all. That is why the familiar facts about falling patents per R&D dollar (Griliches 1994, Kortum 1993) and falling drugs per pharmaceutical dollar (Scannell et al. 2012) cannot tell constant returns from diminishing ones. The fix is to divide by the wage:
This is eq. 12 in the paper: is R&D spending in units of final output, the wage and the idea-production constant, and both factors on the right are constant along a balanced growth path of the lab-equipment model, so is the input whose productivity should be flat under the null.
The authors call “effective scientists”: the number of researchers the spending could buy, not a headcount, since labs also buy equipment. Putting the input in units of people makes constant research productivity exactly the endogenous-growth null. The wage is mean cps income for men with at least a bachelor’s degree. The side benefit is that wages weight researchers by talent, so if the marginal hire is worse, spending rises by less, a market-based quality adjustment for free. The matching weakness is that if college expansion lowers the average graduate’s talent, the college wage understates constant-quality wage growth and overstates the decline. They also allow duplication at a point in time, an input of with , but keep as the baseline, since the wage already weights talent and, they argue, changes the size of the trend rather than whether there is one (true nearly everywhere, with one exception below).
The evidence: one picture, drawn six times
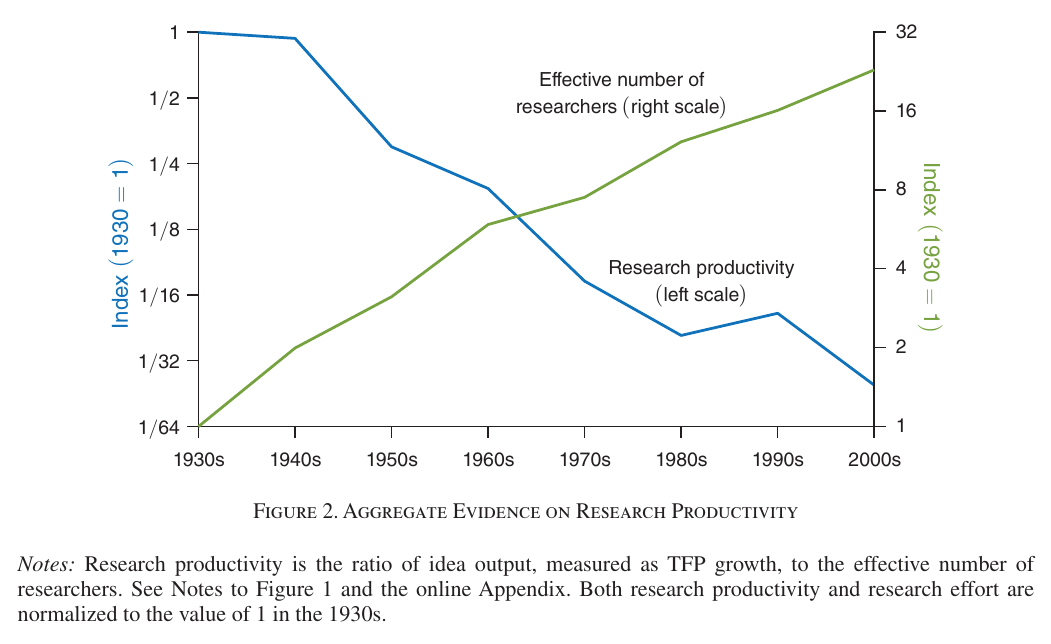
Figure 2 is the aggregate version and the template for the rest. Output is decadal tfp growth (bls private business with R&D and intellectual-property contributions added back, Gordon (2016) for the 1930s and 1940s, the last observation 2000–2014). Input is nipa investment in intellectual property products, R&D plus software, music, books and films, deflated by the high-skilled wage. Effort rises 23-fold, 4.3% a year; research productivity falls 41-fold, 5.1% a year, a half-life of a bit under 14 years. The decomposition is the striking part: the factor of 23 comes from rising effort, and less than a factor of 2 from the slowdown in tfp growth that everyone argues about. It took 23 times the research effort to keep growth roughly where it was, or, in the authors’ slogan, the us must double its research effort every 13 years just to keep growth constant.
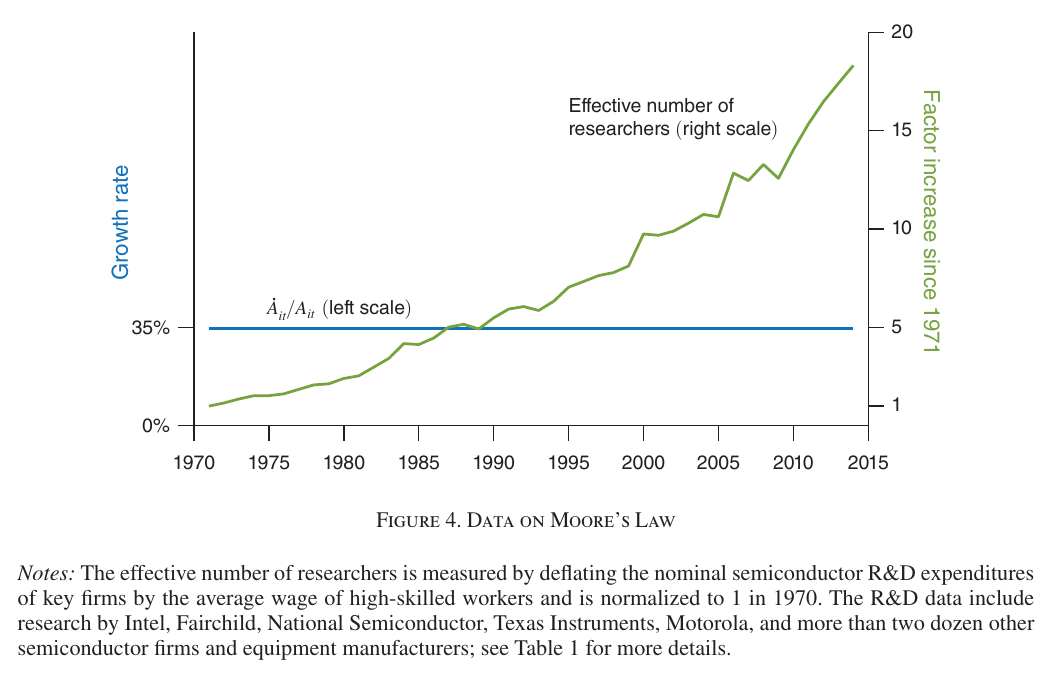
Moore’s Law is the cleanest case, because the output side is a straight line. Doubling every two years is 35% a year, steady for nearly half a century, so output growth is set to a constant 35%. Input is the wage-deflated R&D of Intel, Fairchild, National Semiconductor, Motorola, Texas Instruments, Samsung and more than two dozen other chip and equipment makers. Effective researchers rise 18-fold since 1971, so research productivity falls by the same factor: 6.8% a year, a half-life of 10.3 years. The most conservative R&D measure still gives a factor of 8, and using semiconductor-industry tfp as the output gives a smaller but still large decline. The authors guard against undercounting early R&D by including firms that are no longer household names; in 1971 Intel was just 0.4% of their estimate of total semiconductor R&D.
Agriculture is where output is measured best. For the sector, tfp growth over the next five years declines slightly while effective research roughly doubles over 1970–2007, so research productivity falls nearly four-fold, 3.7% a year. Crops have no tfp (farms are multi-output), so output is the growth of yield per acre, around 1.5% a year since 1960 for corn, soybeans, cotton and wheat. Inputs are research on seed efficiency only, or that plus crop protection. Seed-efficiency research for corn and soybeans rose more than 23-fold between 1969 and 2009. Research productivity falls about 6% a year on the narrow input and about 4% on the broad one, steepest for narrow corn at 9.9%; broad cotton is the one row in the summary table where it rises, at 1.3%. Worse land is no escape: cotton and wheat acreage fell, and rescuing the null would need no-research yields to fall at an exponentially accelerating rate.
Medicine is where the units concession comes back. New molecular entities first: effort rises 9-fold, research productivity falls 11-fold by 2007 and recovers to a factor of 5 by 2014, about 3.5% a year. For specific diseases, the authors note that life expectancy does not grow exponentially: since 1950 it has risen a steady 1.8 years per decade at birth, and Oeppen and Vaupel (2002) find record female life expectancy rising 2.4 years per decade since 1840. So idea output becomes years of life saved, a change in a level, computed as the share of deaths from the disease times remaining life expectancy times the percentage fall in its mortality (eq. 16 in the paper). The input is PubMed publications tagged with the disease, or only the clinical trials among them.
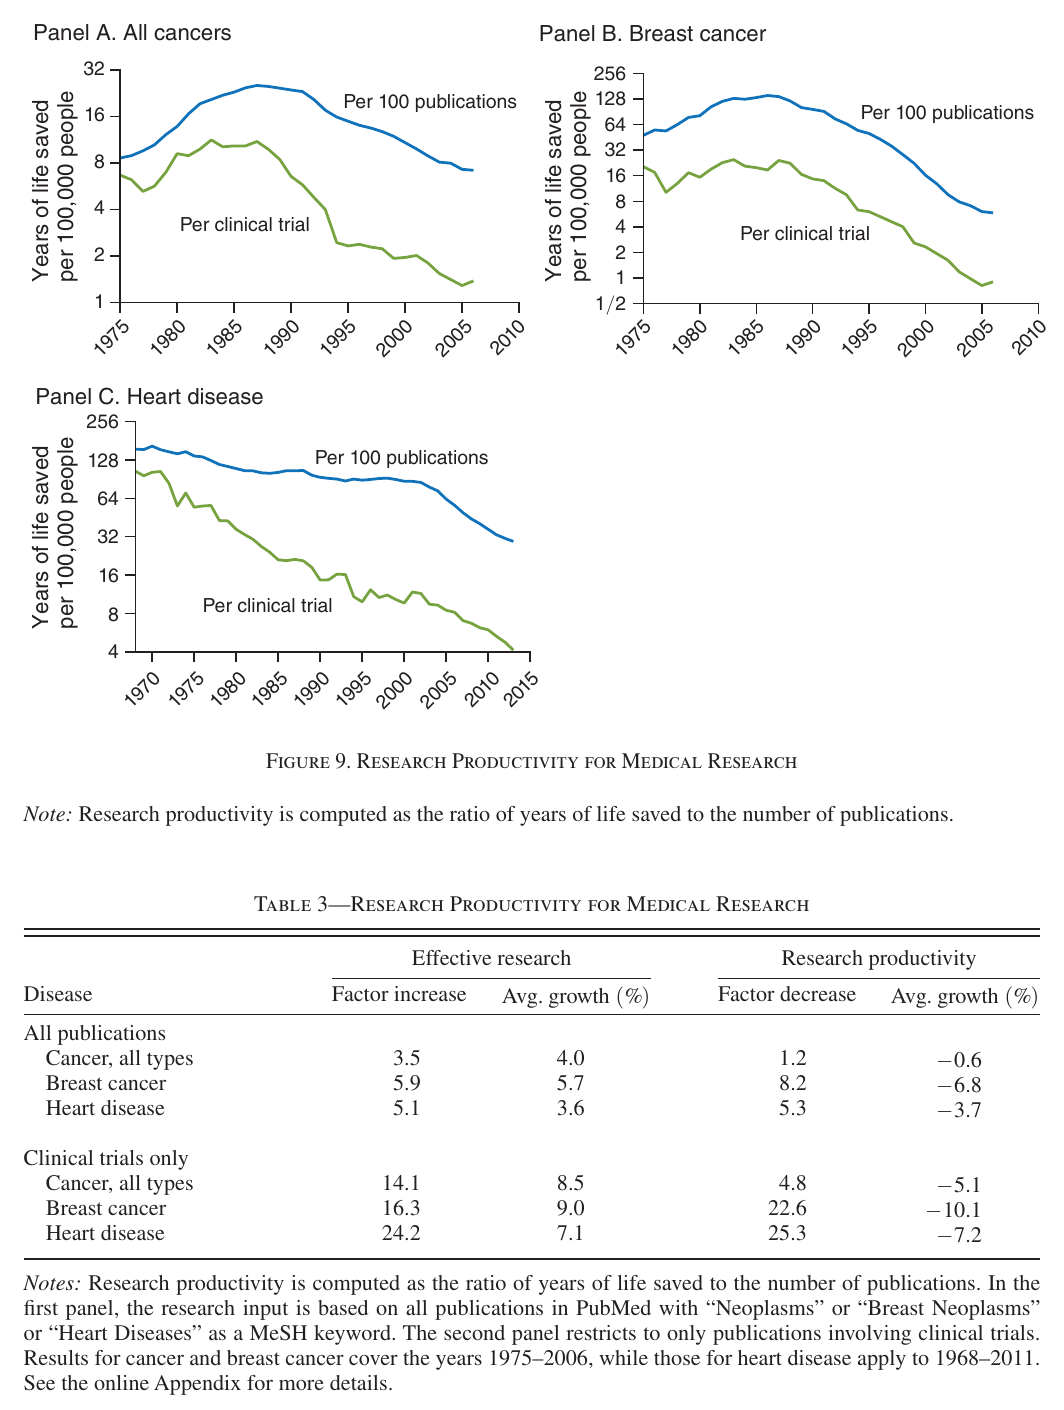
On all publications, Table 3 has research productivity falling 0.6% a year for all cancers, 6.8% for breast cancer and 3.7% for heart disease; on clinical trials, 5.1%, 10.1% and 7.2%. (Table 7 instead carries −5.7 and −6.1 for cancer trials and breast-cancer publications; Table 3’s figures match its own factor columns and Figure 9, but the paper never reconciles the two.) Per cancer clinical-trial publication, years of life saved per 100,000 people fell from more than 8 to just over 1 between 1985 and 2006; for breast cancer, from around 16 to under 1. Figure 9 also shows a shape found nowhere else: for both cancer series research productivity rose from 1975 to the mid-1980s before falling, which the authors read as ideas sometimes getting easier before they get harder.
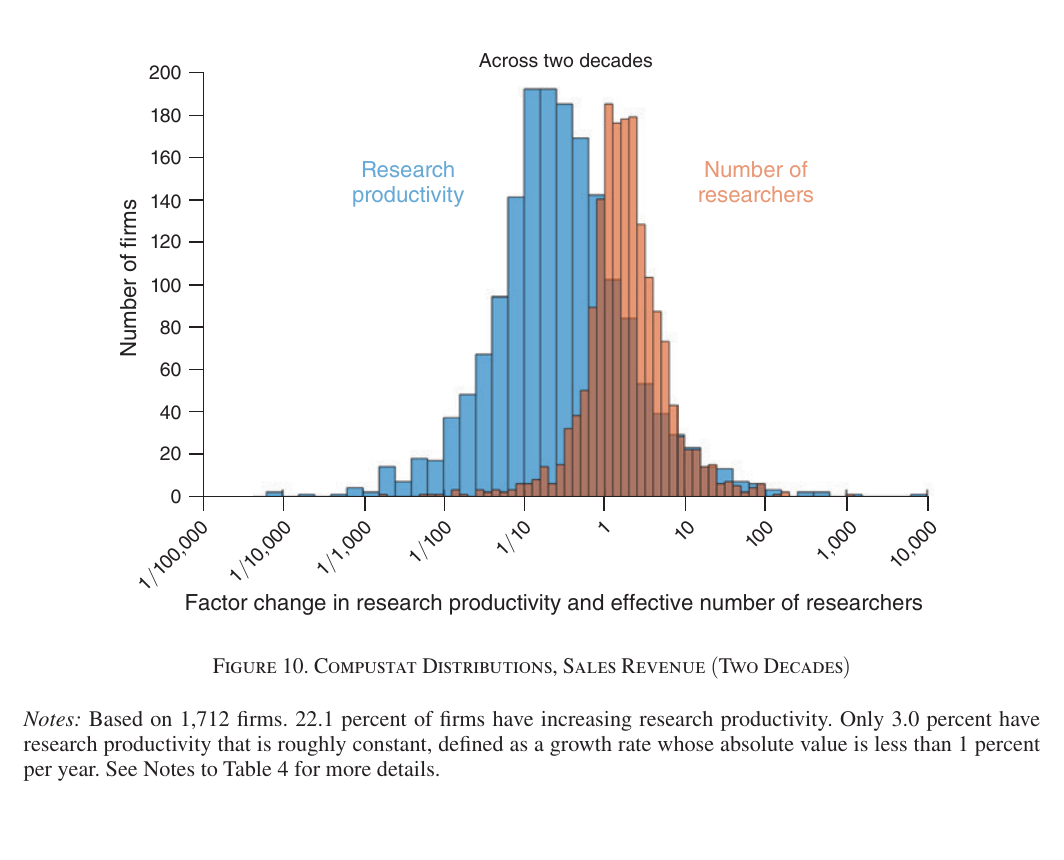
The firm panels answer the last version of the variety story, in which each firm is a variety. In Compustat, output is the decadal growth of a firm’s sales, market value, employment or revenue per worker, justified by Lucas (1978), Hopenhayn (1992) and Melitz (2003), where a more productive firm gets bigger rather than more productive per worker. The three-decade sales sample has research productivity falling 11.1% a year; averaged over all samples it is about 9% a year, a factor of about 15 over three decades, so 15 times the researchers for the same firm revenue growth. In Figure 10, of 1,712 firms over two decades, 22.1% have rising research productivity and only 3.0% anything like constant. The Census of Manufacturing, about 1,300 firms including private ones, gives 7.8% a year over 1992–2012, and 6% when the input is a headcount of scientists and engineers.
The β reading: semi-endogenous growth
Research productivity falls nearly everywhere while growth rates hold roughly steady. The authors offer the semi-endogenous model of Jones (1995), Kortum (1997) and Segerstrom (1998) as one class of models consistent with both:
These are eqs. 17 and 18 in the paper: is the idea stock, research effort, the elasticity at which research productivity falls as the stock grows, and the constant growth rate of .
In Jones (2005) notation, , this is . The steady state is where the accounting becomes economics: growth is pinned by how fast research effort grows, divided by how quickly ideas get harder to find, and with duplication it becomes . Empirically the paper measures , the decline in research productivity over the growth of idea output, which lets output growth trend; it is positive when research productivity falls, and 3.1 for the aggregate economy.
Two hedges are easy to lose in retelling. Semi-endogenous growth is “one possibility”, not the verdict; the conclusion also lists smaller follow-on innovations (Akcigit and Kerr 2018), defensive R&D by incumbents (Dinopoulos and Syropoulos 2007) and falling basic research, without choosing. And the Red Queen implication is conditional: if research inputs grow more slowly, growth could slow, and it is possible this is part of the productivity slowdown of the last fifteen years. The paper’s real theoretical claim is a defence of endogenous growth theory against itself. Its lasting contribution, the authors argue, is nonrivalry, not constant research productivity: with constant research productivity even rival ideas sustain growth, as Akcigit, Celik and Greenwood (2016) show, but with declining research productivity only nonrivalry turns exponential growth in researchers into exponential growth in income per person. That research subsidies then have level rather than permanent growth effects is my gloss: running the constant-productivity equivalence in reverse only rules out permanent growth effects, and it is eq. 18, with growth pinned by , that leaves a level effect behind.
The one surprising thing: the fastest sector has the gentlest diminishing returns
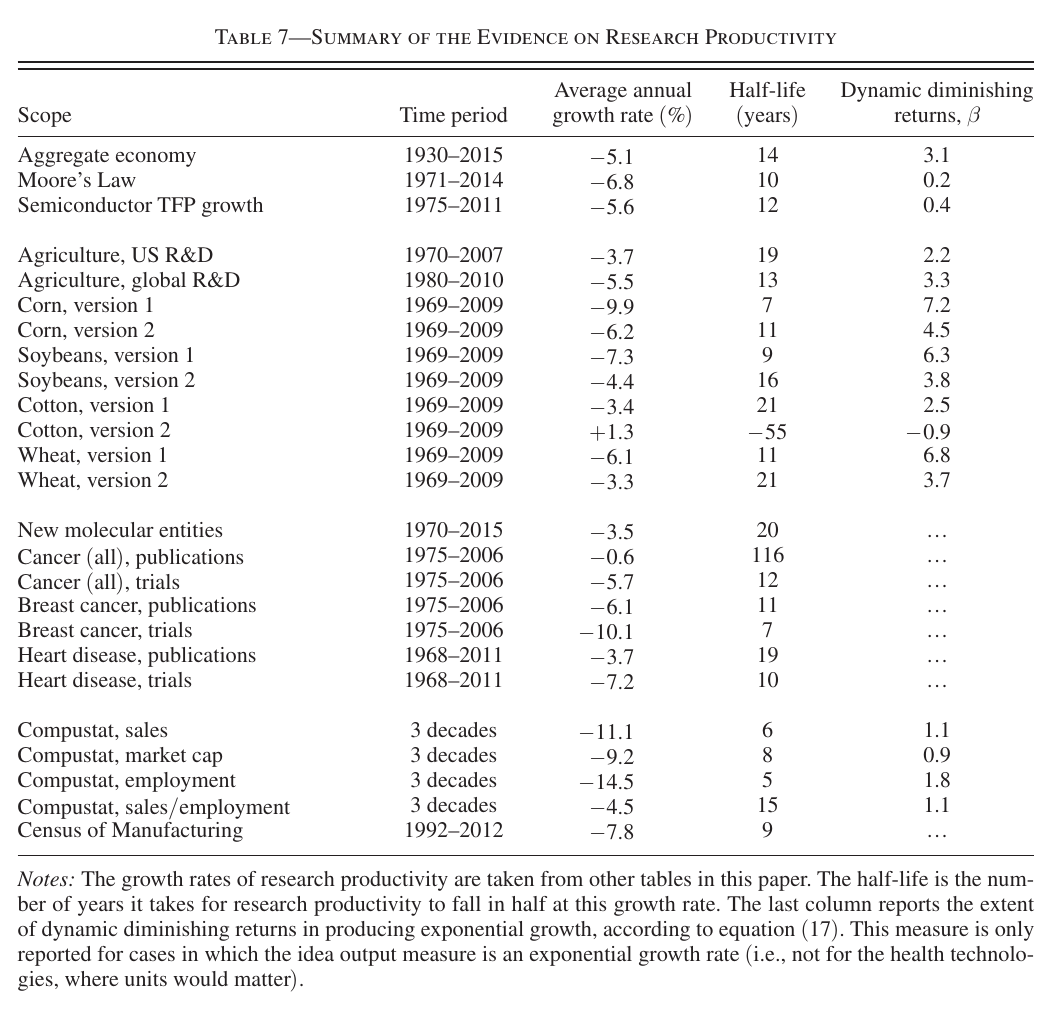
Semiconductors are the fastest-growing sector in the paper, and their research productivity falls 6.8% a year. The β column of Table 7 says the opposite: Moore’s Law has , against 3.1 for the economy. The paper’s arithmetic is one line: chips grow 35% a year and research productivity falls about 7%, so 7/35 = 0.2; tfp grows about 1.5% while research productivity falls about 5%, so β is more than 3.
The reason is in the definition. Since , the decline in research productivity is times output growth. A sector growing 35% a year can have gently diminishing returns and still burn through research productivity fast, because it climbs the idea stock so quickly; the economy climbs slowly and pays steeply for each step. The rate of decline mixes how hard the next idea is with how fast you are going, and only β separates them. (My inference, not the paper’s: a sector’s rate of research-productivity decline is the wrong number to use as its technology parameter.)
Two small corrections to the authors’ telling. They call 0.2 the smallest β in the table, overlooking their own broad-cotton row at −0.9; it is the smallest among cases where research productivity actually falls. And they explain the fast decline by saying chip research grows faster than in any other part of the economy, plausibly because demand for a general-purpose technology justifies the cost. The demand story is plausible, but their own numbers don’t quite support the speed claim. With output growth fixed at 35%, chip research grows at the same 6.8% a year, while seed-efficiency research for corn and soybeans grew more than 23-fold over 1969–2009, a faster pace, and Table 3 has breast-cancer clinical-trial effort growing 9.0% a year. The surprise survives: the steepest-looking decline coexists with the mildest diminishing returns, and the arithmetic explains why.
The objections, and how the paper answers them
There is no discussant, so these are the objections the authors raise themselves. The variety objection is why the paper exists, and the micro cases and firm panels are the answer, with the concession that a firm may still contain several product lines. Ideas per dollar always falling is the deflator argument above. A biased deflator, because graduates may be getting less talented, is met by adding 1% a year to the high-skilled wage, by deflating with nominal gdp per person, and by the Census headcount of scientists and engineers; the results are broadly similar because the declines are so large. That is reassurance rather than validation, since none of these tests the wage as a quality weight, and only the headcount separates the researchers from the equipment labs buy. With , rates shrink to about three-quarters of baseline and stay substantially negative nearly everywhere, the exceptions being cancer publications, which turns positive, and broad cotton, which already was.
The output-measure objection (why not the price of a flop, output per farmer, tfp everywhere?) gets the paper’s best answer, which is about how high the bar is. Inputs grow 5 to 7% a year, doubling every 10 to 15 years, so an alternative output would need growth rates that themselves double every 10 to 15 years where the current measure is flat. A constant or stationary mismeasurement of growth rates changes nothing; only an error that worsens systematically and by a lot would. Output per farmer is rejected because it would pull in the R&D behind tractors and gps, which the seed input doesn’t measure.
Missing inputs, such as shop-floor improvements, failed start-ups or garage innovation, land in the residual, and the bias depends on their growth. One growing more slowly than measured R&D overstates the decline; one growing faster, which is what worries about unmeasured intangibles suggest, makes it steeper. The authors also concede possible undercounting of early R&D and that cases were chosen by whether matched inputs and outputs existed: they wanted the price of light, solar panels and genome sequencing, and couldn’t build the input series.
The objection the paper doesn’t fully defuse is the units one it raised itself. If some ideas add to productivity in levels rather than percentages, “research productivity is falling” is partly a statement about the convention, and medicine shows the authors switching units where exponential growth is the wrong description. Their implicit answer, which seems right, is that the growth models’ null is stated in growth rates, so this is the correct test of those models: a test of a model restriction, not a unit-free law of scarcity.
Why this note sits in a growth and asset-pricing collection (my inference, not the paper’s)
The paper estimates no risk premium and says nothing about asset prices, so this is the reading list’s gloss. Fully endogenous long-run-risk models in the style of Kung and Schmid (2015) let an R&D shock permanently shift the growth rate, a natural source for the persistent expected-growth component of Bansal and Yaron (2004). With , the feedback pulls growth back to , so expected growth mean-reverts at the speed of the semi-endogenous transition, roughly on a back-of-envelope linearisation, or about 5% a year with near 3 and growth near 1.5%: slow enough to keep long-run risk alive, but anchored. Franceschini (2026), the neighbouring note, finds evidence pointing the same way, R&D cointegrated with tfp at a coefficient well above the fully endogenous value of one, though his spillover parameter shouldn’t be read as without matching definitions. And the Red Queen ties expected growth to the growth of research inputs, which move with demographics and education, a candidate for genuinely low-frequency growth risk.
Where that leaves things
The authors sell this as good news for the theory they are correcting: ideas are still nonrival, and nonrivalry is what keeps exponential growth possible when each new idea is harder to find than the last. It is also a measurement paper whose main number survives every alternative input series, deflator and output measure they try. It took 23 times the research effort to keep us growth roughly where it was, and on the authors’ arithmetic research effort must keep doubling every 13 years to keep it there. Which is fine, as long as the supply of people who can do research keeps doubling too.