Notes on:
The Household Impact of Generative AI: Evidence from Internet Browsing Behavior
arXiv:2603.03144
7 May 2026
generative AI · households · adoption
Talk · Paper · doi · PDF · Transcript
Made with AI: Opus 5 (reading and writing)
Part of AI and Economic Measurement, Spring 2026
Michael Blank (Stanford gsb), Gregor Schubert (ucla Anderson) and Miao Ben Zhang (usc Marshall), “The Household Impact of Generative ai: Evidence from Internet Browsing Behavior,” presented by Blank at the nber conference on ai and Economic Measurement, Stanford, 7 May 2026, with Martin Beraja (mit) discussing all three papers of the session together. Written from the March 2026 arXiv draft (arXiv:2603.03144).
The setup. You are a household. Not a firm, not a worker — a household, sitting at a home computer in the evening with some fixed and not especially generous number of hours available. You divide those hours between two things. Some of it is digital home production: renewing the car registration, comparing two dishwashers, finding out whether the rash is a problem, helping with the algebra homework. The rest is leisure: a game, a feed, a stream. Now someone hands you a tool that makes the first category dramatically faster.
What happens to your time?
The intuitive answer is that you do more of the thing that got cheaper. That is what happens when the price of a normal good falls. But home production is not a normal good; it is a chore with a target. You do not want more tax return. You want the tax return done. If the marginal value of the tenth productive task falls off quickly enough — technically, if the curvature parameter on productive time is below one, which makes it a time necessity — then a tool that speeds up chores reduces the clock time you spend on chores, and the freed hours go somewhere else, and the somewhere else is games. Blank put the intuition on stage before he put any numbers on it: households doing their tax returns “might just want to get it done as quickly uh as they can and then use the excess time savings that generative ai gives them to engage more in the leisure activities that actually give them kind of intrinsic uh welfare value” (06:27:10).
So the paper’s central claim has a slightly perverse shape. The way you find out that ChatGPT made someone more productive at home is that they now spend more time on the internet doing nothing productive at all.
Anyway, the data. Comscore pays U.S. households to install a tracker on a home machine, and it then records every website visit on it: timestamp, url, duration in seconds, session identifier, plus self-reported income, age of household head, metro area and household size. The authors have the raw microdata rather than the trimmed extract other papers use, so they see every url inside a session and not just the session’s headline domain. Over 200,000 U.S. households’ home devices, 2021 through 2024, straddling ChatGPT’s release on 30 November 2022. Blank is disarming about who signs up for this: “our panel is not exactly representative of the us population. I don’t know about people in this audience, I would not want a tracker to be put on my computer” (06:35:07). The sample over-represents both tails of the income distribution and the 45-to-54 age bucket; everything gets reweighted to the 2022 acs, which fixes the marginal distributions and takes on faith that the households inside each cell are representative of that cell.
To turn urls into economics they run the top 160,000 domains — better than 95% of all browsing — through two llm passes: first scrape each site’s meta tags and ask gpt-4.1 mini for the five main things people do there, then label each of those five activities for whether a chatbot could substitute for it. Every domain gets a score from zero to five. Wikipedia scores five. Facebook scores zero. Two of the authors hand-labelled the top 70 domains by page views and tuned the prompt until the model agreed with them, which is an honest description of the validation and also, if you think about it, a description of an instrument calibrated against a sample of seventy.
The instrument itself is the household’s 2021 browsing mix:
Here is the count of a website’s five activities that a chatbot could do, and is household ’s share of pre-release browsing duration on site ; this is equation (1) of the March 2026 draft. Because 2021 predates ChatGPT, the measure cannot have been contaminated by adoption. It predicts adoption strongly: a one-standard-deviation increase in log exposure raises the probability of having used ChatGPT by the end of 2024 by about 2.5 percentage points, holding demographics fixed.
That exposure then instruments for an “ever visited chatgpt.com or openai.com” dummy in a long difference comparing 2024 browsing to 2022 browsing:
is the causal object of interest, and the fixed effects saturate income bin by age bin by metro area, so the comparison is between demographically identical neighbours; this is equation (3). The exclusion restriction is the argument that, among households of the same age and income in the same city, what remains in the 2021 browsing mix is the precise tasks they happened to be doing online, which should not cause the 2024 life shocks — a job loss, a new baby — that independently move browsing.
Be clear about what that is and isn’t. It is not a randomised experiment and it is not a natural one; nobody was assigned ChatGPT. It is a shift-share instrument built from the outcome variable’s own past, defended by a conditional-independence story and supported by flat pre-trends. The event study is genuinely reassuring on the second point — nothing happens through 2022, everything happens as adoption picks up in 2024 — but flat pre-trends are evidence against one class of violation, not proof of exogeneity. The identifying assumption remains an assumption, and the paper says so.
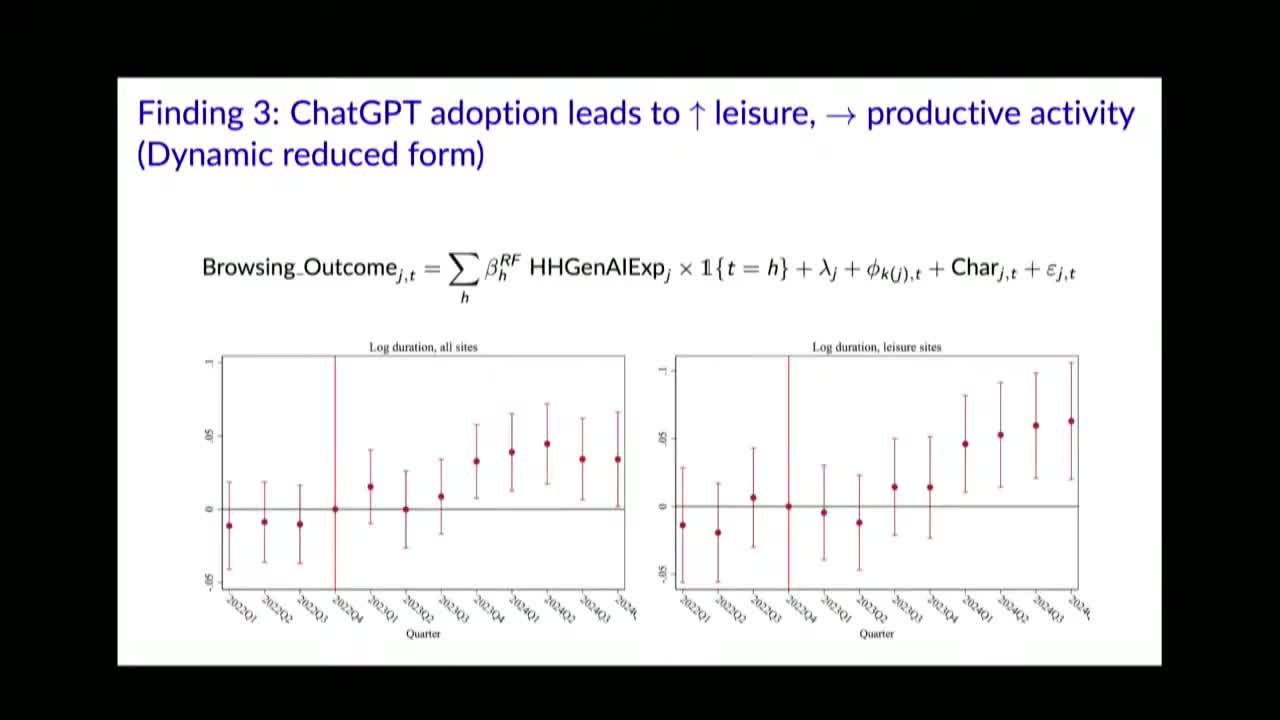
The result. In the long-difference IV, on 42,886 households with a first-stage Kleibergen-Paap F of 104, adopting ChatGPT raises log leisure browsing duration by 1.512 and log productive browsing duration by 0.011. That second number is not a fuzzy zero; it is a precise one, with a t-statistic of 0.021. The leisure share of browsing rises by 30.7 percentage points and the productive share falls by 21.5. Taken at face value the leisure coefficient means total leisure browsing multiplies by about four and a half, which is an implausibly enormous local average treatment effect for a compliant subpopulation, and which the paper’s own footnote flags by showing you the exponentiation rather than the adjective.
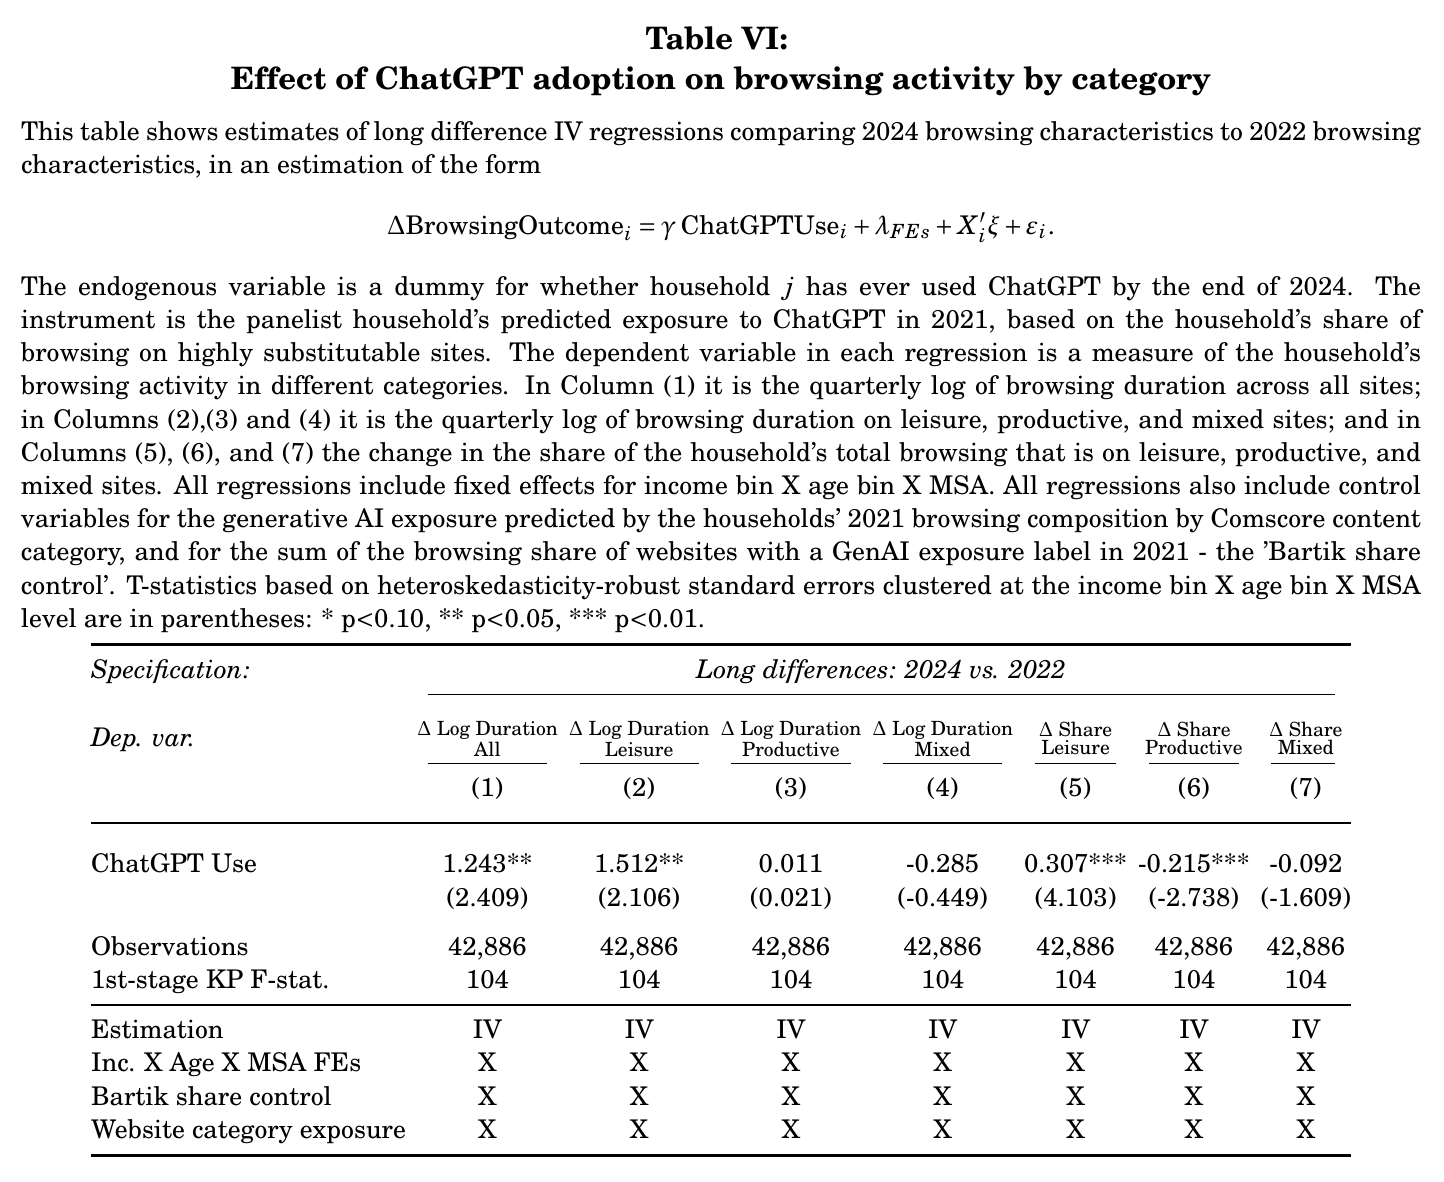
The ols version of the same regression says the opposite: without the instrument, ChatGPT use is associated with more productive browsing and a slightly lower leisure share. The whole selection story lives in that sign flip. People start using ChatGPT in the weeks when their lives get complicated, and complicated lives generate productive browsing on their own.
What people actually use it for. Here is the part that makes the leisure result interpretable rather than merely odd. The authors carve the panel into roughly 3.6 million thirty-minute windows and ask what a household is browsing immediately around a ChatGPT visit, benchmarked against a never-user matched on demographics, day of week and time of day. Inside a ChatGPT window, browsing is 80.1% productive and 7.6% leisure — a 25.2 point excess of productive browsing and a 13.7 point deficit of leisure relative to the matched non-user. The sites that cluster around ChatGPT use are Google, Instructure, Canva, Quillbot, Quizlet, Indeed, Pearson, Blackboard, Grammarly, Chegg. This is homework, job applications and paperwork.
The sites that are conspicuously missing from ChatGPT windows are YouTube, Facebook, Amazon, several adult sites — and Wikipedia. Wikipedia, recall, is the single most chatbot-exposed site in the whole classification. The encyclopaedia scores five out of five on substitutability and then, when the substitute arrives, duly gets substituted. It is a nice piece of evidence precisely because it is an absence, which is also the paper’s methodological signature: nothing here is measured as output, everything is measured as something that stopped happening.
Turning absence into a number. Since browsing time is observed and household output is not, the productivity gain has to come out of a model — a time-allocation framework adapted from Aguiar, Bils, Charles, and Hurst (2021), in which a household splits digital time between leisure and home production under isoelastic, additively separable utility. The curvature parameters and decide whether an activity is a time luxury (above one) or a time necessity (below one). Engel elasticities estimated on age-income-region cells, with local rainfall instrumenting total time online — it rains, you stay in, you browse — put productive browsing below one and leisure above one, exactly the configuration under which a productivity shock to chores buys you leisure.
Then the inversion:
is the proportional efficiency gain on productive digital tasks, are the IV treatment effects on log time in each activity, and is the ratio of Engel elasticities; this is equation (17). Read it as an accounting identity for a missing hour. Leisure browsing rose 151 log points. Scaled by the Engel ratio of about 0.68, productive browsing “should” have risen by roughly 102 log points on the strength of that alone. It rose 1.1. The 101 log points that failed to show up are attributed to efficiency, giving the 175% figure.
Note what is on the left-hand side. Not — but , a scaled efficiency gain. Converting it into a raw one requires knowing , which requires knowing the average curvature , which the data do not pin down. Hence a sensitivity table, and hence the surprising thing.
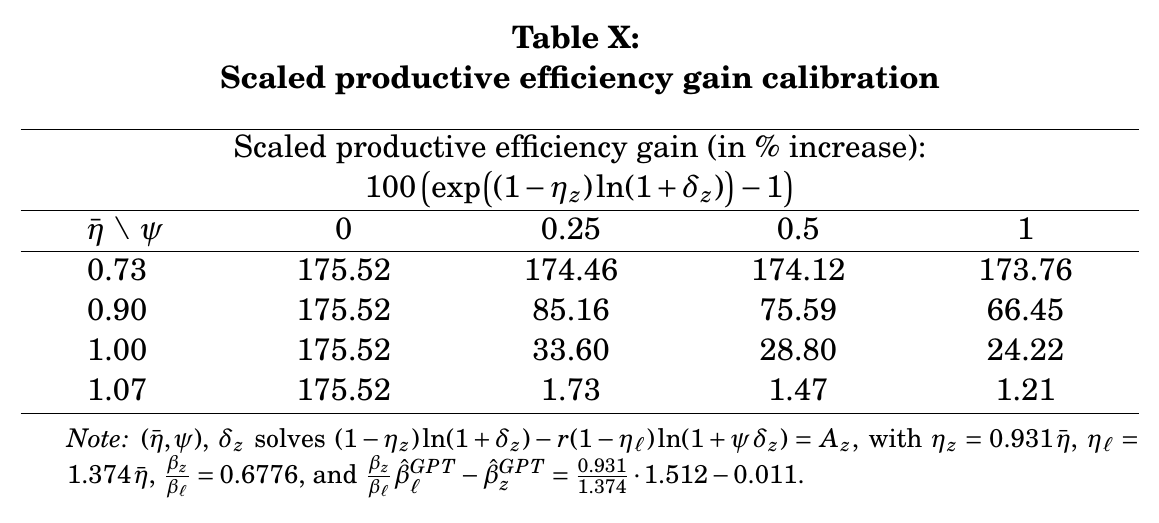
The headline number and its own refutation live in the same sixteen cells. Set , the ratio of leisure to productive efficiency gains, to zero and the answer is 175.52% no matter what you assume about curvature — the entire first column is the same number. Move to the paper’s preferred and the answer is 85.16%, 75.59%, 66.45% as rises. Move to 1.07, the top of the range the data admit, and the answers are 1.73%, 1.47%, 1.21%. The distance between “generative ai roughly doubles household productivity” and “generative ai does approximately nothing” is the distance between 0.90 and 1.07 in a parameter the authors describe, accurately and without embarrassment, as a pragmatic choice. The relative result — leisure up, productive flat, gap unexplained — is tightly identified. The level is not. Everything published as “76% to 176%” is a scaled object read off a grid at a chosen point.
(A small thing the draft should fix: the text quotes leisure sites’ average activity exposure as 17.7% and productive sites’ as 50.7%, then computes the ratio as 0.117/0.507. The 0.23 that gets carried forward is the one from the arithmetic as written.)
And there is no dollar figure. None. No consumer surplus estimate, no billions, no gdp-B style valuation — which is worth stating plainly, because a paper that says household chores got twice as fast is exactly the paper you would expect to arrive with a headline dollar number attached, and this one declines. Blank closed by naming the missing step as future work: the next thing is to “translate this into welfare effects and kind of uh speak to how much of the missing productivity effect of gdp of chatbt use at home is missing from the gdp statistics” (06:47:29). The welfare claim in the paper as it stands is ordinal — the household reaches a higher indifference curve — plus that scaled number. Given how much of the scaled number rides on , declining to dollarize looks less like modesty than like arithmetic.
The discussion. Beraja took all three session papers together and refused the obvious framing that they measure ai at three layers. His organizing claim was that ai is a technology that accelerates learning, and he started with the household paper because households sit earliest in that chain — people searching for ideas and jobs and skills, which becomes firms, which becomes national accounts. His translation of “productive online tasks” was pre-market-entry learning, and he granted that the paper already goes a long way on the education and job-search part. The push was on the part he thinks the data can support and the paper doesn’t do: entrepreneurial ideation, people at home researching and discarding project ideas, which becomes pre-entry selection and eventually becomes firms. “I would push you to do way more on this” (06:59:30). His reason for caring is quantitative: in his work with Talamàs (2026), two sufficient statistics from Census data — mature firms about three times the size of young ones, young firms exiting about seven times more often — bound the aggregate gain from perfectly accelerating learning at a factor of two. His ask of everyone was to report efficiency gains in units of years of learning accelerated, so macroeconomists can put them in models.
The authors did not answer on the record. The chair offered the panel about a minute at the very end, there was a pause and some laughter, and one of the three said: “I just want to thank you. It was really nice and you gave us some new ideas to exploit entrepreneurship” (07:09:49). The captions do not identify the speaker, so treat the attribution as uncertain. That is the whole reply to the discussion.
The sharpest exchange came earlier, from a questioner the chair addressed as “Eric” — almost certainly Erik Brynjolfsson, who Beraja thanked as an organizer, though the captions spell it that way so hold it loosely. His point: you have second-by-second data, and you are using a once-and-forever dummy. Someone who tried ChatGPT in March 2023 and quit is coded identically to a daily user. Surveys show usage falling for some people. Blank agreed the point was well taken, said they have the intensive-margin measure and used it only as a robustness check, and the follow-up was the good part: “You can say I mean honestly that would have been the first thing I would have looked at. But but what what what is is there anything you can say about what what that showed?” (07:07:52). The answer was that the treatment effects are similar when scaled by the alternative endogenous variable, and Blank then volunteered the more interesting version of the question himself — whether the generative ai divide extends from starting to continuing. On churn: no sign of a dip through the data’s end in December 2024, with the caveat that aggregate stability can mask within-person turnover, and the panel is about to be extended through 2025.
A co-author added a coda from the floor — not named by the chair, so again uncertain, though the content about Comscore and conversations with OpenAI fits Zhang, whom Blank had said was in the audience — that they are looking at substitution between computer and mobile, because there is a large rise in mobile use toward the end of the sample. This matters more than it sounds. The panel is desktop-only, despite the talk’s mention of trackers on phones and the pile of unused smartphone, search-query and shopping data. If ChatGPT use is migrating to phones exactly as adoption accelerates, the first stage is attenuated, and an attenuated first stage inflates the IV estimate — the same estimate that, divided by an Engel ratio and read off a calibration grid, becomes 175%.
Which leaves the finding standing on its most defensible version, and it is a good one: households overwhelmingly use ChatGPT to do work — homework, job applications, forms, research — and the visible, measurable consequence of all that work is that they read less news, search less, browse Wikipedia less, and play more games. The productivity showed up. It just showed up as free time, which the national accounts have never had a column for, and which the household in question would probably describe not as non-market output but as having gotten the tax return over with.