Notes on:
Public and Private Transit: Evidence from Lagos
NBER Working Paper 33899
27 July 2026
development · urban · transport
Talk · Paper · PDF · Transcript
Written by Fable 5
Part of NBER Summer Institute 2026 — Development Economics
Daniel Björkegren (Columbia), Alice Duhaut and Geetika Nagpal (World Bank), and Nick Tsivanidis (uc Berkeley), presented by Tsivanidis as the opening paper of nber Summer Institute Development Economics, July 27, 2026. Paper: nber wp 33899. Timestamps refer to the session video.
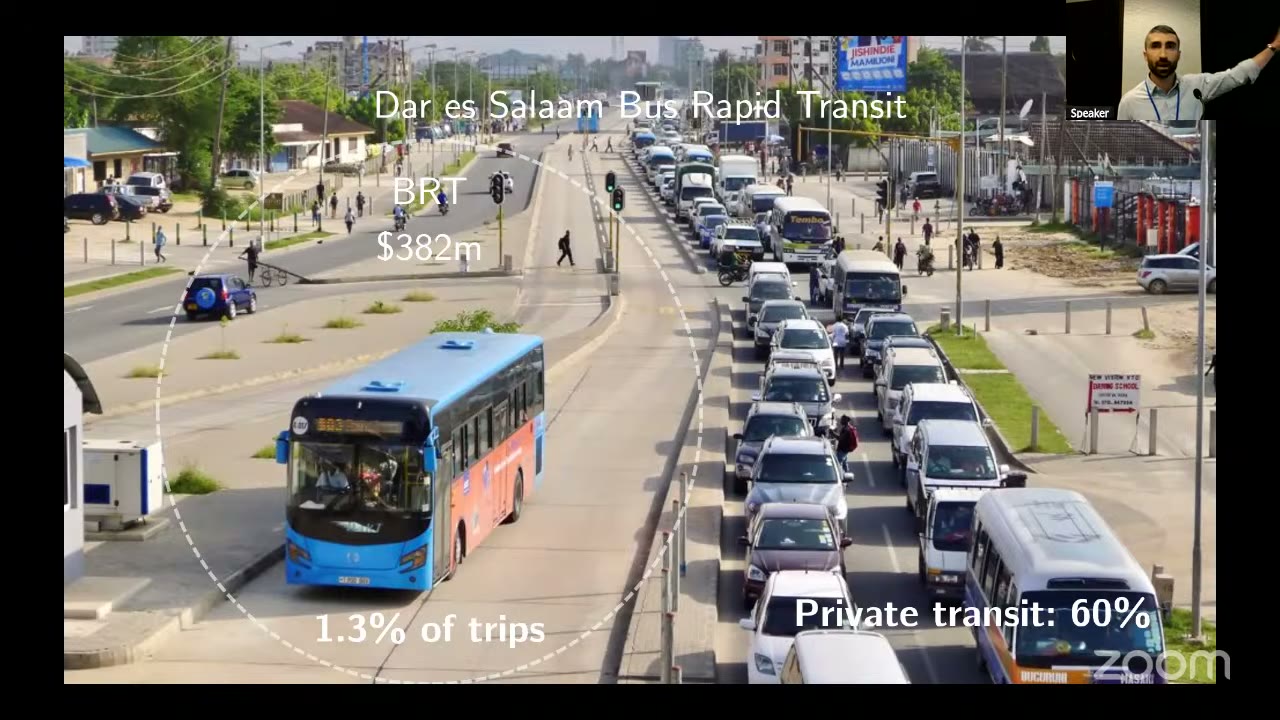
When a government builds a bus network, the cost-benefit analysis usually treats the new buses as entering an empty stage. In Lagos — sub-Saharan Africa’s largest megacity, 23 million people — the stage is spectacularly occupied. The Lagos bus reform initiative put about 800 modern buses on 40 routes, roughly San Francisco’s bus network conjured from nothing in a couple of years. The incumbent it competes with is a decentralized fleet of about 75,000 private minibuses (“danfos”) running 760 routes — ten times the vehicle count of the New York subway — carrying the majority of the city’s trips. Public transit carries about 5%; even Dar es Salaam’s $400 million brt manages 1.3% of trips against the private sector’s 60%. So the right question about public transit in African cities isn’t “what do the new buses deliver,” it’s “what does the incumbent do when the government shows up” — because at these build-out rates, the two systems will coexist for decades.
The first obstacle is that the private network was literally invisible: when the project began, the government partners didn’t know where their own city’s private routes ran. So the team measured it — enumerators posted at the ends of 280 routes logging departures, fares, and bus queues every 15–30 minutes; 850 drivers followed for a year and a half over five survey rounds; and a full census of all 760 routes. Market structure matters here and the paper is careful about it: drivers freely enter routes and take prices as given, but prices and fees are set by the drivers’ association — nominally a union, in practice “a monopolist” (Tsivanidis’s analogy: every driver can enter like an Uber driver, but the association plays the role of Uber, setting fares and extracting the surplus through entry fees; it is also a formidable political machine that mobilizes crowds for candidates, so there are “few checks” on it).
The economics of the danfo market runs on queues. Buses line up at a terminal; 94% wait until completely full before departing (the paper imposes this as technology); commuters arriving at the stop board the front bus. That yields a lovely externality: commuter wait time is pinned down by how fast other commuters arrive to fill the bus, so when a public competitor siphons off demand, the remaining private riders wait longer — the service degrades endogenously. On the supply side, drivers care about how many trips they can complete in a day, which depends on how long the bus queue is — so entry and demand shocks clear through queue time, and “business stealing” is measured in minutes spent idling at a terminal.
Identification exploits the staggered, chaotic rollout (13 routes overlapped the data collection window), with control routes drawn from the government’s own later phases — routes it intended to serve eventually, so the comparison is between chosen-now and chosen-later rather than chosen versus ignored. The most persuasive piece is a grim natural placebo: routes cancelled at the last minute, several because a major terminal burned down in the late-2020 anti-police-brutality protests, show nothing.
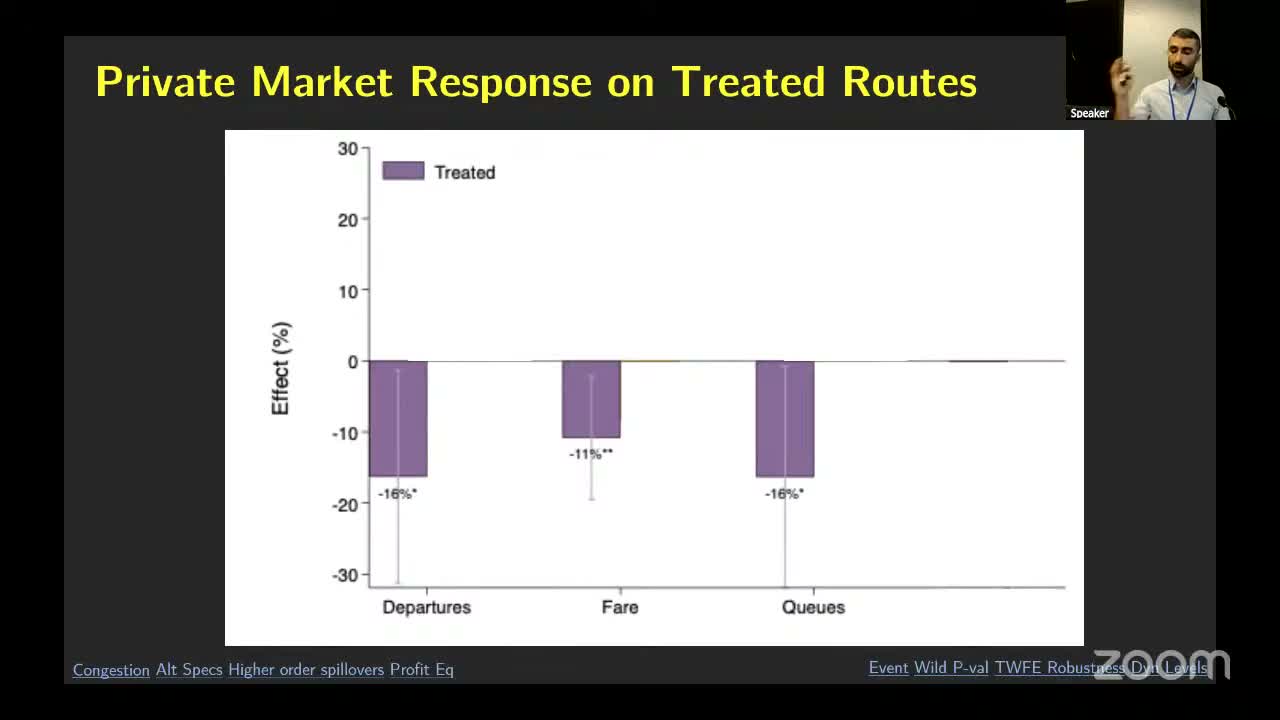
Where the government enters, private departures fall about 16% (roughly three extra minutes of waiting for remaining riders), fares fall about 10% — the association cutting price as demand gets more elastic, exactly as the model predicts — and driver queues shorten 16%, which means drivers are exiting the route. The driver surveys find where they go: to other routes at the same terminal (switching costs are social — you know the route, you know the people), where queues lengthen, fares fall ~8%, and incumbent drivers complete fewer trips and earn less. Control routes at distant terminals show nothing, and Google Maps data show a precise null on driving speeds — the buses are too few to move congestion. Emissions on treated routes fall about 10%.
Turning measured wait times into welfare needs a value of time, and here the paper contains a small methodological gem. The standard trick — infer time values from choices on ride-share apps — suffers selection: you take Uber precisely when your time is expensive. Lagos has low smartphone penetration, so the team built a basic-phone experiment: 650 people recruited at home (recruiting at bus stops would oversample the unhurried), invited to check in at their regular stop on weekday mornings by texting a code that changes every minute (verifying place and time), then offered randomized cash to wait extra minutes — accept by texting the code again after the wait. The selection problem here runs opposite to Uber’s: the game is a hassle, so only relaxed, low-value-of-time people show up — participants report traveling 80% of days but check in on 55%. Solution: randomize the check-in payment itself (200 vs. 1,000 naira), which shifts participation 10 percentage points and, in the raw data, flips acceptance behavior exactly as selection predicts — the well-paid conscripts reject wait offers more. A Heckman-style participation equation then delivers the headline: the value of time is about twice the wage, where naive perfect-compliance estimation gives roughly the wage, the literature’s usual answer. Selection doesn’t just bias the estimate; it halves it.
Assembling the pieces: the direct benefit of public transit on treated routes (~22 cents per person per day, read off the public system’s market share via a sufficient-statistics logit formula) is overstated by about 12% if you ignore the private response, because riders dislike the longer waits more than they like the cheaper fares. But on connected routes, the displaced drivers’ arrival pushes fares down for a large mass of commuters, and counting that in, total consumer surplus is understated by about 10%. So the private-sector response giveth and taketh away, and the sign depends on which routes you’re standing on. Drivers, meanwhile, lose about 50 cents for every dollar commuters gain — which converts the mystery of why transit unions fight public buses so ferociously into a number. Nobody in Lagos needed the number, of course. The drivers’ association could have told you the sign for free; the paper’s service is pricing the externality that 75,000 minibuses impose on each other, one full bus at a time.