Notes on:
What Work Does Generative AI Do?
NBER Working Paper 35677
7 May 2026
generative AI · survey measurement · labour markets · adoption
Talk · Paper · doi · PDF · Transcript
Made with AI: Opus 5 (reading and writing)
Part of AI and Economic Measurement, Spring 2026
“What Work Does Generative ai Do?”, by Alexander Bick (Federal Reserve Bank of St. Louis), Adam Blandin (Vanderbilt), David J. Deming (Harvard) and Tyler Schumacher (Vanderbilt); presented by Bick at the nber conference on ai and Economic Measurement, Stanford, 7 May 2026; discussant Kristina McElheran (University of Toronto), who took all three papers in the session together. Written from the draft dated 27 April 2026, later nber Working Paper 35677.
The numerator problem
Say you would like to know what share of the writing done in the American economy is now done with the help of a chatbot. You are in luck, because you work at a company that owns a chatbot, and you have hundreds of millions of conversations sitting in a warehouse. You sample them, you hand them to a classifier, you ask the classifier which work activity each conversation is about, and you get a beautiful number: something like fifteen percent of these chats are people editing written materials.
Now notice what you have not learned. You have not learned what share of editing is ai-assisted. You have learned what share of ai is editing. Every piece of editing done by a person alone with a red pen at eleven at night produces no conversation, no log, no row in your warehouse. Your sample is conditioned on the outcome you are trying to measure. You have an exquisite numerator and structurally no denominator, because the denominator consists precisely of the events that declined to generate data.
This is not a bug in anyone’s classifier. It is a property of the sampling frame, and no amount of classifier improvement fixes it, because the missing observations were never observations. To turn a chat share into an adoption rate you need one thing the logs cannot contain: how common the task is out in the economy, among people who mostly are not talking to your chatbot at all.
Anyway, Bick, Blandin, Deming and Schumacher went and asked people. Their instrument is the Real-Time Population Survey, a ten-minute online survey Bick and Blandin have run since April 2020, about five thousand respondents a wave, quarterly since August 2024, fielded through Qualtrics. Its distinguishing trick is that it clones the core module of the Current Population Survey — same wording, same branching — which lets the authors rake their responses against the cps and reweight to national representativeness. “What is key to the survey,” Bick said, “is that we replicate the core module of the current population survey, which then allows us to weight our survey responses against the cps.” As of the February 2026 wave, 51% of us adults aged 18 to 64 use genAI for non-work purposes, 43% of workers use it for work, and 58% use it for something.
The harder problem is tasks. You cannot read a survey respondent 2,040 detailed work activities. So the survey does it in three steps. It elicits your occupation precisely, using a free-text box with autocomplete over 40,000-odd job titles, and, for the roughly sixty percent whose typed title does not resolve to a unique code, five probabilistic matches from a job-title autocoder. It then looks up the ten most important Detailed Work Activities that onet assigns to your occupation and shows them to you, asking which ones you actually do. Only then does it ask which of those you use genAI for. The median worker says they do five of the ten; the mean is 4.7; only 1.2% select none.
That third step is the whole paper. It produces an object the chat logs cannot produce: among workers who perform task , the share who use genAI for it.
What the denominator buys you
With a denominator you can say things like: at least one in five workers uses genAI in about 80% of occupations and about 40% of tasks, which sounds like a technology that has gone everywhere, until you notice that roughly 40% of occupations sit in the band where a fifth of workers use it and more than half do not. Around 15% of occupations clear 70% adoption. Exactly one clears 90%.
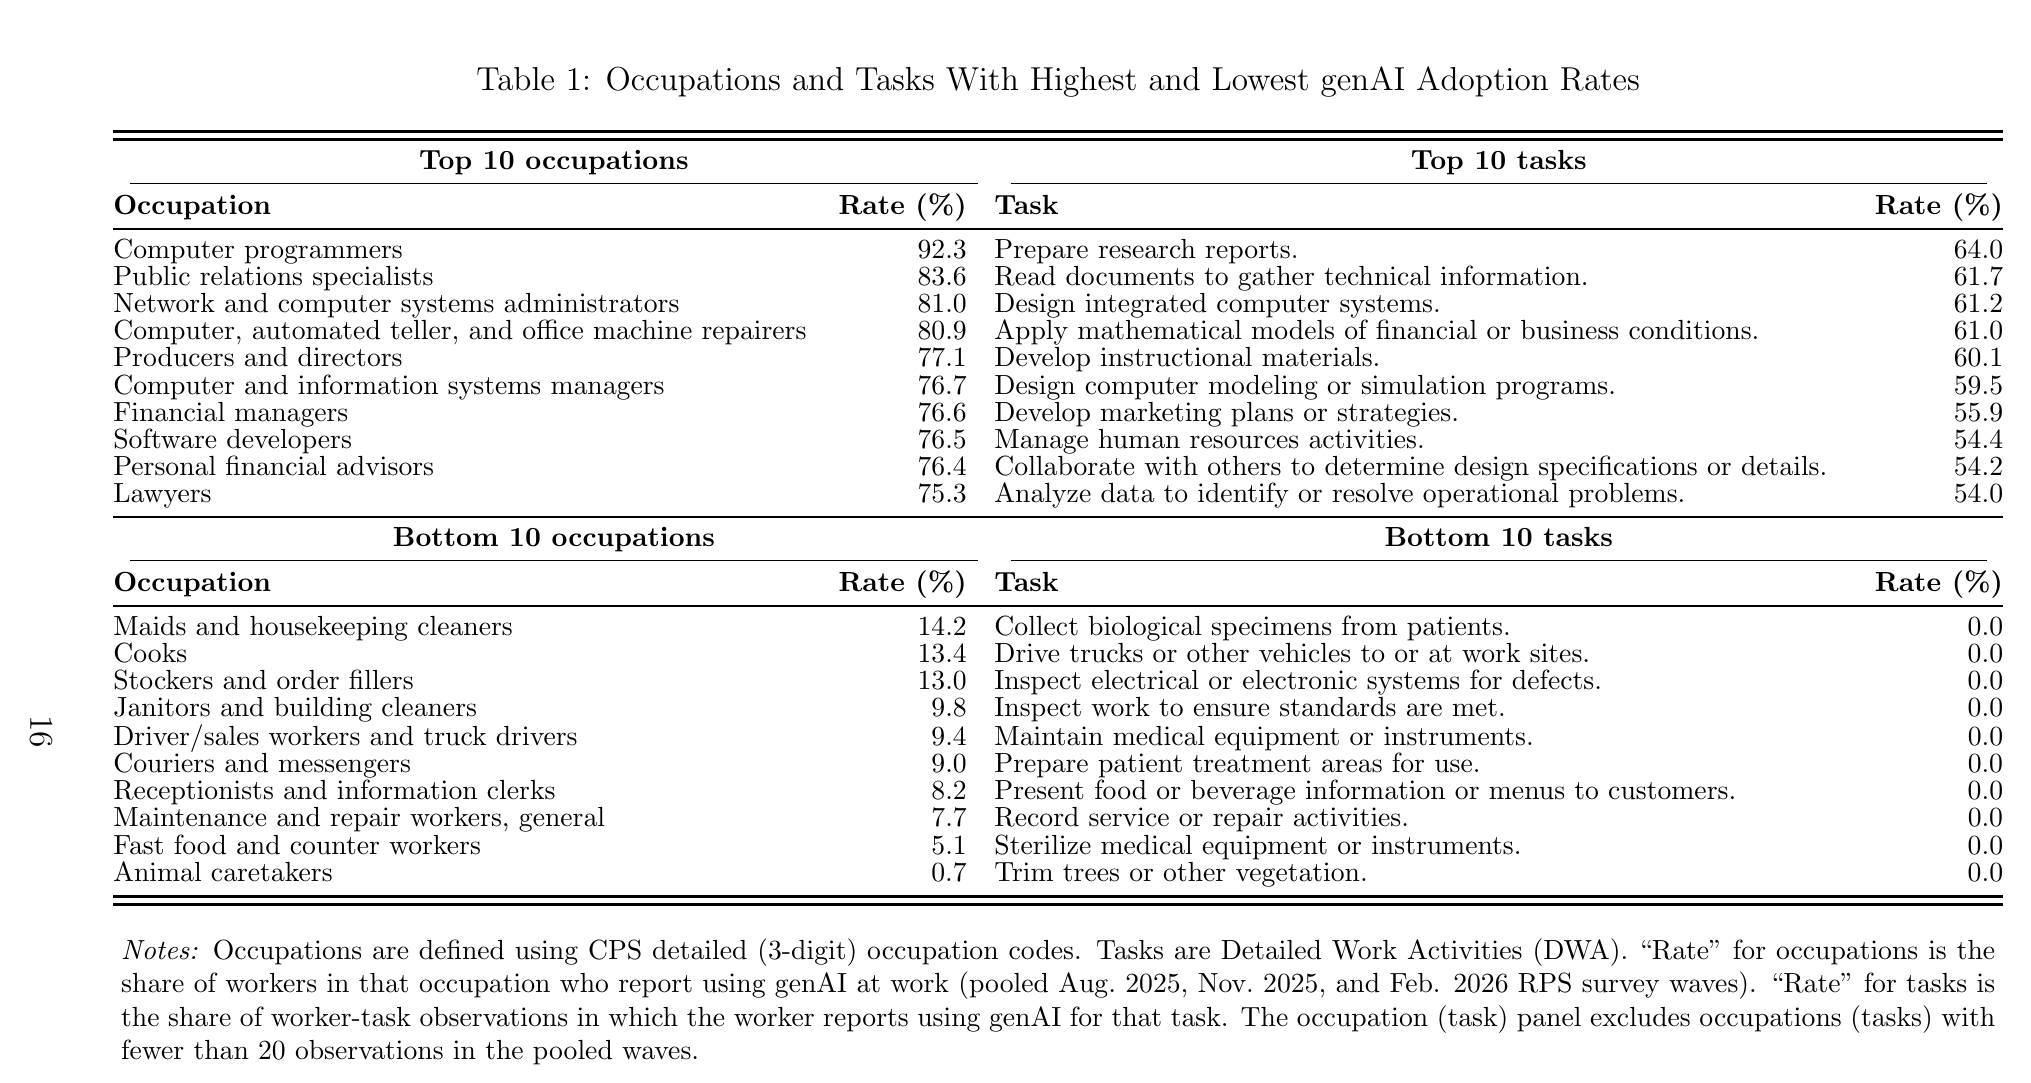
That one is computer programmers, at 92.3%, followed by public relations specialists at 83.6% and lawyers at 75.3%. At the bottom: fast food and counter workers at 5.1%, and animal caretakers at 0.7%. The task panel is stranger. Only 2% of tasks have adoption above 50%, and none exceed 70% — the best is “Prepare research reports” at 64.0% — while ten separate tasks come in at exactly zero, including driving trucks, sterilising medical instruments and, as Bick noted from the podium, “presenting food or beverage information and menus to customers is surprisingly little ai involvement.” The implication is worth sitting with: a 92% occupation is not one task everybody does with ai. It is a bundle of moderately-adopted tasks that between them catch almost everyone at least once.
The paper hangs all of this on an accounting identity that is deliberately boring:
Here is task ’s share of all work in the economy (occupation employment shares times task ’s weight inside occupation ), is the share of workers doing who adopt genAI for it, and is the productivity gain conditional on adopting — equations 3 and 4 in the paper. The survey measures the first two directly; exposure scores are a proxy for the third. Chat logs measure none of them.
What chat logs measure is , task ’s share of all chats. Bick’s version: “if you think about what is this chat share, it’s nothing else than that you identify a task conditional on ai usage.” The two objects are related, and the relationship is the least glamorous theorem in statistics:
That is Bayes’ rule with the labels changed — the probability you adopt for given that you do equals the probability a genAI use is , times the overall adoption rate , divided by how common is; equation 7 in the paper. The corollary the authors draw one line later (equation 8) is the one that matters: the ratio of two chat shares equals the ratio of two adoption rates only when the two tasks are equally common, . Chat rankings are adoption rankings by coincidence, and only by coincidence.
Four datasets, four different favourite tasks
Bick opened by saying he was “very fortunate” that the previous speaker — the Microsoft Bing Copilot chat-log paper (Tomlinson et al. 2025), immediately before his in the same session — “presented in front of me because he’s setting up the stage for me.” He then spent the back half of the talk explaining, politely, what a chat log is not.
Three wedges sit between and even before the classifier opens its mouth. OpenAI (Chatterji et al. 2025) and Anthropic (Handa et al. 2025) both exclude enterprise accounts, so a platform’s users are not the economy’s adopters. Chats are not evenly spread across task instances: if writing takes twenty exchanges and a lookup takes one, sampling chats oversamples writing — “that’s going to skew the measure to writing because you’re way more likely to sample this” — though it does, conversely, pick up an intensive margin the survey has no way to see. And then the classifier. “For most people in the room, economists, we presumably use it a lot for coding, but coding is just not a task in onet for economists.” The onet activity for an economics professor is “Research topics in area of expertise.” A classifier reading a chat about cleaning a dataset will file it under “Analyze data to identify trends,” which belongs to nobody in that occupation.

Which brings us to the slide that carries the paper. The top task in the OpenAI data is “Edit written materials,” at 15.3% of chats. In Anthropic’s it is “Design computer systems,” at 15.7%. In Copilot’s it is “Gather information,” at 23.2%. In the survey it is “Direct organizational operations, activities, or procedures,” at 4.0%. Four measurement instruments, four different modes, essentially no overlap — and each chat platform’s champion is an activity that onet assigns to almost nobody. Editing written materials is listed for 1.6% of the workforce. The survey’s champion is listed for 56.1%, and shows up in the chat data at 0.1%, 0.2% and 0.0%.
None of these tasks is rare in the world. The survey has a separate question that asks about writing and editing documents in plain English, without onet in the way, and about half of workers say they do it and about half of those use ai for it. The 1.6% is bookkeeping, not reality; the paper says as much, noting the true share “must be more than an order of magnitude larger.” (The draft says 1.6% in the introduction and 1.5% in the body, which tells you roughly how much weight the figure is asked to bear.)
The load-bearing fact is an asymmetry. Aggregate the tasks upward and the two chat sources converge on each other — Pearson correlation rising from 0.38 at the 332-category level to 0.72 at 37 categories and 0.94 at nine — while survey-versus-chat only reaches 0.54 to 0.58 and then stops. The chat sources disagree with each other about classification, which washes out when you zoom out. They disagree with the survey about something that does not wash out. Relatedly, the top 5% of tasks account for about 57% of measured genAI use in chat data and 19% in the survey, and a single task explains between 47% and 60% of the total squared disagreement between any two sources.
Bick’s verdict is generous and, I think, correct: “there’s nothing wrong with these chat classifications … but I think onet is just not the right framework to think about it.” onet mixes generic activities (“Edit written materials”) with purpose-oriented ones (“Research topics in area of expertise”), and a classifier handed a chat will always find the generic label the more literal fit. The sting is in the tail. Anthropic’s data attribute something like 37% of tasks to computing, which people then read as evidence that programming occupations are heavily exposed; that is classifier gravity, not occupational composition. And a bill on Bick’s slide — the deck reads “Workforce Transparency Act of 2026 (Warner-Budd),” which is as much as the captions preserve — would require ai labs to publish the occupational composition and task mix of their users. Through onet, Bick said, “that is where that is creating the mismatch.” Somebody is about to legislate a statistic into existence using the wrong container.
The surprising part: adoption is person-shaped
Everything in the exposure literature, from Frey–Osborne (2017) to Eloundou (2024), treats “what work ai does” as a property of jobs. So the authors ran the horse race.
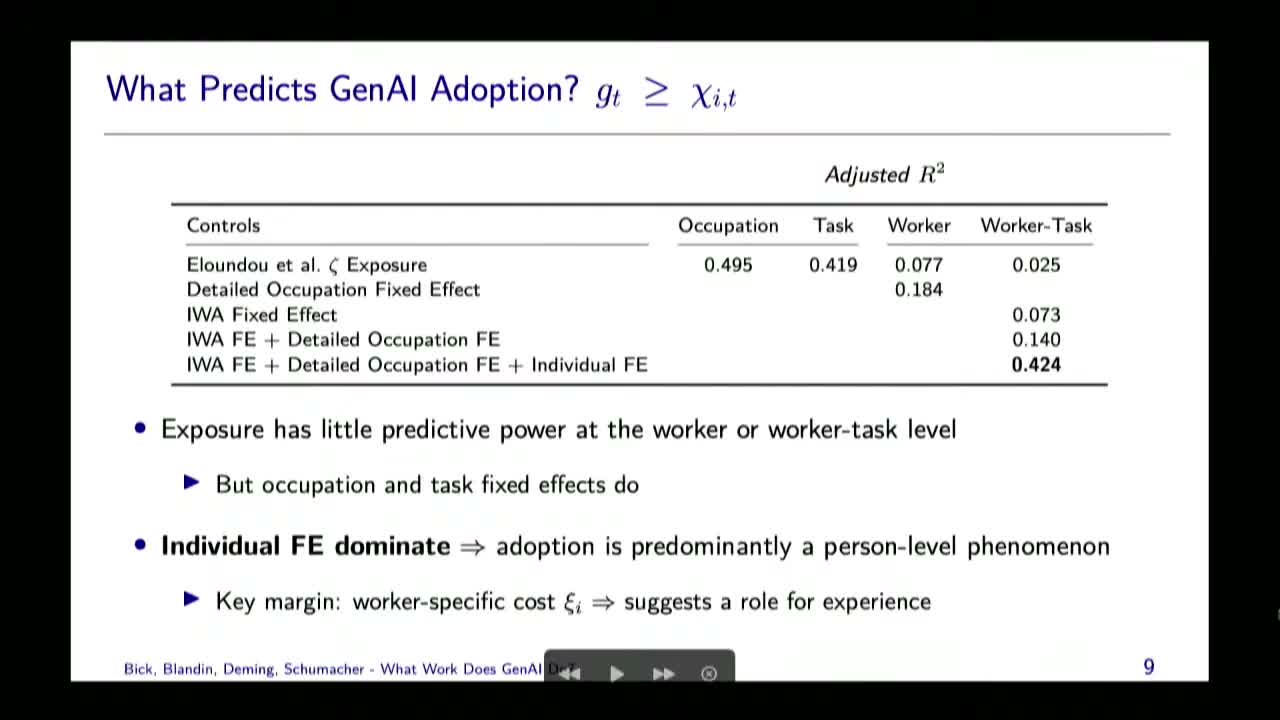
At the occupation level the exposure scores do fine: adoption on the strongest Eloundou measure gives a correlation of .729 and an R² of .531. Drop to the worker-task level and that same score explains 0.025 of the variation. Task fixed effects plus detailed occupation fixed effects get you to 0.140. Add individual fixed effects and you get 0.424. Demographics — sex, age, race, education — add almost nothing; in the paper’s own table, task fixed effects go from 0.074 to 0.098 when you throw them in, and then to 0.426 when you throw in the person. Bick, plainly: “if you tell me you use it for one task, I’m way better at predicting if you use it for another task than if you tell me what the exposure score is or what your occupation or even the task is.” (The draft’s prose says 0.435, its own Table 7 says 0.426, and the slide, a slightly different specification, says 0.424. The finding survives all three readings of it, which is more than most findings manage.)
The model’s name for this is : adoption costs decompose into a task-specific barrier — compliance, confidentiality, workflow — plus a persistent worker term plus idiosyncratic noise, and it is that the fixed effects are eating. The authors’ hypothesis is that is partly learned: using the thing once makes using it again cheaper. Three tests point that way. Workers already using genAI six months ago use it for 0.421 more tasks today. Instrumenting a worker’s other-task adoption with the leave-one-out adoption rate of those tasks gives a coefficient between 0.74 and 0.81, so a ten-point rise in your other tasks moves the focal task about eight points. And instrumenting work adoption with whether your employer encourages genAI gives a 0.533 coefficient on home use. Bick pre-conceded the whole thing: “any applied microeconomist in this room is going to nail me on all the identification. This is not airtight and I don’t want to claim that.”
One thing worth flagging, in the reader’s favour. The paper’s abstract says exposure measures “explain only about half of the variation across workers,” and the conclusion says “at most 53% of the variation in adoption across workers.” The 53% is the R² across occupations. Across workers it is 0.077, and across worker-tasks 0.025. The paper’s own summary commits, in one sentence, exactly the level-of-analysis slide its discussant had come to complain about.
What the discussant said
Kristina McElheran discussed all three session papers together, and her theme was that the profession has built “this edifice of thinking about exposure and worker implications that is all on this one narrow and I’m going to use Claude’s favorite term load-bearing column of onet data at the occupation level.” Her running example is Frey–Osborne’s 47%, against Arntz, Gregory and Zierahn (2017), who reran the identical machinery on worker-reported task content and watched the automation-risk number fall from 38% to 9%. She liked this paper for taking that seriously, and she liked in particular that its statistics have people in the denominator rather than list items — percentages of a list, she said, she cannot form a magnitude about; percentages of individuals she can.
Then two objections. The first is truncation, and she made it the honest way, by looking herself up. Her own occupation is business teachers, postsecondary. “Research topics in area of expertise comes in at number 11, which is below 10, which is sort of sad.” What does make the top ten is evaluating student work, at 4, and attending training sessions, at 6. “I don’t use ai to evaluate my students. I had a colleague at another school who did that and got in trouble. … I would love to use it for six — if it could attend meetings and training sessions for me, that would be fantastic. I use it down here, but I would be coded as a non-adopter, and that troubles me a bit.”
This never got answered on the record; the shared Q&A never came back to it. The paper’s standing reply is its validation section, where survey task prevalence correlates 0.722 with a cps-times-onet benchmark and 0.771 on person-task shares, with the fitted line hugging 45 degrees, and Bick’s pre-emption in the talk was that “of course there’s going to be some measurement error, no doubt, but what we show is that all task-related patterns … are quite stable across waves.” Which is a defence of aggregate task shares. McElheran’s complaint is about individual misclassification: the aggregate can be unbiased while a specific professor whose real ai use lives at rank 11 is scored a zero. Those are different objects, and in a paper whose headline finding is that individuals are the unit of interest, the second one is not obviously the less important.
Her second objection lands on the instrument. She granted that the individual fixed effects are the story, and then asked what “individual” is doing there: “some of it’s coming through firms. I think some of it’s coming through jobs. In the paper there’s a bit of a sense that these are intrinsic human preferences … but it requires that nerdy people do not sort into nerdy firms in ways that also affect their home ai use. And this is like everybody I know, right? This is highly selected.” The paper states the assumption in almost those words — its exclusion restriction rules out “that tech-savvy workers sort into tech-friendly employers in ways that also directly affect their home adoption” — which is the sentence she says is false of her entire acquaintance. Also unanswered on the record, and the stakes are not small: if the persistent term is the person, adoption diffuses slowly as people warm up; if it is the firm, then employer training and workflow design move the number next quarter.
The last question
The final exchange in the general Q&A did land here. A questioner the chair never named pointed out that the interesting thing to know is whether ai users are the ones who survive the next round: “when a recession comes, they just lay off the workers that are not using ai … it seems like what you have is you can totally answer that.”
Bick: “so I would love to but I can’t unfortunately, because it is not the actual cps — right, it’s our online survey — and the downside of these online surveys, to keep them affordable, is that you don’t have a panel dimension. … We can only ask retrospective questions. If you want to have a panel dimension from these online surveys, you have to pay them way more.” The questioner pushed once more — the cps has the same problem in its public release, and you can still ask people what they were doing last period — and Bick allowed that “we could get at some of that.”
This is the quiet crux. The paper’s most striking claim is that genAI adoption is a persistent property of a person rather than of a job, which is exactly the claim that a panel would settle and a repeated cross-section cannot. And the paper’s own best evidence for the learning channel already runs on a retrospective question — were you using this six months ago? — which is the very device the questioner was pointing at. The instrument that produced the finding is the instrument that cannot confirm it, and the fix costs money.
Which is, in fairness, the finding restated: the whole paper exists because someone was willing to pay for a denominator, and the chat logs, which are free and enormous and arrive by the hundred million, still cannot buy one.