Notes on:
The Costs of Building Walls: Immigration and the Fiscal Burden of Aging in Europe
Working paper
18 September 2026
immigration · population aging · public finance · Europe
Talk · Paper · doi · Slides · PDF · Transcript
Made with AI: Haiku 4.5 (research), Opus 5 (reading, figures, diagram and writing), GPT 5.6-Sol (reading), Fable 5.1 (adjudication), Sonnet 5 (verification)
Part of Macroeconomic Effects of Population Aging, Fall 2026
Tiago Bernardino, Francesco Franco and Luís Teles Morais argue that the euro area’s immigrants, who by the paper’s own estimates cost the budget more over a full lifetime than natives do, nonetheless lower the tax increase every resident will need to pay for aging, by about 1% of gdp a year. Teles Morais presented the May 2026 draft on 18 September 2026 as the first talk of the nber virtual workshop on the macroeconomic effects of population aging. The result sounds like a paradox. It is really a fact about ratios, and it is worth stating the fact before the paper does.
Here is the fact. You run an underfunded pension plan. In present value your liabilities exceed your contributions, and you will close the gap with a uniform surcharge on everyone’s contributions. A new member applies. On her own she loses money: over the rest of her life she will draw more than she pays in. Should you let her in? The naive answer is no. The correct answer is that it depends on how much she draws per euro she pays, compared with the plan as a whole. If the plan pays out €1.16 for every euro it collects and she will draw €1.05 per euro she pays, admitting her lowers the surcharge on everybody. She is a bad member. She is a better member than the average one you have.
That is the paper, more or less, with one twist that does most of the work. The other new members the euro area admits are babies, and babies are expensive. A 25-year-old arriving from outside the eu has already had her childhood, and somebody else paid for her schooling.
The demographic model
The theory is a three-stage Markov population, run twice. There are two lineages, natives and immigrants-plus-descendants , and each moves through young, working-age and old:
That is eq. 1 in the paper: is the stock in stage of lineage ; , and are the hazards of growing up, retiring and dying; is fertility; and is the inflow, which lands only in the working-age box of the immigrant lineage. Replacement fertility here is just , and the maintained assumption is that natives sit below it, .
Two results follow, and the paper states them as lemmas. With no migration the population shrinks toward zero along what the paper, with admirable deadpan, calls the “extinction path” (Lemma 1), and the dependency ratio converges to a high but finite level on the way down. (A footnote reassures you that treating people as continuous stocks “would break down for very small populations due to indivisibilities at the integer level,” which is true and which I choose to find comforting.) With any constant positive inflow the population instead converges to what demographers call a stationary-through-immigration population (Lemma 2), whose limiting dependency ratio is . Notice what is missing from that expression: . In the very long run the size of the inflow does not matter at all. The long run is the one horizon at which immigration policy is irrelevant, which is a reason to ignore the long run here, and Teles Morais did: the stationary state is “kind of 500 years from now in an empiric application,” and what matters is the transition (00:20:19).
The transition is Proposition 1: at every finite horizon, is strictly decreasing and strictly convex in . The intuition is a mixture. The aggregate dependency ratio is a weighted average of an old native lineage, whose ratio keeps climbing, and a young immigrant lineage, whose ratio starts low. More inflow shifts weight toward the young lineage, but the weight is bounded (you cannot put more than all of it there), so each extra unit of buys less. The proof (p. 41) is short once you see it. Population is affine in , so is a ratio of two affine functions of , and a falling ratio of that kind is convex. The slides wrote the mixture out explicitly, with the native weight (00:20:39); that notation is the deck’s, not the paper’s.
Someone in the room, unnamed in the recording, went straight for the assumption holding this together (00:22:08): migrants enter at the same age forever, but the rest of the world is aging too, so won’t the migrants of twenty years from now be older? “Absolutely,” Teles Morais said, and he conceded rather than fought. The steady state is a device, “in 50 years the characteristics of immigration will probably change a lot,” and the claim is really about “the next 10 20 years” (00:22:24). That is a fair answer. It is also a reminder that the headline number is a present value over a very long horizon, computed with a very fixed inflow.
From heads to euros
Dependency ratios pay for nothing, so the paper bolts on generational accounting. Per-capita revenue and spending profiles are estimated for 2019 by age, gender, education and country of birth (eu-born or not), held fixed, and grown at productivity plus inflation; a cohort-component projection supplies the populations. Then the paper asks what permanent, proportional increase in all revenues would make the government’s intertemporal budget constraint hold given today’s debt:
That is eq. 6 in the paper: and are per-capita spending and revenue of item for group in the base year , is the projected group population, is initial debt, is the growth-adjusted discount factor (0.986 in the calibration, p. 30), and , the “rebalancing tax increase,” is the uniform scaling of every revenue line that closes the gap. Because working-age people pay and the young and old receive, inherits the shape of , and the paper asserts (p. 17) that the migration-to- frontier is convex for the same reason. Asserted, not proved: Proposition 1 is about heads, and the step to euros is argued in words.
The deck was more explicit than the paper here. Slide 9 rewrites eq. 6 as a function of the inflow, and it is the cleanest statement of the whole argument:
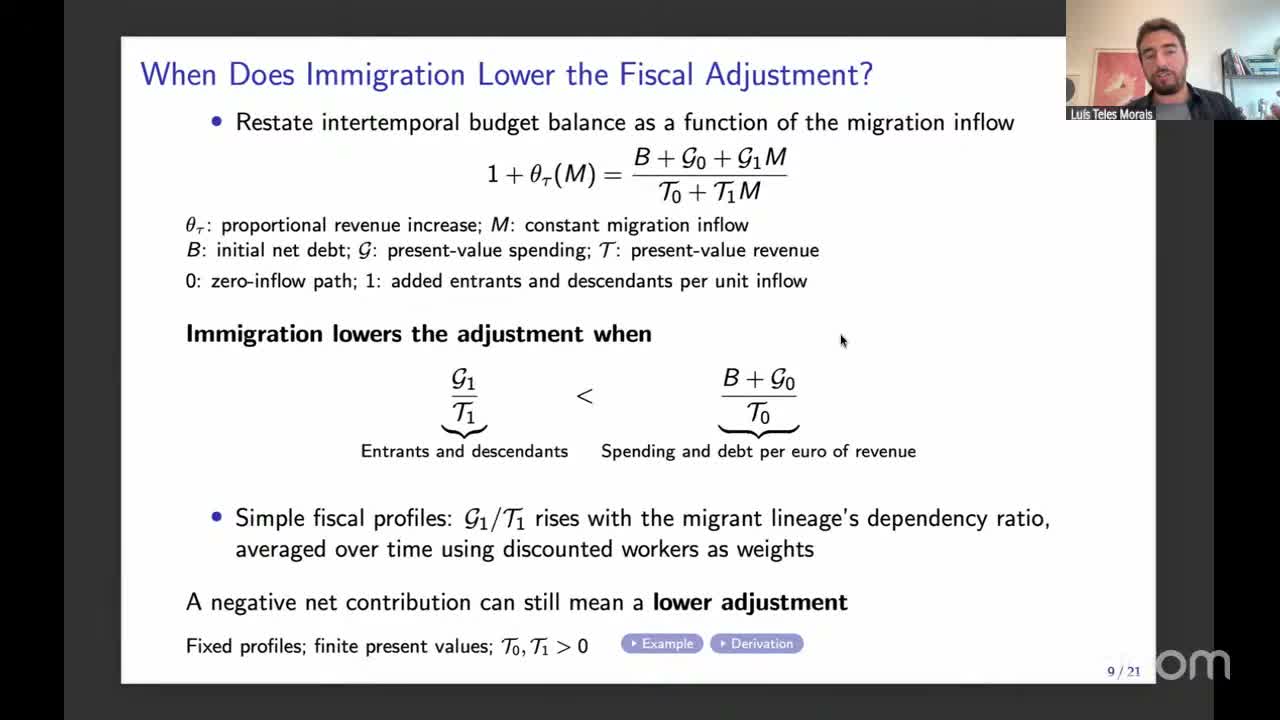
In words, , where the subscript 0 is the zero-inflow path and 1 is what each unit of inflow adds, entrants and descendants together, in present-value spending and revenue . Immigration lowers the adjustment if and only if . That is the pension plan from the top of this note, and the €1.16 was not invented: at zero inflow the paper’s is 16.3% (Table 4, below), so the euro area’s zero-migration path spends, debt included, about €1.16 in present value per euro it collects. The yardstick an immigrant has to beat is not zero. It is the system’s own imbalance. (Two cautions. This ratio condition appears on the slide and not in the paper, which makes the same point through a different benchmark, below. And an observation of mine rather than the authors’: a linear-fractional function of this kind is convex where it falls and concave where it rises, which is what the few countries where immigration hurts look like in Figure 6.)
This is also where the first question from the room landed. Before the model section, a questioner the chair and presenter call Larry (presumably Laurence Kotlikoff, the generational-accounting Larry) pointed out that Auerbach and Oreopoulos (1999) had found roughly zero present-value effect for the us, and asked why the welfare costs of immigrants’ children and older parents didn’t swamp the tax gains (00:14:15). Teles Morais’s answer was that both sides of the ledger are in the data, and that the net contributions are indeed negative, but “the combination of their taxes and benefits with the age compositions of immigrants is such that even though their net contributions are negative they still reduce the adjustment” (00:15:06).
The newborn benchmark
The paper’s own version of the yardstick is a native newborn. Here are the numbers:
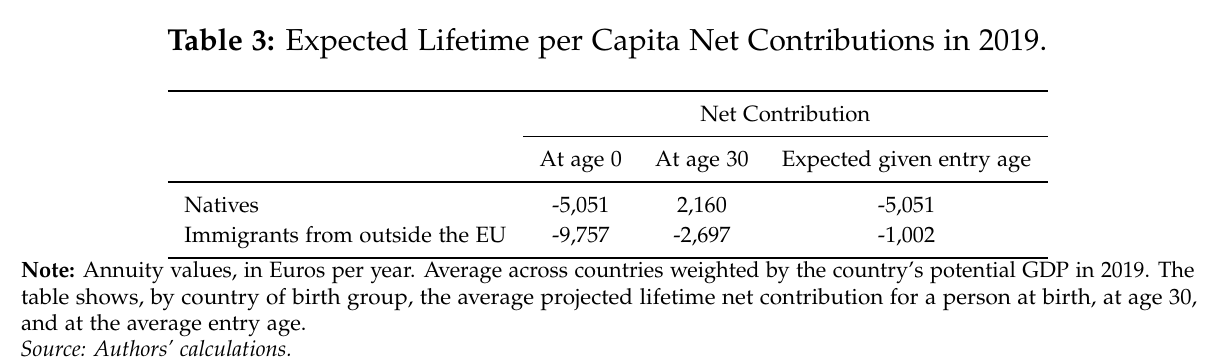
Read across the bottom row. From birth, a non-eu immigrant contributes −€9,757 a year in annuitized terms, nearly twice as negative as a native newborn’s −€5,051. At 30 the immigrant is still negative (−€2,697), while the native 30-year-old is positive (+€2,160). By any like-for-like comparison the immigrant is the worse fiscal proposition. But nobody arrives as a like-for-like comparison. The relevant entry is the last column, the expected remaining-lifetime contribution given the age at which immigrants actually arrive: −€1,002, which the paper notes is about €4,000 a year above the native-newborn benchmark (p. 24). The other entrants to the population are babies, and at −€5,051 they are the more expensive ones.
The talk’s slide showed only the age-0 and age-30 columns, the speaker rounded −€9,757 to “minus €10,000” (00:31:35), and his “key comparison” was the 30-year-old immigrant against the native newborn, −€2,697 versus −€5,051 (00:32:01). Same direction, but the paper’s operative number is the entry-age −€1,002.
The headline
With the yardstick in hand, the counterfactuals are simple. Hold the 2019 inflow (0.4% of the 2019 population a year, with its age and education mix) forever, or shut it off, or double it:
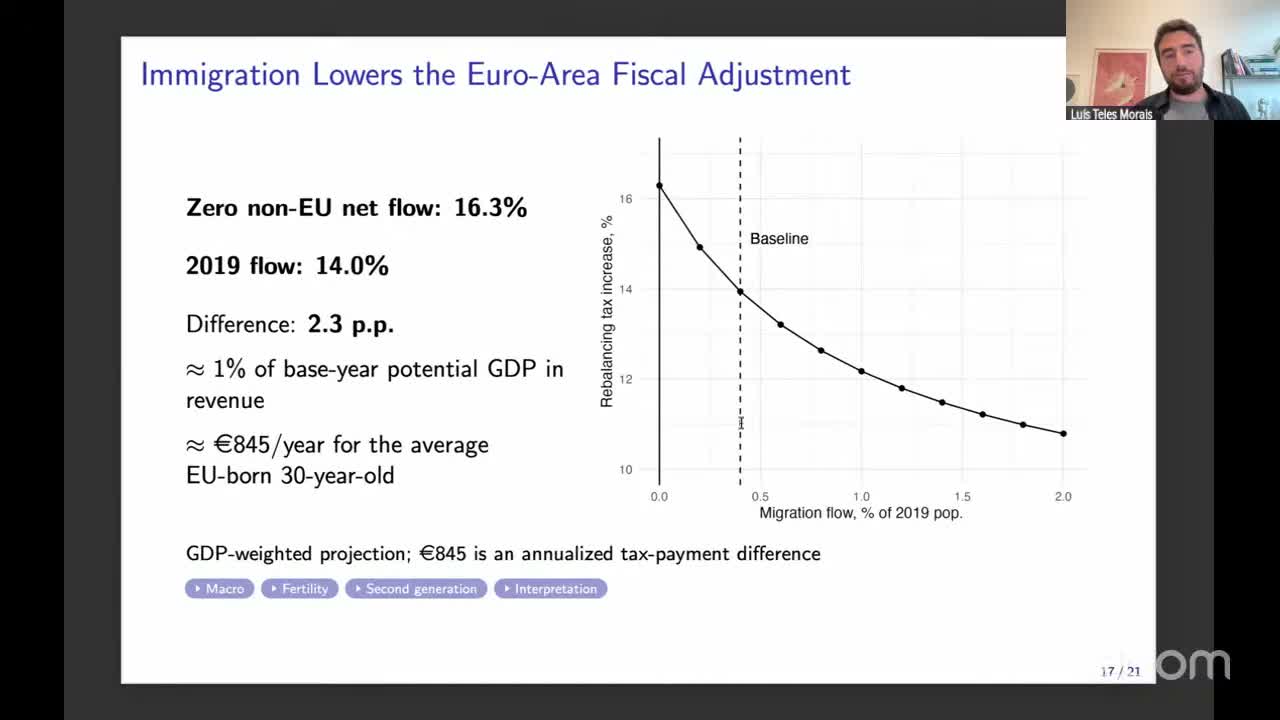
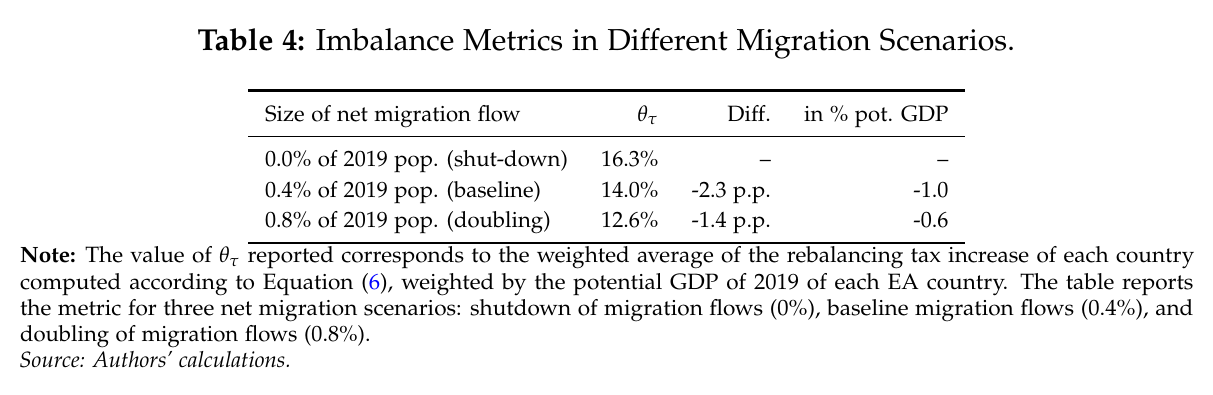
Shutting the door raises from 14.0% to 16.3%, 2.3 points or about 1% of potential gdp a year. Doubling the inflow lowers it only another 1.4 points, to 12.6%. At a 2% inflow, “a level well above any historical migration experience,” is still 10.8% (p. 27), so this is relief and not rescue; for scale, the 14% baseline is 5.9% of gdp of extra revenue each year on top of the 42% the euro area already collects (p. 27). The paper calls the 2.3 points “a 16% reduction” (p. 4), which is 2.3 over 14.0. In the talk it became “something like 20%” (00:12:57), which it is not by either base (2.3 over 16.3 is 14%). Per head, the paper puts the cost of shutting the door at €845 a year for the average native 30-year-old, who would pay €6,048 rather than €5,203 (p. 28); the speaker said “around 850” (00:33:45).
Prices are fixed, apart from a Clemens (2022) correction for the capital income extra workers would generate (p. 17); migration is exogenous, profiles are frozen at 2019, and policy does not respond. It is generational accounting with a sharper demographic engine, and should be read as one.
Why not just have more babies
The obvious domestic alternative is to make more workers. The newborn benchmark already tells you why this disappoints, and the paper runs the experiment anyway:
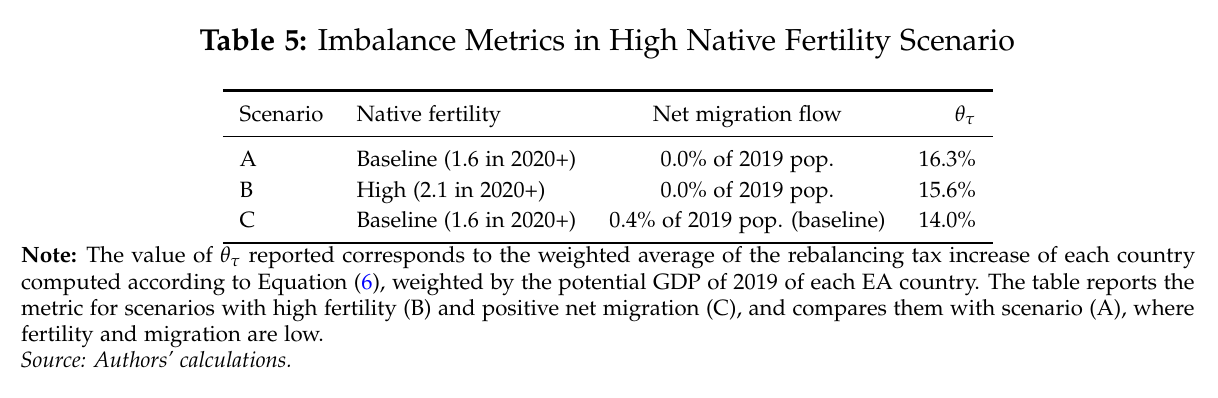
Raising native fertility to replacement, with the border closed, takes from 16.3% to 15.6%, a relief of 0.7 points against 2.3 for keeping the 2019 inflow. Worse, the high-fertility scenario runs higher dependency ratios and primary deficits than the no-migration scenario for the first 40 years of the projection (p. 29), because each extra baby spends two decades as a pure cost before it becomes a taxpayer. An immigrant is a worker delivered with the childhood already paid for; a baby is a worker on a twenty-year settlement lag. (The deck’s slide 18 printed 15.2% and a “1.1 p.p. relief” for this same scenario. The speaker skipped that slide, “I will skip this in the interest of time” (00:33:57), so the numbers were never voiced; the paper’s 15.6% and 0.7 points are the ones to use.)
Ronald Lee, presumably (the chair calls him Ron), asked the mirror-image question mid-talk: do immigrants’ fertility and education converge to natives’ over a few generations, as they do in the us (00:25:56)? Teles Morais said fertility follows Eurostat’s convergence assumption, and that keeping migrant fertility high barely changes the result “because it turns out that the effect of high fertility of immigrants would come much later” (00:29:16; the robustness is Table D.3, p. 54). Same timing argument, pointed the other way: children born to immigrants are, fiscally, just more babies.
Country by country, and the sign flips
The euro-area aggregate hides a lot. What the paper plots by country is not itself but its change relative to closing the border, or as the speaker put it, “not the rebalancing increase per se, but rather the impact of migration” (00:34:21):
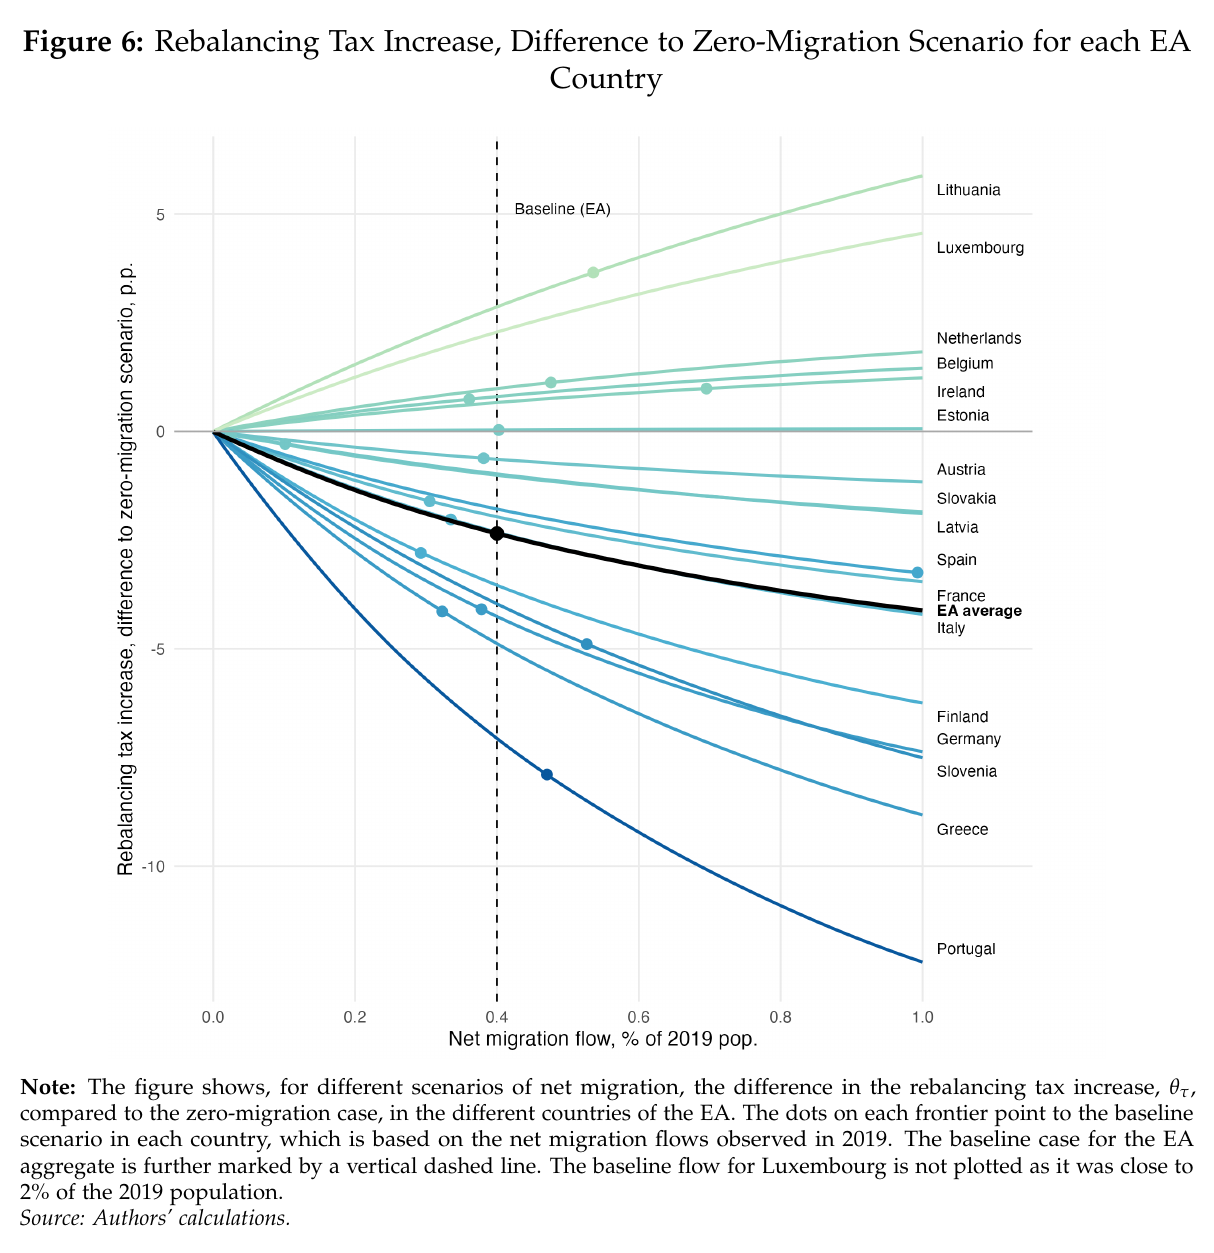
Immigration lowers the bill in Germany, France, Italy and Spain, which drive the aggregate, and in most other members. Portugal is the outlier on the good side, the only country in the data where immigrants are estimated to out-contribute natives. On the other side, it raises the bill in Belgium, the Netherlands and Ireland, where immigrants contribute so little even in their working years that their lifetime contribution from entry falls below a native newborn’s, so the demographic mechanism simply does not apply. The paper also lists Lithuania and Estonia, where arrivals are mostly older than 30 and so miss some of their positive years (pp. 32–33). Lithuania is indeed the top line. Estonia, on the paper’s own figure, is flat at roughly zero, so “harmful” is the right sign but not much of an effect. Luxembourg, the second-highest line, is not discussed in the text. The curvature is the model’s own prediction, and the paper uses it: Spain, with high inflows, sits on the flat part of its frontier and “could even allow them to retreat with little impact,” while Finland, Greece and Germany sit on the steep part (p. 33). Teles Morais drew the political conclusion in his close: a common European migration policy is hard to agree on when “the benefits for the public purse are very different for different countries” (00:36:57).
What the room pushed on
There was no discussant, so the Q&A carried the critique. Larry came back with a comment rather than a question (00:37:24): his recent work with the Bank of Italy puts the us fiscal gap at about 7.5% of gdp forever and Italy’s at about 4%; make Italy the 51st state and the merged gap lands in between, lower for the us. Admitting a group of people “where on average they’re doing better” lowers everyone else’s adjustment, which he called “very clever and important and even brilliant.” That is the slide-9 inequality with a country in place of a cohort. Teles Morais replied that the paper counts only explicit debt plus the implicit liabilities implied by observed profiles, no guarantees (00:39:04), and pulled up the decomposition slide he had skipped. For the euro area, the appendix splits the 14.0% into 5.1 points from initial debt and 11.2 from aging, less 2.3 from migration (p. 59); in Portugal, he said, migration more than offsets the aging part, and stays positive only because of legacy debt (00:41:03).
Adrian, presumably Adrien Auclert, returned to the fixed entry age (00:41:36) and argued the result should survive an older inflow, since what matters is that the present value at entry beats a newborn’s; he suggested using forecast migrant age distributions. Noted, not done. A questioner the chair calls Jim asked whether the age-30 figure averages over all immigrants and how sensitive it is to skill (00:42:42). “It is very sensitive,” Teles Morais said: by education the high-skilled turn net positive, though less than you would think, because in Europe their higher taxes are partly returned as higher pensions (App. D.4, p. 56). A questioner called Rainer asked about refugees versus labour migrants and for policy advice (00:44:19); the data cannot tell them apart (00:45:10).
The last and best question was Ron’s (00:45:31). The us National Academy reports of the mid-1990s (Smith and Edmonston 1997) and around 2016–17 (Panel on the Economic and Fiscal Consequences of Immigration et al. 2017) found a small positive average effect, with low-skilled immigrants negative and dominated by the medium- and high-skilled; but the us then had near-replacement fertility and a milder pension problem. The answer was admirably direct: “this paper only makes sense because of this change in our understanding of low fertility,” and the seminal Storesletten (2000) analysis (the captions render the name unrecognisably) assumed replacement fertility, under which “none of this kind of holds” (00:47:02). He conceded that the demographic channel and the skill channel should be separated more cleanly (00:47:55).
That concession is the right place to end, because it tells you what kind of result this is. It is not a claim that Europe’s immigrants are good for the budget; on their own they are not. It is a claim that they are less bad than the alternative way a low-fertility welfare state acquires new members, and the alternative is its own children. The paper is titled after walls, but the comparison that does the work is with a maternity ward. The bar an immigrant has to clear is set by how much a native newborn costs under current tax-benefit rules, and in most of the euro area, it turns out, that bar is not very high.