Notes on:
The Global Transition: The Impact of Demographics and AI on Economic Power
NBER Working Paper 35618
18 September 2026
OLG · population aging · artificial intelligence · global imbalances
Talk · Paper · doi · PDF · Transcript
Made with AI: Haiku 4.5 (research), Opus 5 (reading, figures, diagram and writing), GPT 5.6-Sol (reading), Fable 5.1 (adjudication), Sonnet 5 (verification)
Part of Macroeconomic Effects of Population Aging, Fall 2026
Here is a clean way to find out how much demography matters. Build a 17-region overlapping-generations model of the world. Calibrate it to 2017 macro and fiscal targets using the un’s 2017 population projections. Then calibrate it again to exactly the same targets using the un’s 2024 projections, and hold everything else fixed, including each region’s tfp catch-up path. Whatever differs between the two runs is, as Victor Ye put it, something “we know for sure … exclusively comes from the difference in demographics and nothing else” (03:43:16). The un changed its mind a lot in seven years, which makes this more than a robustness check. It is close to a natural experiment in how much a shift in the consensus forecast should move a global projection.
That is the first half of nber Working Paper 35618 (August 2026) by Seth Benzell, Laurence Kotlikoff and Ye, which Ye presented at the nber workshop on the macroeconomic effects of population aging on 18 September 2026. The second half adds automation in Zeira’s (1998) sense. Each region can switch to a more capital-intensive technology whenever that is profitable. It turns out the switch is profitable in very different places at very different times, and the reason is one global pool of capital that everyone draws from.
What the un did to China
China’s projected 2100 population went from “a little bit over a billion people to a little bit over 600 million,” a cut of about 40% (03:53:00). The us projection went up, and Ye was careful to say why: “the reason for this is not fertility.” The 2024 vintage assumes much more net immigration, and that assumption becomes the paper’s biggest sensitivity. World population in 2100 falls by “about 7%, about 700 million” (03:52:28). A small housekeeping note: the introduction says the 2024 projection is “8.9% lower” (p. 4), but the paper’s own population table (Table 5, p. 20) implies 6.5%, which matches the talk. The 8.9% looks like a slip.
Put those populations into the model and the ranking of the two largest economies reverses.
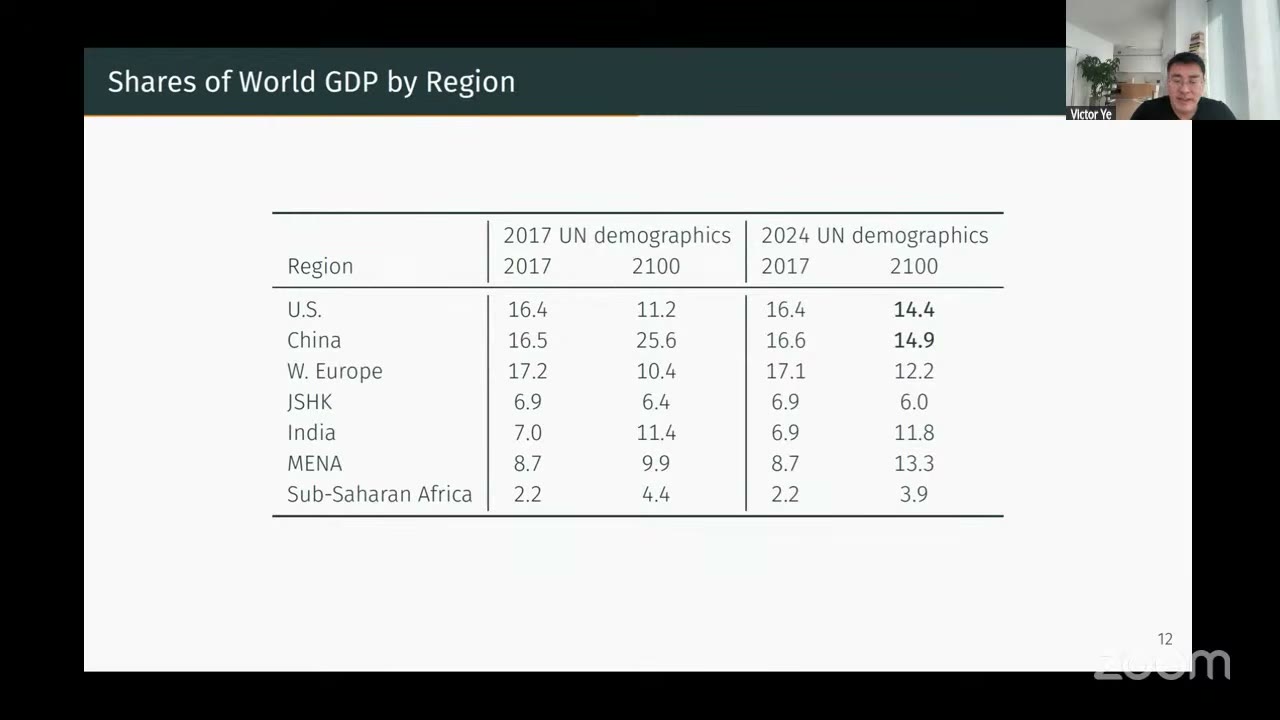
Under the 2017 vintage, China ends the century with 25.6% of world gdp to the us’s 11.2%. Under the 2024 vintage it is 14.9% to 14.4%. In levels, China’s 2100 gdp falls from $218 trillion to $115 trillion (2017 dollars), world gdp falls 10%, and us gdp rises 16% (p. 4). Ye then told the room what drives this: “output per worker is effectively unchanged by the changing demographic projections,” so the shift in shares is “coming almost entirely from number of people” (03:54:29). gdp per worker grows about 2.1% a year worldwide under either vintage (p. 4, fn. 5).
That drew the obvious clarifying question from the room. The questioner’s Zoom tile read Adrien Auclert, one of the organisers. Isn’t this “just basically plugging in the difference in the population sizes”? Ye said yes, “the vast majority of this effect” (03:55:08). The general-equilibrium remainder is capital competition. Sub-Saharan Africa’s 2100 gdp falls 20% between vintages (p. 5), more than its own population revision explains, because aging rich regions “demand more capital and that’s being sucked away from the countries that have a ton of people.” The follow-up was sharper. With one world interest rate, shouldn’t capital–labor ratios be pinned down? “So then how can capital intensity change as interest rates decline?” Ye answered that the regions have “the option of the two technologies” (03:56:50). The questioner took the point: that is “most of the remaining, the non-demographic part of these results.” That exchange is the paper’s structure in two sentences. Demography does the headcount, and everything interesting beyond headcount goes through the technology switch.
The model: seventeen regions, one pool of capital
The model is the Benzell–Kotlikoff large-scale olg machine, and the paper says the description “draws heavily and often verbatim” from Benzell et al. (2021) (p. 7). Each of 17 regions has 101 cohorts in three skill groups. Households have perfect foresight, supply labor endogenously, leave only unintended bequests, and pay taxes to a regional government that runs a pay-go pension. There is one world good. Capital moves freely and earns one after-tax return everywhere, while labor stays put. That still does not give factor-price equalization, because four factors and one good leave the wages free (p. 6, fn. 7). The fiscal closure is chosen to isolate demography. Non-pension spending is indexed to gni, and income and consumption taxes move together to hold each region’s debt-to-gdp ratio fixed. Pension benefits per retiree are indexed to per-capita gni, so aging raises pension budgets only through the number of retirees, and a separate payroll tax adjusts to pay for them (pp. 11–15).
Regional output is Cobb–Douglas in capital and three kinds of labor (eq. 7 in the paper):
Here is regional tfp, a capital-productivity term, productivity-adjusted labor of skill from low to high, and the legacy shares split labor’s equally, .
Automation enters as a second set of exponents. Every year each region compares its 2017 “legacy” technology with a frontier technology that has a higher capital share and tilts labor’s share toward high-skill workers. It adopts if and only if the frontier produces more at the equilibrium inputs it would face (eq. 23 in the paper):
Hats are the capital and labor the region would use under the frontier. tfp and factor productivities are the same in both technologies, and the choice can be reversed in any year. The frontier’s pace is the experiment. In business as usual it drifts to 2050 at the us 1980–2017 pace, taking the us capital share from 0.338 to about 0.37. “Accelerating ai” moves about four times as fast, to 0.44, and Transformative ai (tai) about ten times as fast, to 0.6 (pp. 28–29). Ye’s shorthand was that the tai frontier’s capital share “increases to 60%” by 2050 (03:51:40), with the extra share taken from all three labor types.
Nobody is modelling what ai actually does here. That is a feature. The whole of ai in this model is a set of Cobb–Douglas exponents, and the only thing that matters about them is which factor they economise on. They economise on labor. So the frontier is worth most where labor is most expensive per efficiency unit and capital is cheapest. That describes the us: it has the highest tfp, the biggest pool of high-skill labor, which immigration keeps topping up, and low effective corporate taxes (p. 30). It adopts in 2018 in every scenario.
Why the more powerful ai arrives later in China
Now go through the adoption decision as China. Your labor is cheap because your tfp is 0.37 of the us level (p. 17). You would like a technology that uses a lot of capital, but capital is priced in one world market. The moment the us switches to a frontier with a 60% capital share, its demand for capital jumps and bids up the world return. Your own savers would sooner lend to Americans than invest at home. Your in eq. 23 is set by a world return that just went up because of someone else’s choice, so your goes down. You wait. You adopt only once tfp catch-up has pushed your wages high enough that saving labor pays.
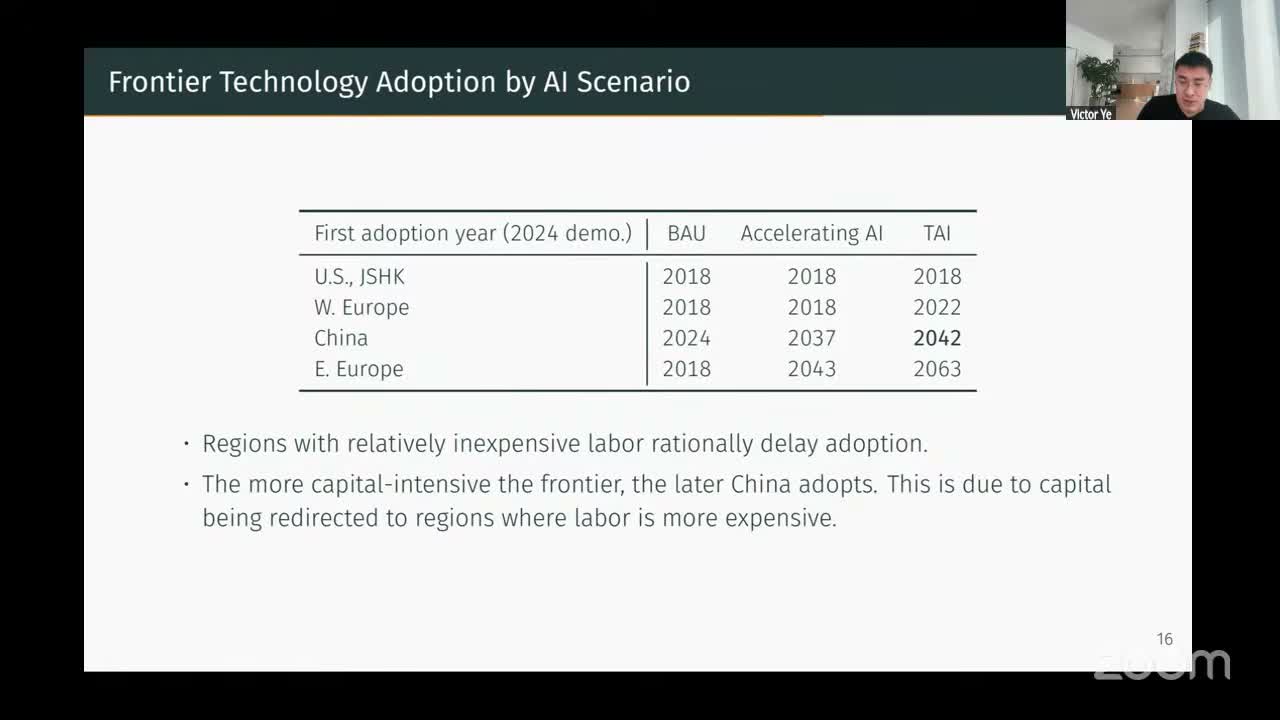
So China adopts the business-as-usual frontier in 2024, the accelerating one in 2037, and the transformative one in 2042 (Table 18, p. 30). The ordering is the paper’s most surprising result: the more transformative the technology, the later the large low-wage economy takes it up. This is not a story about diffusion lags or state capacity. Delaying is individually optimal once the prices that tai itself has moved are taken into account. Russia slips from 2018 to 2034 and Western Europe from 2018 to 2022 for the same reason (p. 30). India, Brazil, South Africa, mena, the rest of Latin America and Sub-Saharan Africa never adopt at all (Table 18, p. 30).
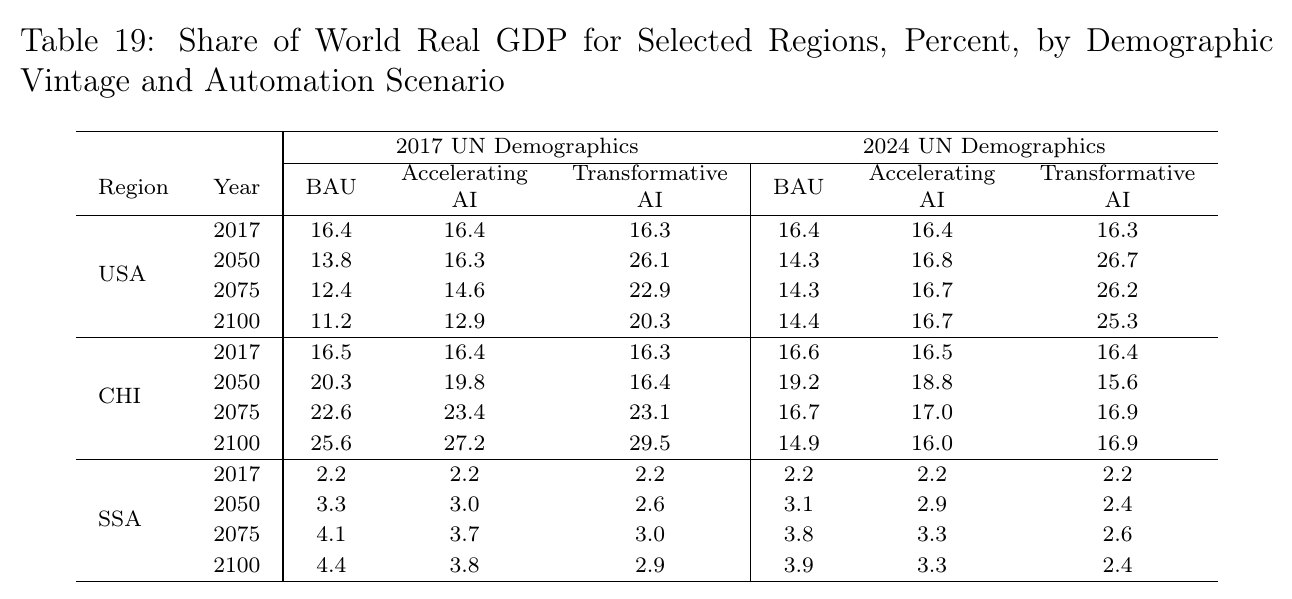
Under 2024 demographics, tai raises the us share of world gdp from 14.3% to 26.7% in 2050 and from 14.4% to 25.3% in 2100. The paper notes the us last held a share that large around 1950, 27.3% on Bolt and van Zanden’s (2025) numbers (p. 31). Ye made the same comparison at 04:01:37. China’s share moves the other way first: it falls from 19.2% to 15.6% in 2050, because it is waiting, and ends at 16.9% in 2100, above its 14.9% under business as usual. Treat the headline numbers with some care, though, because the conclusion states them wrongly. It says “the U.S. 2100 share of world gdp doubles to 26.7%” (p. 39). But 26.7% is the 2050 figure, and Table 19 gives 25.3% for 2100.
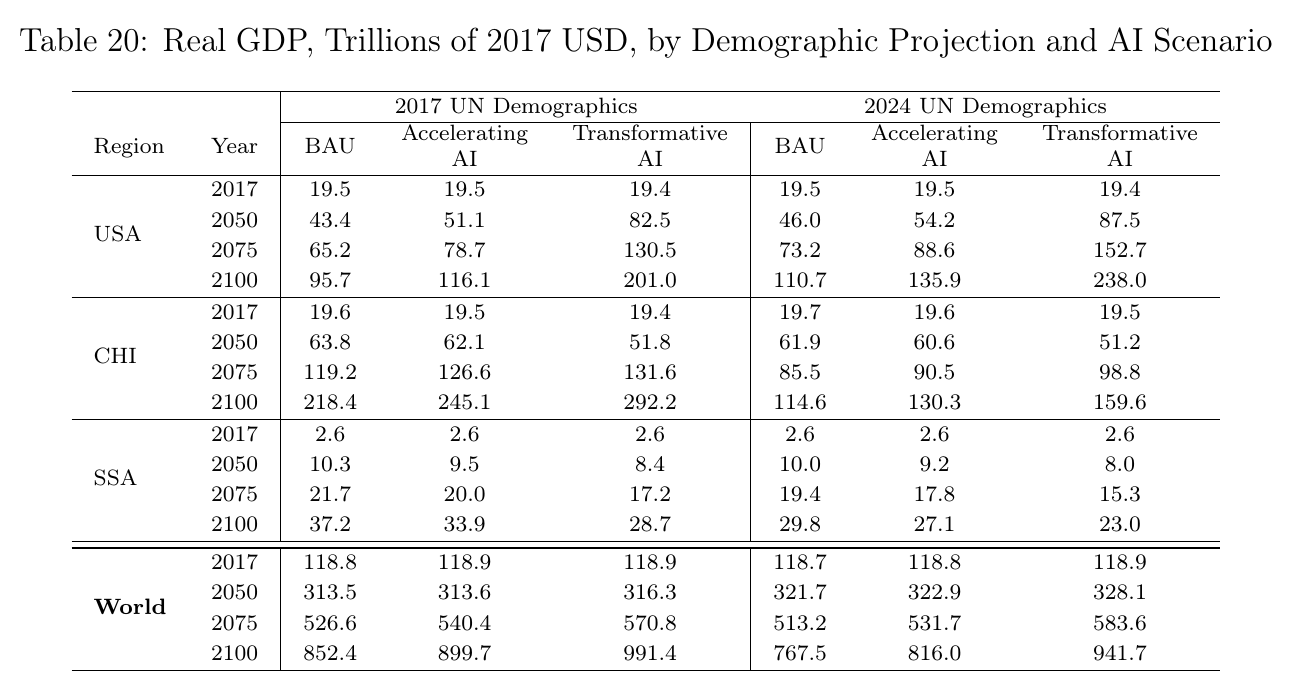
Levels show whether tai is a transfer or an addition. In 2050 it is mostly a transfer. us gdp is 90% above its business-as-usual path, but world gdp is only 2.0% higher ($328.1 trillion against $321.7 trillion under 2024 demographics, and 0.9% higher under 2017’s). The paper calls tai “nearly zero-sum on a global gdp basis through mid-century” (p. 32). By 2100 accumulation has caught up. World output is 22.7% above business as usual, and the 2024-vintage tai world out-produces the 2017-vintage baseline world, $941.7 trillion against $852.4 trillion (p. 32). “A sufficiently advanced frontier technology more than repays demography’s global output loss,” the paper says, and adds: “it does not repay China’s portion of it” (p. 32).
The talk said something different about 2050. Ye: “by 2050 global gdp is lower under the tai scenario and this is just because all the capital is being sucked up to developed countries” (04:07:30). According to Table 20 that is not true of world gdp, which is 2.0% higher. It is true of the non-adopters. China’s 2050 gdp is $51.2 trillion under tai against $61.9 trillion under business as usual, and Sub-Saharan Africa’s is $8.0 trillion against $10.0 trillion. That is probably what he meant, but the paper’s number is the one to use. The slide’s “roughly one quarter above” for world output in 2100 is a rounding of 22.7%.
The glut, and what reverses it
Without the ai scenarios, the model tells a standard life-cycle story. Aging raises the number of asset-holding retirees per worker, China keeps saving, and the world return on mobile capital falls from 5.9% in 2017 to 1.9% in 2100 under the 2017 vintage and 1.6% under the 2024 one (p. 5). tai undoes all of it.
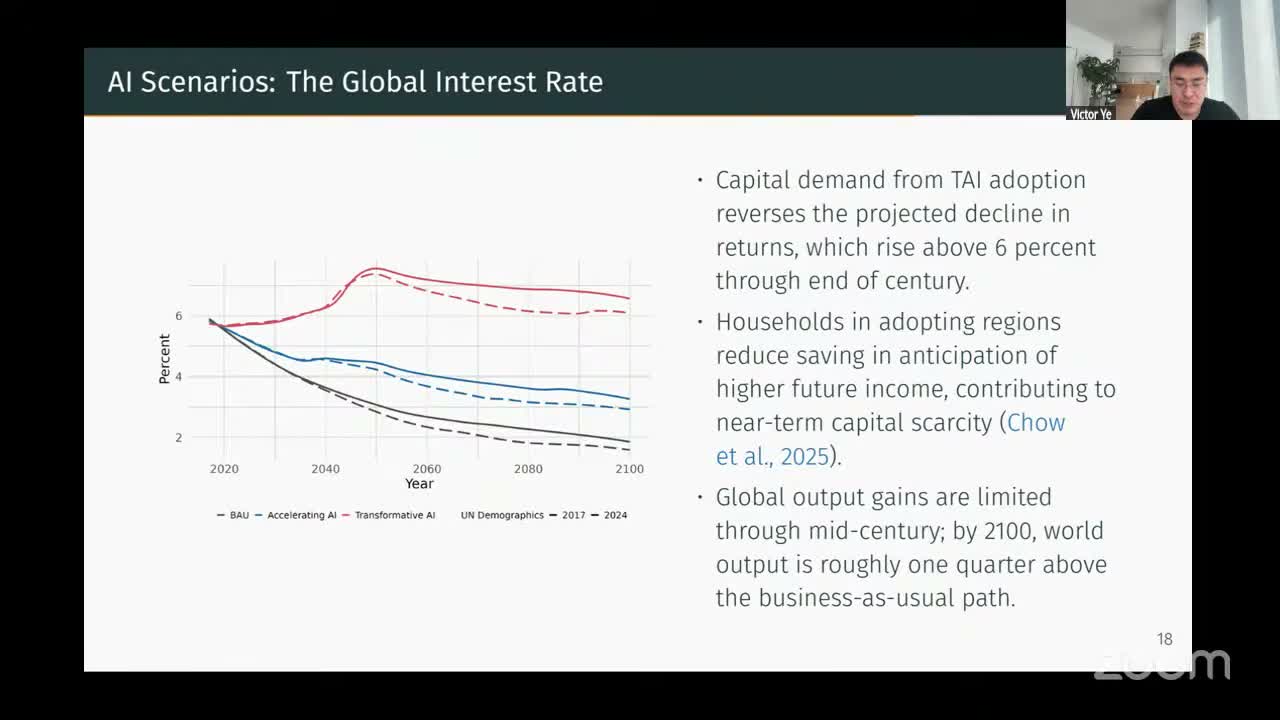
Under tai and 2024 demographics the world rate is 7.4% in 2050 and about 6% in 2100 (p. 31; the paper also gives 6.1% on p. 5, which is just rounding). Part of the increase comes from households. With perfect foresight, households in adopting regions see higher future incomes coming, save less now, and make near-term capital scarcer. The paper connects this to Chow, Halperin and Mazlish (2025), who argue that if markets really expected transformative ai, long real rates would already show it (pp. 31–32). That is a sharp test to hand your own scenario: if tai of this size were what people expected, the evidence would already be sitting in long real rates.
Pensions come out badly under every scenario. With benefits per retiree tied to per-capita gni, the world payroll tax rate roughly doubles, from 13.1% of covered earnings to 24.1% in 2100 under the 2017 vintage and 25.4% under 2024. China’s goes to 38.1% instead of 28.1%. The us rate barely moves (27.7% to 28.2%), because the new vintage also brings in more immigrants (p. 5). tai makes the general budget look better: the us effective tax burden on total income in 2100 falls from 47.0% to 25.9%. But it shrinks the wage base, so the us payroll rate rises from 28.2% to 37.5% (pp. 32–33). Western Europe and pre-adoption China would face combined labor tax rates “near or beyond 100%” if benefits were not cut to cap payroll rates at 45% (p. 33; 04:08:33). The paper concludes that “wage-based social insurance and Transformative ai are structurally incompatible” (p. 33). That is correct inside the model and almost true by definition: if you tax the factor whose share you have just assumed away, the tax rate has to rise.
The immigration assumption
The sensitivity runs show how much of the us result depends on immigration. Put the us alone on the un’s zero-migration variant from 2025, and its 2100 population is 268 million instead of about 420 million. us gdp in 2100 is 39.4% lower, and its world share falls from 14.4% to 9.2%, against China’s 15.9% (p. 34). Ye rounded this to “around 30 to 40% of us gdp in 2100 … attributable to net immigration inflows” (04:10:23). The paper describes its “American economic hegemony” (p. 31) as an outcome of demography. It is at least as much an outcome of immigration policy. The un low-fertility variant, for comparison, cuts 2100 world gdp by 32.3% (p. 35). Ye noted that it helps the us in relative terms, for the same reason.
What the room pushed on
There was no discussant. The sharpest pushback came from the questioner under the Auclert label, and it concerned the fiscal closure. Early in the talk he asked how debt-to-gdp stays constant. The answer was that taxes adjust, and that payroll taxes adjust separately, so “you’re not running down the trust.” Ye: “Nope” (03:48:36). He came back to it after a chat comment from Ron Lee (per the chat and his later Zoom label) that 40% payroll taxes were hard to believe (04:03:27). Governments are running deficits, and “cbo does not project a fiscal consolidation.” If they keep issuing debt, “even in your model that reverses” the falling-rate prediction. And high payroll taxes with fixed benefits reduce working-life saving, so the closure is not neutral. Cutting spending would be (04:04:09). Ye said “that’s 100% fair” (04:04:46). He put the difference between these results and “what you have in your paper” down to high Chinese saving and the conservative debt rule, and pointed to an appendix scenario that holds pension commitments nearer official projections and raises gdp (by about 3%, App. A3, p. 55). The exchange had an extra edge. The paper’s literature review singles out Auclert et al. (2025), which finds the return to capital rising by 2100, and says its asset demand and supply “neither seems well defined” (p. 7). If the questioner was who his label says, the author of the paper being criticised got to point out that part of the gap between the two papers’ interest-rate predictions comes from this paper’s own fiscal closure, and Ye agreed.
Someone then asked about the Laffer curve at labor tax rates near 100% (04:11:57). Ye said labor supply is endogenous but rigid, and an author’s voice, presumably Kotlikoff’s, added that “the income effects overcome the substitution effects” (04:12:43). So there is no revenue peak, and the high rates “don’t collapse the system.” Kotlikoff also noted that in the best case for the us, much of its capital is owned by foreigners, since the model is calibrated to us saving behavior, “which is terrible” (04:14:04). The paper agrees: by 2100 over half of us capital is foreign-owned, and China’s share of world national income, 15.6%, exceeds the us’s 13.6% (pp. 21–23).
Lee closed by calling the exercise “an analytic projection” rather than a forecast (04:15:17). He doubted that a demographic outlook that changed so much in seven years should then be treated as fixed, and said he expects fertility to rise again. Kotlikoff answered that you “just keep running the model,” and added: “I hope you’re right on that one, Ron” (04:16:17). Asked why he expected a rebound, Lee listed pension reform, public spending on children crowded out by aging, and the conditions young families face. Asked whether he could point to evidence, he said “Not really,” apart from surveys of desired family size (04:17:58).
That is the right way to read the paper. It is a well-built machine for turning a forecast revision into gdp shares, and the revision it happened to receive moved China’s 2100 share from about twice America’s to parity. The ai half adds a second machine. It takes whoever has the most expensive labor, hands them the world’s capital at the moment the frontier jumps, and makes everyone else wait for their wages to catch up. Under the most optimistic scenario, then, us hegemony in 2100 consists of a quarter of world output, produced with capital that is more than half foreign-owned, with 30 to 40 percent of it owed to immigrants the un happens to be projecting.