Notes on:
How Does AI Accelerate Drug Development: A Global Perspective
Working paper
23 September 2026
AI · drug development · innovation · China
Talk · Paper · Slides · PDF · Transcript
Made with AI: Opus 5.5 (reading and writing), GPT 6-Sol (reading), Fable 5.1 (adjudication), GPT 6-Astra (verification)
Part of Economics of Artificial Intelligence, Fall 2026
Panle Jia Barwick, Hongyuan Xia, Tianli Xia and Jing Yi. Presented by Barwick on 23 September 2026 at the nber Economics of Artificial Intelligence conference (Fall 2026, Toronto), day 1, first paper. Discussant: Benjamin Jones. Sources: the June 2026 conference draft (“How Does ai Accelerate Drug Development: A Global Perspective”), the September 2026 conference slide deck, and the talk.
The first thing to know about this paper is that there are two of it. The June 2026 draft is a research design with no results: data sources, a measurement strategy, five equations and a welfare plan, but no tables and no figures (draft pp. 4–10). Every number in this piece comes from the September 2026 deck or from Barwick’s talk, and the deck runs a different study. The draft wanted a disease × country × year panel, with ai exposure measured as the share of PubMed papers in a cell that use ai, a China interaction and shift-share instruments (draft pp. 7–9). The deck estimates firm-year and drug-project regressions, with ai exposure measured as the number of a firm’s employees whose LinkedIn profiles list ai skills, and it says “iv in progress” (slide 7). (Slide numbers here count every page of the September 2026 deck, title and section dividers included, so they run a few ahead of the numbers printed in the corner.)
This switch is a little funny, because the June draft spends a paragraph explaining why you should not measure ai adoption this way: skill-based measures “are less informative about the use of ai in upstream biomedical science” and “are also difficult to map to specific disease areas” (draft p. 5). Three months later the headcount is the main regressor. That isn’t a scandal; it’s what happens when you build the ambitious measure (a PubMed classifier with 654 ai classes and context guards so that “dl-methionine” doesn’t count as deep learning, slide 32) and find the quick one already gives you a clean event study. But the draft’s objection is still a good one, and nobody in the room raised it.
The pipeline, and the three things ai is supposed to do
Drug development is a funnel: target, molecule, animal testing (preclinical), then Phase I, II and III in humans, then maybe approval. The deck prices the trip at 10–15 years and $1–2.6 billion per approved drug, with 9 in 10 clinical candidates failing (slide 2). Industry says ai helps on three margins: you can start more projects (quantity), move each one through faster (speed), and get more of them through each gate (success) (slide 5; talk 00:20:57). There are also sceptics. The deck quotes Novartis’s ceo expecting no effect on the firm’s 5–10-year forecasts, and a medicinal chemist noting that target selection and human toxicity, “the two things that kill most programs,” are not yet within ai’s reach (slide 6).
The approach, which Jones liked, ignores the zoo of individual tools and treats “ai” as an input: count a firm’s ai people, count what comes out of its pipeline, and see whether the relationship changed around 2018, when most modern tools arrived. The sample is China, the us and Europe, 2010–2025, built on Citeline’s record of every drug project and trial, linked to Revelio Labs résumés for 3.9 million workers (slide 11). The link matches 45.4% of sponsors, and unmatched sponsors are dropped. The deck also notes that “LinkedIn coverage is thinner in China and ai job titles are noisier before 2015” (slide 33). Keep that in mind for the China result.
Quantity: the event study
The design is an event study with 2010–2017 as the “early ai” placebo period and 2018–2025 as “modern ai.” For quantity, the event-study specification on slide 18 is a Poisson regression of new drug projects on log ai headcount, with a separate coefficient for each year:
Here is a firm, a year, the year- semi-elasticity of new projects with respect to log ai headcount, controls for employee size, firm age and past drug experience, and and are firm and year fixed effects. The identification comes from the path. If good firms simply hire ai people and also launch lots of drugs, should be high throughout. If ai started doing something after 2018, should be flat and then rise. Barwick put it this way: “it’s not just pure correlation that good firms hire people ai people and do more trials because we don’t see that evidence prior to 2017” (00:33:17).
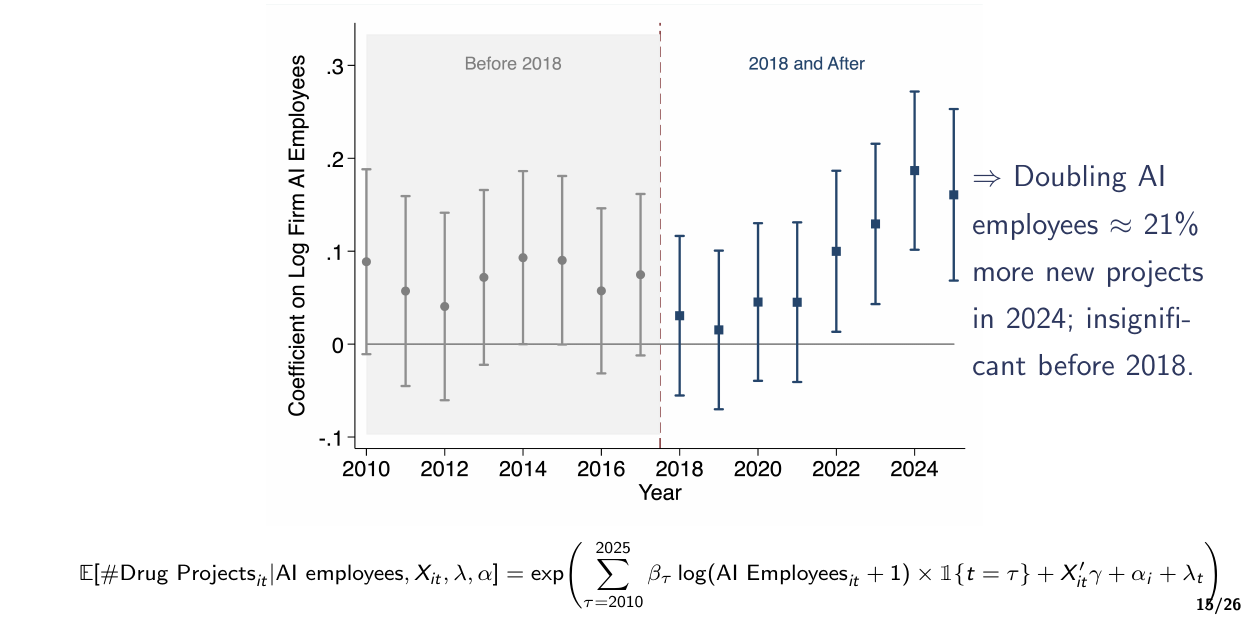
Look at the chart before accepting that. The post-period does climb, to roughly 0.19 in 2024 and 0.16 in 2025, significant from 2022 (slide 18). But the 2010–2017 points sit around 0.04–0.09 (intervals covering zero), above the 2018–2021 points at about 0.015–0.045. Noisy-positive, dip, rise is not a flat-then-kink. The generic-drug placebo on slide 19 has a similar problem. Firms that run innovative trials also run bioequivalence trials for generics, ai shouldn’t matter for those, and the coefficients are indeed insignificant. But their post-2018 point estimates (about 0.11–0.17) are about as large as the main effect, with intervals of roughly ±0.2. That’s an imprecise placebo, not a tight zero. Jones said the generics “look like a placebo” (00:49:06), which is fair as a description of the stars and generous as a description of the magnitudes.
The pooled post-2018 coefficient is 0.12 (slide 20), which the deck’s preview renders as “doubling ai employees → 12% more new drug projects” (slide 8) and which Barwick corrected live to “12% actually 13%” (00:23:54). Here is a small observation of ours, offered as a hedged reading and not as an accusation. With a regressor of and a Poisson link, doubling a large headcount raises the regressor by , so the implied change is . The deck’s percentages are instead , which is the effect of a one-log-unit increase (a factor of about 2.7). For that’s 12.7% against about 9%. For the slide-18 annotation, gives the stated “21% in 2024” against about 14% under a literal doubling. For China’s 0.36 it’s 43% against about 28%. The success numbers, oddly, do use (0.06 × 0.69 ≈ the “+4 pp” on slide 8). The authors may simply be using “doubling” loosely. The ratios between groups don’t change either way, but the headline quantity numbers are about a third too large if “doubling” means doubling.
Success, and the surprising part
The quantity result is the one you would expect: ai makes something cheaper, so firms do more of it. The success result is the one that should surprise you. The unit is now the individual drug project, the outcome is whether a preclinical candidate reaches Phase I, and the specification (slide 24) is a linear probability model on log firm ai headcount with firm × disease, disease × year and country × year fixed effects. Barwick called this “the most demanding specification” (00:37:44). In effect, it asks whether, within the same firm working on the same disease, candidates become more likely to clear preclinical as the firm accumulates ai people.
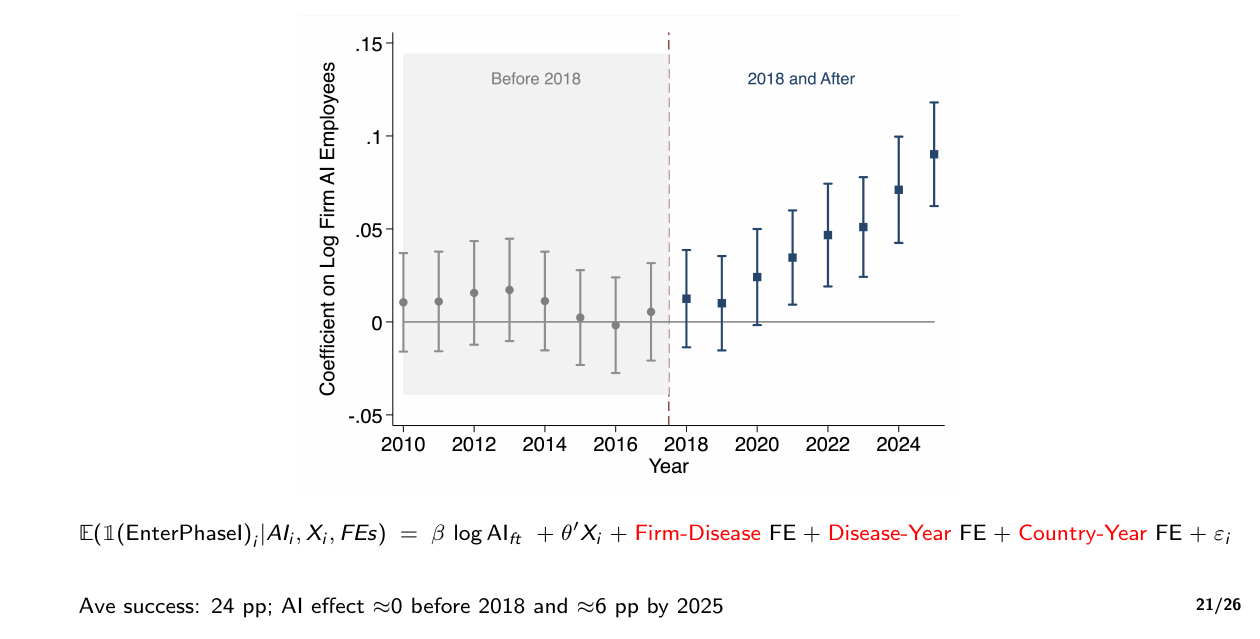
This is the cleanest picture in the deck. The pre-period really is flat, around zero to 0.02. After 2018 the coefficients rise every year to about 0.09 in 2025 and are clearly significant from 2021. Against a baseline success rate of 24 percentage points, the slide annotation says ai adds “≈6 pp by 2025” (slide 24), which Barwick called “about 24%, 25%” improvement (00:38:25). In the raw 2025 data, firms in the top decile of ai employees get 63% of candidates into Phase I, against 20% in the bottom decile (slide 23).
This is surprising because a technology that makes trying cheaper should make the average try worse: the marginal candidate a firm now bothers to pursue is one it would previously have rejected. Here the funnel widens and the hit rate rises at the same time. Barwick used exactly this in the Q&A: “the fact that ai projects have a higher success rate indicate that’s unlikely” that the extra projects are marginal, low-quality ones (01:08:49). Jones’s version was shorter: “It’s like ai is guessing well” (00:53:43).
The deck then adds up the two margins. You set every firm’s ai headcount to zero, compute fitted projects and fitted success rates with and without ai for 2018–2025, and take the difference in expected Phase I entries (slide 28):
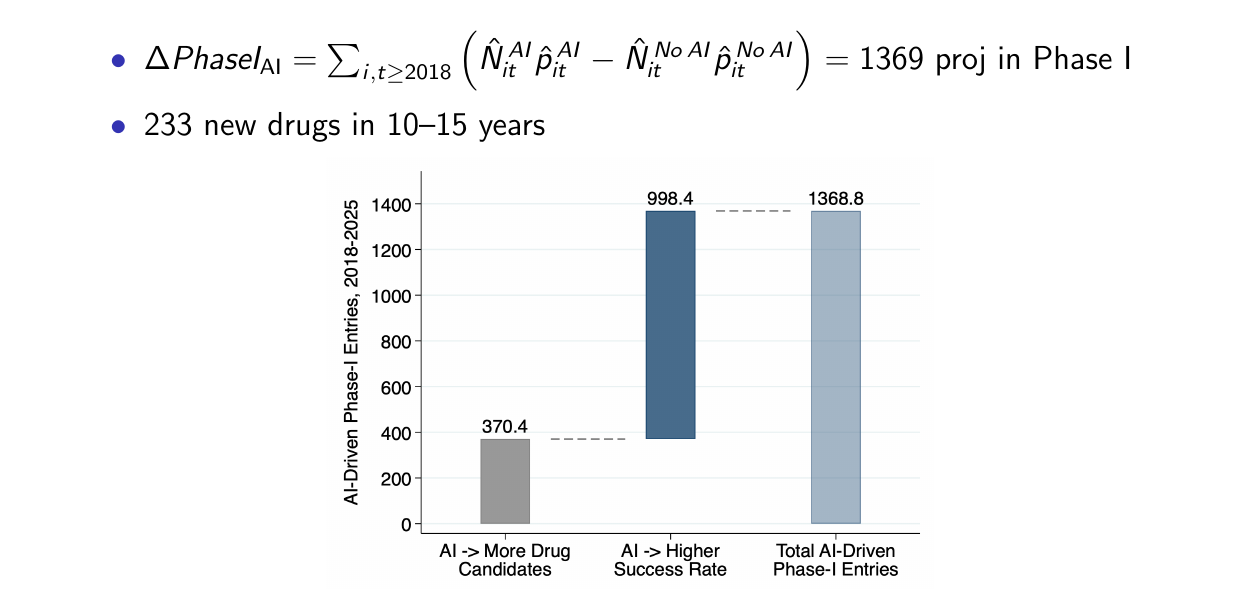
The answer is 1,369 extra Phase I entries: 370 from more candidates and 998 from better odds, a 27/73 split (slides 28–29). If Phase I→approval rates stay where they were, that’s “233 new drugs in 10–15 years” (slide 28), an implied conversion rate of about 17% by our arithmetic. Barwick called the three-quarters share “a very important finding” (00:25:26), and the structure of the result supports that. Most of the ai dividend, on these numbers, comes from a better filter, not from more shots.
Two points on how much weight the 1,369 can bear. First, by our sum of the chart labels on slide 13, the three regions put about 6,500 projects into Phase I over 2018–2025, so 1,369 is roughly a fifth of all of them. That’s a lot to attribute to a regressor Jones calls descriptive. (If the counterfactual sums only over the Revelio-matched firms, which the deck doesn’t say, the within-sample share would be larger still.) Second, “set ai employees to zero” is fine for the many small firms whose histograms pile up at zero (slides 17, 23). For a big pharma company with log ai headcount near 8, whose within-firm history never gets close to zero, it’s an extrapolation that relies on the log-linear form holding all the way down.
What didn’t happen
The nulls are as informative as the effects. Firms with more ai people start projects in more disease areas (about 0.15 on disease and area counts), and in more modalities (0.14), but not on more targets (0.05, insignificant) (slide 21). The deck summarises this as “ai encourages exploration of new diseases with existing targets,” which reads a bit like a contradiction in terms and is worth reading twice. The effect is also concentrated where knowledge already exists. By percentile of a disease’s stock of ai papers, the quantity coefficient goes from −0.05 (insignificant) at the bottom to 0.32 at the top, and it is larger where the firm has launched drugs in that disease before (slide 22). The same holds for success: the interactions with disease ai papers, Open Targets evidence and the firm’s own prior launches are all positive and significant (slide 26). There is no detectable rise in first-in-class trials, though there is one in first-combination-in-class trials (slides 27, 39).
Speed is the “no consistent speed-up” case. The deck’s summary says “No detectable speed-up” (slide 40), and in the preclinical-to-Phase I panel that is true for every year but one: 2023 has a coefficient near −0.30 with its whole interval below zero. One year out of eight isn’t a speed effect, but the plot isn’t flat either. Later stages show “No significant effects” (slide 27), and Barwick noted that the Phase II and III data “would be a lot thinner since it takes years” (00:39:53). All of these are non-rejections in a correlational design, not established zeros.
So ai helps firms do more, and do it better, where the biology is already mapped. Barwick drew this conclusion in the talk: ai hasn’t helped firms “venture into new targets” because “there’s just not a lot of biological evidence in new targets” (00:42:04–00:42:15).
China
The draft was organised around whether ai lets a latecomer catch up, and the deck has one striking number on it. The quantity coefficient for Chinese firms is 0.36, against 0.09 for the non-China firms (in this sample, the us and Europe), which the deck labels “ai benefits four times larger for Chinese firms (43% vs. 9%)” (slide 20). On success, China’s coefficient is 0.06, the same as everyone else’s, with a wide interval (slide 25). Barwick: “we don’t find that China has any edge” (00:38:57). So China’s ai advantage, whatever it is, shows up in how many projects firms launch, not in any additional improvement in how many get through.
I would hold the 0.36 loosely. Barwick also offered China’s 2017 ai industrial policy and cheaper trials as explanations (00:34:40–00:34:53); the companion paper (Barwick, Xia and Xia, nber wp 34977) attributes China’s trial boom to the 2016 reimbursement reform, which happens to coincide with the 2018 “modern ai” break. The quantity regression has only firm and year fixed effects (slide 18; talk 00:31:27), not country × year, and LinkedIn coverage of Chinese firms is thinner (slide 33). A Chinese firm that scaled up everything after 2016, including its ai hiring, would look much like a Chinese firm for which ai works four times as well.
Jones: descriptive, and exploitation rather than exploration
Jones’s discussion was generous and made two points. The first was about identification: firms that hire ai people “are making a choice,” and the obvious concern is “common joint ai opportunity shocks at the firm level” or simply better managers. The planned shift-share iv “would be a reasonable thing to do,” but “right now I think of it more as a descriptive result” (00:49:27–00:50:05). I agree, and the imprecise quantity pre-period above is the concrete reason.
The second point was the more interesting one, and it reframed the result. Jones describes research as a hallway with an infinite number of doors, where the creative task is choosing which door to open. Exploitation means trying doors near where you already are. Exploration means running down the hallway to somewhere nobody has been (00:52:16–00:52:50). The chemical space is too large to brute-force, so exploration needs some kind of world model. Physics has good ones. Biology, “a really choppy landscape,” mostly doesn’t (00:54:33–00:55:42). Then Jones applied this to the paper: “we’re seeing a much higher quantity, but also a much higher progression rate. It’s like ai is guessing well. That’s also consistent with very narrow exploitation of where you already are … existing targets and making small edits. Yeah, they’re likely to work, but they’re probably not major breakthroughs” (00:53:35–00:53:59). ai, Jones concluded, “is contained within the world models that we know and it can train on” (00:55:51).
This turns the paper’s two main facts, high success and no new targets, into one: the hit rate is better because the targets are already known to be hittable.
The Q&A
The questions mostly pushed further down the funnel. The chair, unnamed in the recording, noted that China has gone from roughly zero to “about a third” of Phase I (by our reading of slide 13, 44% of the three-region total in 2025), that at the margin Chinese ai employees are “no better, no worse,” and asked what this means for global and us welfare (00:56:39–00:58:09). A questioner the chair calls “Lee” worried that generative ai is “this like black hole” pulling venture money and talent away from biotech entry, which could offset the productivity gain (00:58:17–00:59:11). “Dan” asked whether the post-2016 rise reflects ai moving in-house and being combined with big pharma’s proprietary data, since early ai startups had complained that they got only the projects pharma couldn’t solve (00:59:16–01:00:06). The next speaker (the chair had queued “Dan, then Ajay”) asked what the Novartis ceo knows that the data doesn’t, and argued that the real bottleneck is Phase II/III patient recruitment (01:00:14–01:02:18). A venture investor cited a Phase II failure rate of about 70% and a pharma industry that will happily pay ai labs for tokens but refuses them a share of pipeline revenue because ai hasn’t “got enough contribution” (01:02:32–01:05:08). A questioner the chair appears to call Kevin suggested looking for “green shoots” at the remaining bottlenecks and noted that regulators and trial capacity can’t absorb “a thousand new candidates” (01:05:13–01:07:15).
Barwick had a minute. On timing, Barwick argued that more Phase I entries now means new drugs in 10–15 years, “consistent” with the ceo seeing nothing within the firm’s horizon (01:08:16–01:08:43), which is true and also means the forecast and the 233 drugs can’t yet contradict each other. On quality, they pointed to the higher success rate and the first-combination-in-class result, and conceded “on quality we can look more” (01:09:31). On China, Barwick said the effect is “better for everybody,” and attributed China’s rise to the 2016 policy change, subsidies and returning talent (01:09:31–01:10:18). The endogeneity point, the talent crowd-out and the in-house-data question were left unanswered.
Either the instrument will confirm that ai makes candidates on well-understood targets more likely to clear preclinical, and the 998 stands, or it will show that firms which were going to do well also hired ai people. Either way the deck has already found something the industry quotes on slide 5 left out: so far, ai is better at telling you which familiar door to open than at finding new ones. That’s a respectable first result for a general-purpose technology in science, if not the one the press releases were written for.