Notes on:
The Macroeconomic Impact of Microeconomic Shocks: Beyond Hulten's Theorem
Econometrica 87(4): 1155--1203
2019
geoeconomics · production networks · Hulten's theorem · elasticities of substitution · oil shocks
Paper · doi · PDF
Made with AI: Opus 5 (reading and writing)
David Rezza Baqaee (ucla) and Emmanuel Farhi (Harvard). Econometrica 87(4), July 2019, pp. 1155–1203, doi:10.3982/ECTA15202. The published version is the one read here — submitted March 2017, accepted 22 February 2019, handled by co-editor Giovanni L. Violante — and page numbers below are the journal’s. No talk recording was found; pdf-only digest. Figures 5, 6 and 7 and Table I are cropped from the published version, and equations (2) and (7) are shown in the paper’s own typesetting above the transcription.
A sales share is a derivative
Start with the thing Hulten proved in 1978, because everything on this list that says “strategic sector” is a quarrel with it. You have an economy with many producers buying from each other. A productivity shock hits one of them. How much does aggregate output move? The answer, to first order, is the shocked producer’s sales as a share of gdp — its Domar weight, — and nothing else:
(equation 1). Not its position in the network, not how substitutable its output is, not whether its customers can find another supplier. The proof is an envelope argument: in an efficient economy prices are the multipliers on the resource constraints, so the social value of one more percent of good is what people currently pay for good . The paper is candid about what this did to the field: “Hulten’s theorem has been something of a bugbear for the burgeoning literature on production networks,” because it appears to say that the object of that literature is irrelevant for aggregate output. If sales are a sufficient statistic and you can observe sales, why draw the graph?
Walmart and electricity generation each sell about 4 percent of us gdp. Hulten says a large negative shock to either is equally bad. Nobody believes this, and the paper’s job is to say precisely why nobody should.
The second derivative is the change in the Domar weight
The way out is not that Hulten is wrong; it is that Hulten is a first derivative. In options language the Domar weight is the delta of aggregate output with respect to a sector’s productivity, and a delta is only a good hedge for small moves. The paper computes the gamma. Theorem 2 gives it in reduced form:

(equation 2, p. 1163), where is the general-equilibrium elasticity of substitution between and — the curvature of the aggregate output function, not any one firm’s technology — and is the input-output multiplier, total sales over gdp, which is above one whenever there are intermediate goods. The middle equality is the whole insight. The second-order effect of a shock to is just how much ’s sales share moves when is shocked. If the share is constant, Hulten is exact everywhere; that is the Cobb-Douglas case, and fixed, and it is the case most of the literature had written down for tractability.
Away from Cobb-Douglas the share moves, and the direction is what produces the asymmetry. Suppose goods are complements in general equilibrium, . A negative shock to raises its price more than it lowers its quantity, so ’s share of sales rises, so the marginal damage of the next percent of shock is larger than the last. Negative shocks are amplified and positive ones damped. With substitutes the opposite: a bad shock shrinks the sector into irrelevance, a good one lets it take over. Pushed into the moments, symmetric thin-tailed sectoral shocks give log output a negative mean, negative skew and excess kurtosis. Rare disasters, on this account, need neither fat-tailed shocks nor fat-tailed Domar weights; the nonlinearity makes them out of Gaussian material.
What sets the elasticity: technology, the network, and whether labor can move
The reduced-form is not something you can estimate from a firm-level regression, and the paper says so in almost those words: “the leap from micro-estimates to macro-effects can be hazardous.” So Sections 3 and 4 build the map from micro primitives to it, and the map has three inputs.
The first is the micro elasticity itself; the second is factor reallocation, and it matters as much. In a horizontal economy with no intermediates, if labor cannot move across producers the ge elasticity equals the consumption elasticity, , and a Leontief consumer makes the second-order term explode. If labor can move freely, , which never falls below one half: “a near-Leontief production function is not sufficient for generating large deviations from Hulten’s theorem, as long as factors can be reallocated freely, precisely because this reallocation is successful at reinforcing ‘weak links’.” The same technology gives a catastrophe or a shrug depending on whether workers can walk to the sector that just got hit. Since a static model cannot do time, the authors proxy the horizon with this dial: no reallocation is the short run, full reallocation the long run.
The third input is the network, and Proposition 7 says exactly how it enters. For any nested-ces economy with one factor,

(equation 7, p. 1174), where is producer ’s own elasticity of substitution across its inputs, its Domar weight, the Leontief inverse whose th column records every producer’s direct and indirect reliance on , and the variance is taken across ’s inputs using ’s expenditure shares as the weights. Read it as a centrality measure. A shock to moves prices in proportion to exposure to ; each producer then reshuffles its spending across inputs whose prices moved; the reshuffling changes ’s share only if is large, if ’s elasticity is far from one, and if ’s inputs are unevenly exposed to . A universal input — energy is the paper’s running example — has zero variance from the household’s point of view, so the consumption elasticity drops out and only the production elasticity matters. And if every elasticity in the economy is the same number, the network drops out altogether (Corollary 1): at second order it matters only through heterogeneity in who can substitute and who is exposed. The paper’s summary of its dispute with Gabaix’s (2011) “networks are a particular case of granularity” is the cleanest sentence in it: “It is simply that the sales distribution is a sufficient statistic for the network at the first order but not at higher orders.”
Anyway, the numbers
The calibration uses the 88-sector us klems input-output data, 1960–2005, with three elasticities: across consumption goods, between value added and intermediates, and across intermediate inputs, all taken from Atalay (2017) and neighbours. The discipline is that the model has to reproduce the observed volatility of Domar weights, which is after all what the second-order term is: about 0.13 at an annual and 0.27 at a quadrennial horizon. The no-reallocation benchmark hits both; the full-reallocation model falls well short with the benchmark elasticities; the near-Cobb-Douglas model produces essentially no Domar-weight volatility at all.
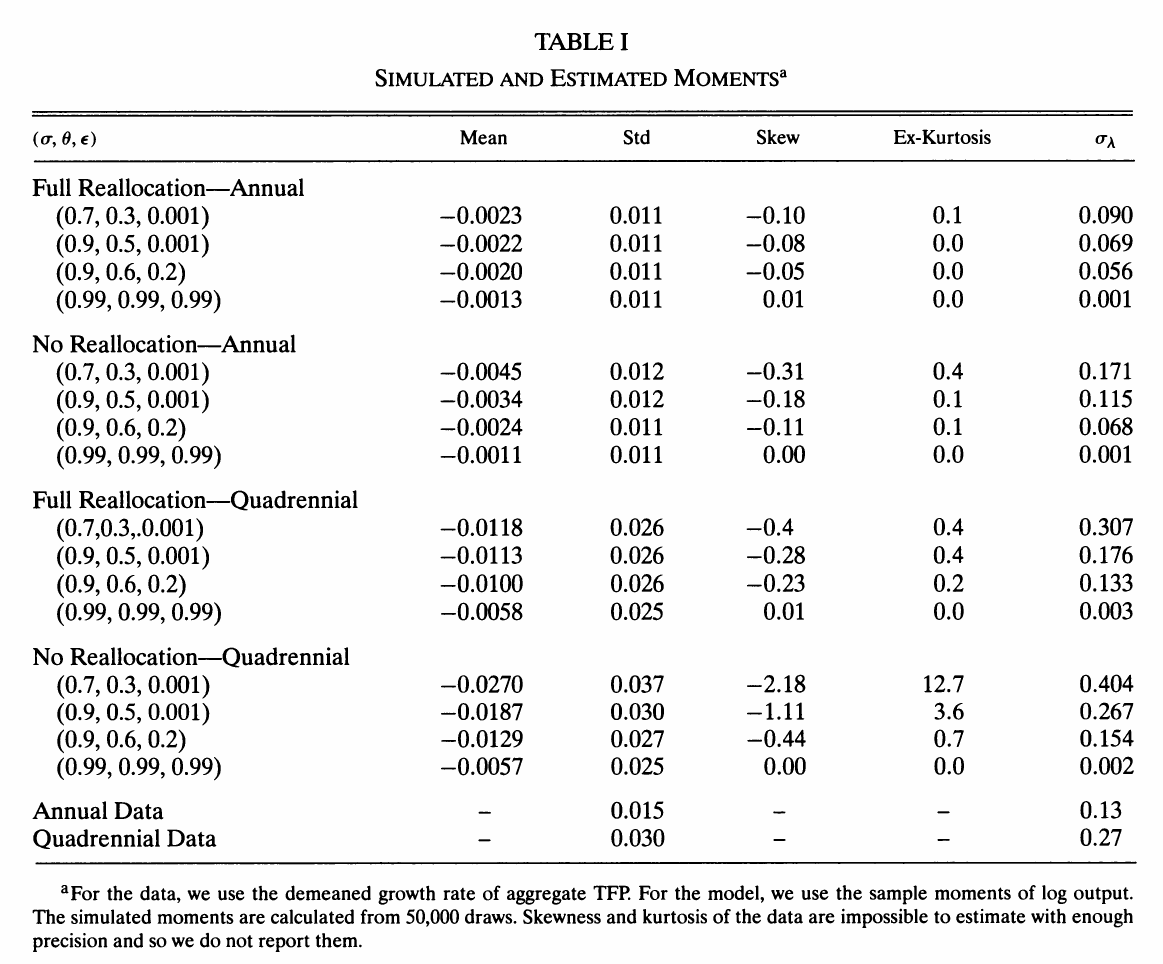
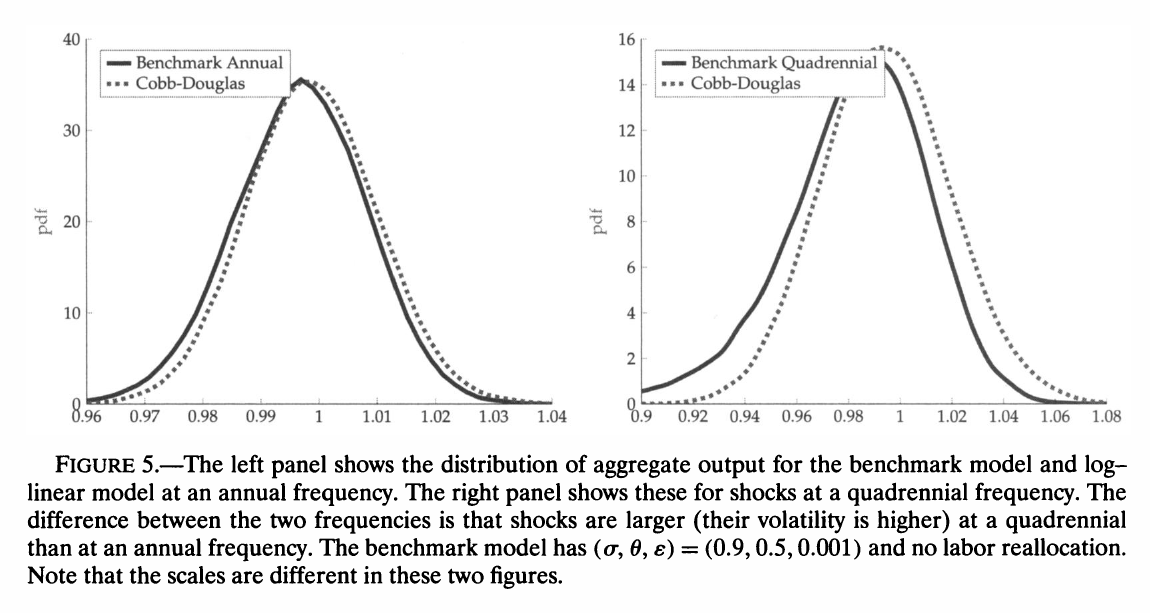
The benchmark without reallocation loses 0.34 percent of output on average at an annual horizon and 1.87 percent at a quadrennial one; netting out the mechanical Jensen term the log-linear model also has, the loss from nonlinearity is 0.23 and 1.30 percent. The Lucas welfare cost of the same fluctuations, from curvature in utility rather than in production, is 0.01 and 0.05 percent. The quadrennial benchmark also has skewness of and excess kurtosis of 3.6 from lognormal shocks; the lower-elasticity calibration reaches and 12.7.
The figure that the rest of the list keeps redrawing is the one that puts the Walmart example into the model. Oil and gas and retail trade have about the same Domar weight, so the two dotted Hulten lines lie on top of each other. The nonlinear responses do not. Retail is nearly log-linear; oil bends hard, and a 35 log-point negative shock to it costs roughly twice what the same shock to retail does.
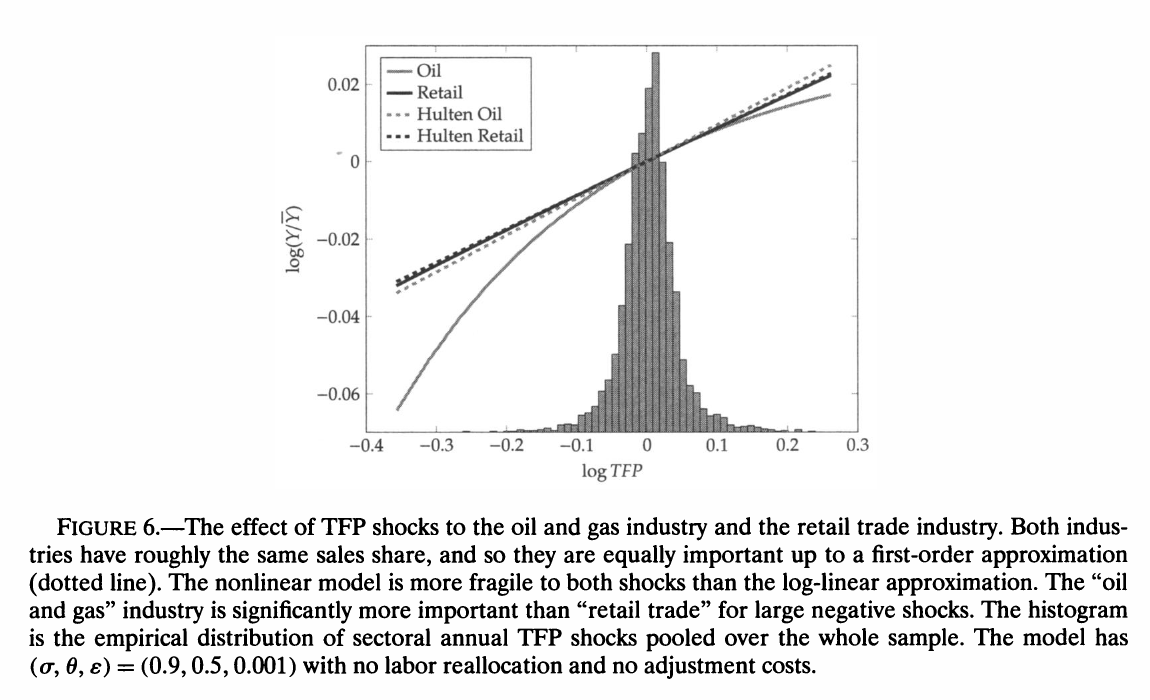
The reason is the two ingredients above. Oil is close to a universal input, so the low production elasticity governs it rather than the friendlier consumption elasticity , and oil extraction uses few intermediates, so resources cannot flow in to reinforce the weak link. The Supplemental Material adds that the ranking of industries is not even stable in the size of the shock: construction outranks oil for small and positive shocks and is overtaken for large negative ones.
The 1970s, done with a Törnqvist index
The oil-shock exercise is the paper’s most portable trick, because it needs no model at all. Proposition 10 says that to second order the effect of a shock is the shock times the average of the Domar weight before and after — Törnqvist’s (1936) index, rederived. For a historical episode you do not have to predict how the sales share responds; you can look. Crude oil was 1.8 percent of world gdp in 1972 and 7.6 percent in 1979, and was back at its pre-crisis level by 1986.
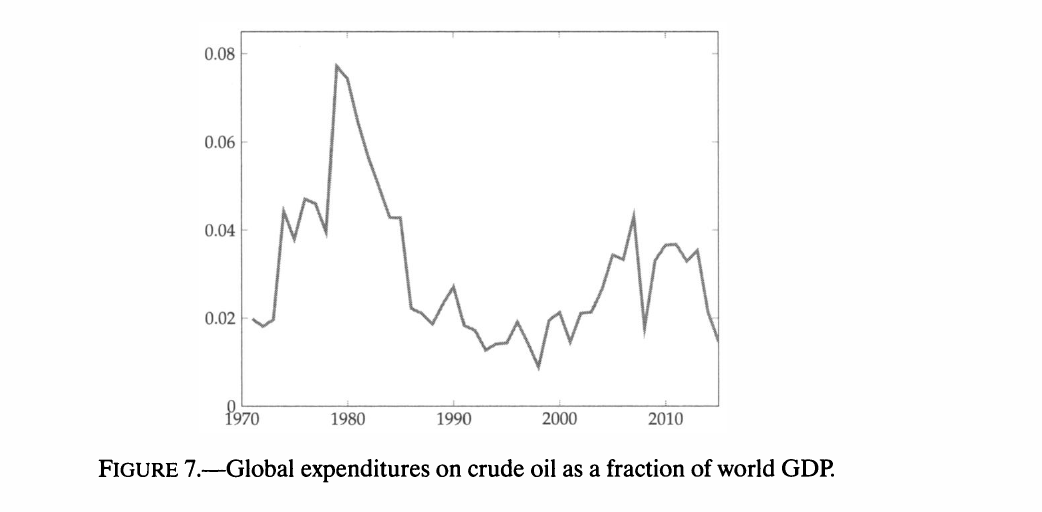
Weight the shock by 1.8 percent and you get Hulten; weight it by the average, 4.7 percent, and you get the second-order answer, a factor of 2.6 larger. With the shock itself measured as a cumulative 13 percent shortfall in demeaned world crude production over 1973–80, the first-order loss is 0.23 percent of world output and the second-order loss 0.61 percent. The authors are careful that the size of the shock is a quibble and the amplification is not: whatever you think the shock was, the second-order term nearly triples it. The same index run over 1948–2014 shows the rising Domar weights of slow-productivity sectors — Baumol’s (1967) cost disease, reinterpreted as this nonlinearity — taking about 19 percentage points off cumulative us tfp growth (the abstract rounds to 20).
The elasticities are the whole argument, so where do they come from?
Everything above scales with how far the ’s are from one, and the paper takes them from a small empirical literature a reader of this list should know by name. Atalay (2017), the source of the calibration, estimates the elasticity across intermediate inputs at essentially zero and the elasticity between value added and intermediates between 0.4 and 0.8; Boehm, Flaaen and Pandalai-Nayar (2019) find near-Leontief substitution at quarterly frequency in the supply chains hit by the 2011 Tōhoku earthquake. The paper’s own footnote adds the qualification that matters most for anyone who wants to use these numbers: complementarities prevail at the sector level, but substitutabilities dominate across firms within a sector, so the same machinery that amplifies negative sectoral shocks attenuates negative firm-level ones. The sign of the nonlinearity depends on the level at which you cut the data.
The second qualification is the horizon, which the model can only mimic with the reallocation dial. Near-zero elasticities are a quarterly fact; a year later factors have moved and the ge elasticity is a different, larger number, and Table I shows the gap between the two calibrations is most of the effect.
Where it sits
This is the paper that opens the production-networks sub-block, and it is context rather than a presented paper because none of it is about geopolitics; it is about what a sales share does and does not tell you. What it supplies is the definition every “chokepoint” argument later on relies on without restating. A strategic sector is not a large one — that is the first-order claim, and it is exactly the claim Hulten makes irrelevant. It is one with a large -weighted variance of exposure downstream and low elasticities of substitution at the nodes that would have to do the substituting, hit with a shock big enough that the second-order term is no longer small. Those are the conditions under which the network amplifies instead of averaging out, and they are the same conditions under which a foreign supplier has leverage. The that sets the cost of an oil embargo in Figure 6 is the that sets the coercer’s price in the interdependence papers, which is why those papers keep citing this one.
The caveats travel with it. The paper is about efficient economies, and its conclusion warns that in inefficient ones “the ‘second-order’ terms that we characterize in this paper can become first order.” Its Domar weights are domestic production shares, which is why the oil exercise had to use world data; the accounting for an imported input is left to the authors’ open-economy sequel (Baqaee and Farhi 2024), the next thing to read. And the elasticity is a horizon and an aggregation level as much as a technology, so any coercion paper that reports a single number for the cost of a cut-off has, whether it says so or not, chosen a horizon. Hulten told you the network did not matter. This paper tells you it matters exactly when the shock is large, the input is hard to replace, and nobody can move yet — which is a fair description of the only cases anyone was ever worried about.