Notes on:
Estimating Dynamic State Preferences from United Nations Voting Data
Journal of Conflict Resolution
2017
geoeconomics · geopolitical alignment · UN voting · ideal point estimation · measurement
Paper · doi · PDF
Made with AI: Fable 5.1 (reading and writing)
Michael A. Bailey (Georgetown, Department of Government and McCourt School), Anton Strezhnev (Harvard, Department of Government) and Erik Voeten (Georgetown, Department of Government and the Walsh School of Foreign Service). Journal of Conflict Resolution 61(2), February 2017, pp. 430–456, doi:10.1177/0022002715595700. Written from the published version, read in the jstor scan (the copyright line reads 2015; page numbers below are the journal’s). No talk recording exists. The current data release is described from Voeten’s codebook of 28 July 2025 for the Harvard Dataverse dataset, and tagged as such where used.
Counting agreements is measuring the agenda
The obvious way to measure how close two countries are politically is to count the General Assembly votes on which they voted alike and divide by the votes they both cast. That is Lijphart’s (1963) index of agreement, and the version almost everyone uses is Signorino and Ritter’s (1999) S score, “the most widely used” (p. 432), which runs from 1 (agree on everything) to −1 (disagree on everything) with an abstention counted as halfway between a yea and a nay (pp. 432–433). Bueno de Mesquita’s (1975) Kendall tau-b and Gartzke’s (1998) Spearman “affinity” are the same idea with a different correlation coefficient (n. 2, p. 453).
The trouble is the denominator. The paper’s own example (p. 433): ten votes, countries A and B agree on nine. Next session their preferences do not move, but the Assembly holds ten more votes on the one issue that divides them, and their similarity falls “from 90 percent on the first ten votes to 50 percent on all twenty votes even as their preferences did not change.” Voeten’s codebook puts it more bluntly: the agreement score is “very sensitive to changes in the agenda,” and agreements can move “due to changes in preferences or because there are a lot of votes in the Middle East in a given year.” A regression of trade on that score is, in part, a regression of trade on what the Assembly’s committees happened to schedule.
A smaller problem gets fixed in passing. An absence is not an abstention: in 68 percent of the votes on which a state is absent, it is absent on the next roll call too (p. 432), which is what you would expect of a country that has temporarily mislaid its government rather than one registering mild disapproval of a resolution on Namibia. So absences are treated as missing, not as a soft nay.
A chain index for foreign policy
What Bailey, Strezhnev and Voeten build instead is, structurally, a matched-model price index. (My gloss, not theirs; they say “dynamic ordinal spatial model,” which is the same object with fewer economists in the room.) An index maker cannot compare prices across years by averaging whatever is on the shelf, because the basket changes; she links the years through the goods that appear in both. Here the goods are resolutions, the price is a country’s vote, and the link is that the Assembly repeats itself.
The model, transcribed from pp. 435–436: states , votes , one ideal point per state per session on a single line. A state’s latent position on a given vote is with standard normal noise. The discrimination parameter carries the vote’s “polarity” in its sign and, in its magnitude, how cleanly the vote sorts high- from low- countries. A vote with near zero is “a muddle of yea, abstain, and nay voting across the ideological spectrum” (p. 435) and the model barely listens to it, which is the second thing an agreement score cannot do, since it weights every vote the same. Each vote has cut-points ; yea and nay are the two ends of the line and abstain the middle. With and , the probability that state picks option is the ordered probit (p. 436, unnumbered display):
(A warning for anyone coding this: the paper is not consistent about which end is which. The prose on p. 435 and Figure 1 on p. 434 put yea at the high end of a positive- vote; the printed choice rule on p. 435 assigns yea to the lowest segment. Nothing downstream depends on it, so I say “two ends” and leave it there.)
Now the part that does the work. If every ideal point in a session moves one step left and every cut-point one step right, nothing observable changes (p. 435), so the votes alone cannot pin the 1975 scale to the 1976 scale. The identifying restriction is that “resolutions with the same content have the same cutpoints, and ,” and it is deliberately short-range: “Context could change too with time, which is why we limit to five the number of consecutive years in which the resolution parameters are fixed” (p. 436). A country that votes yea on an identically worded text in 1981 and abstains on it in 1983 has moved, and the model knows how far, because the item’s cut-points did not. Comparisons across a decade come from chaining such links through the ideal points, not from any single resolution holding still for ten years, which is how a chained index gets from 1975 to 1995 without a 1975 basket. The scale is then fixed by centring ideal points on zero with unit standard deviation (p. 436).
Finding the links was a plagiarism exercise. The authors downloaded every resolution, ran the texts through WCopyFind 3.0.2, read the high-scoring pairs by hand, and dropped budget and other annual resolutions that “could clearly not have an identical interpretation across years” (p. 437, n. 6). That gives 799 identical pairs, slightly friendlier than average (60 percent yes votes rather than 57), a little heavier on colonialism and the Middle East, and mostly boring: 97.2 percent of the time a state votes the same way on the repeat, the United States changing its mind more than most, 4.2 percent of the time (p. 437). Boring is the point; the 2.8 percent that change are the informative observations.
Across sessions the ideal points are tied by “a Bayesian prior on the estimate for based on ” whose variance sets the smoothing (p. 436). The paper gives this in words only; a random walk is a fair rendering, and I label it as mine. The variance is set by judgement, following Martin and Quinn (2002), “at a point at which the estimates do indeed move from period to period but not too dramatically,” and the authors say plainly that “there is no consensus way to determine its value” (p. 436). What they chose it for matters, because the reading group’s note has it backwards: the random walk was picked over Voeten’s (2004) earlier polynomial-in-time precisely because “it allows for discrete shifts in ideal points, for example, responding to regime change. The prior will soften these shifts but will not make them conform to a specific functional form over time” (p. 436). It is a smoother, not a brake. The whole thing is fitted by a hybrid Metropolis–Hastings/Gibbs sampler (pp. 436, 451) on 4,335 divisive roll calls over sixty-seven sessions, January 1946 to December 2012; the quarter or so of resolutions adopted without a roll call carry no information (p. 437).
What the line looks like
Anyway, the abstract:
United Nations (un) General Assembly votes have become the standard data source for measures of states preferences over foreign policy. Most papers use dyadic indicators of voting similarity between states. We propose a dynamic ordinal spatial model to estimate state ideal points from 1946 to 2012 on a single dimension that reflects state positions toward the us-led liberal order. We use information about the content of the un’s agenda to make estimates comparable across time. Compared to existing measures, our estimates better separate signal from noise in identifying foreign policy shifts, have greater face validity, allow for better intertemporal comparisons, are less sensitive to shifts in the un’ agenda, and are strongly correlated with measures of liberalism. We show that the choice of preference measures affects conclusions about the democratic peace.
The dimension, in the authors’ words, is “the position of states vis-à-vis a us-led liberal order. During the Cold War, this was the East-West conflict between communist and capitalist states. Since the end of the Cold War, the non-Western pole has been occupied by a motley crew of states that have little ideological cohesion other than their opposition to the Western liberal order” (p. 431). To compare with S scores they take the absolute distance between two ideal points and flip the sign, “ideal point similarity”; it correlates with the S score at .82 across all dyads (p. 438). High enough to reassure, low enough to matter.
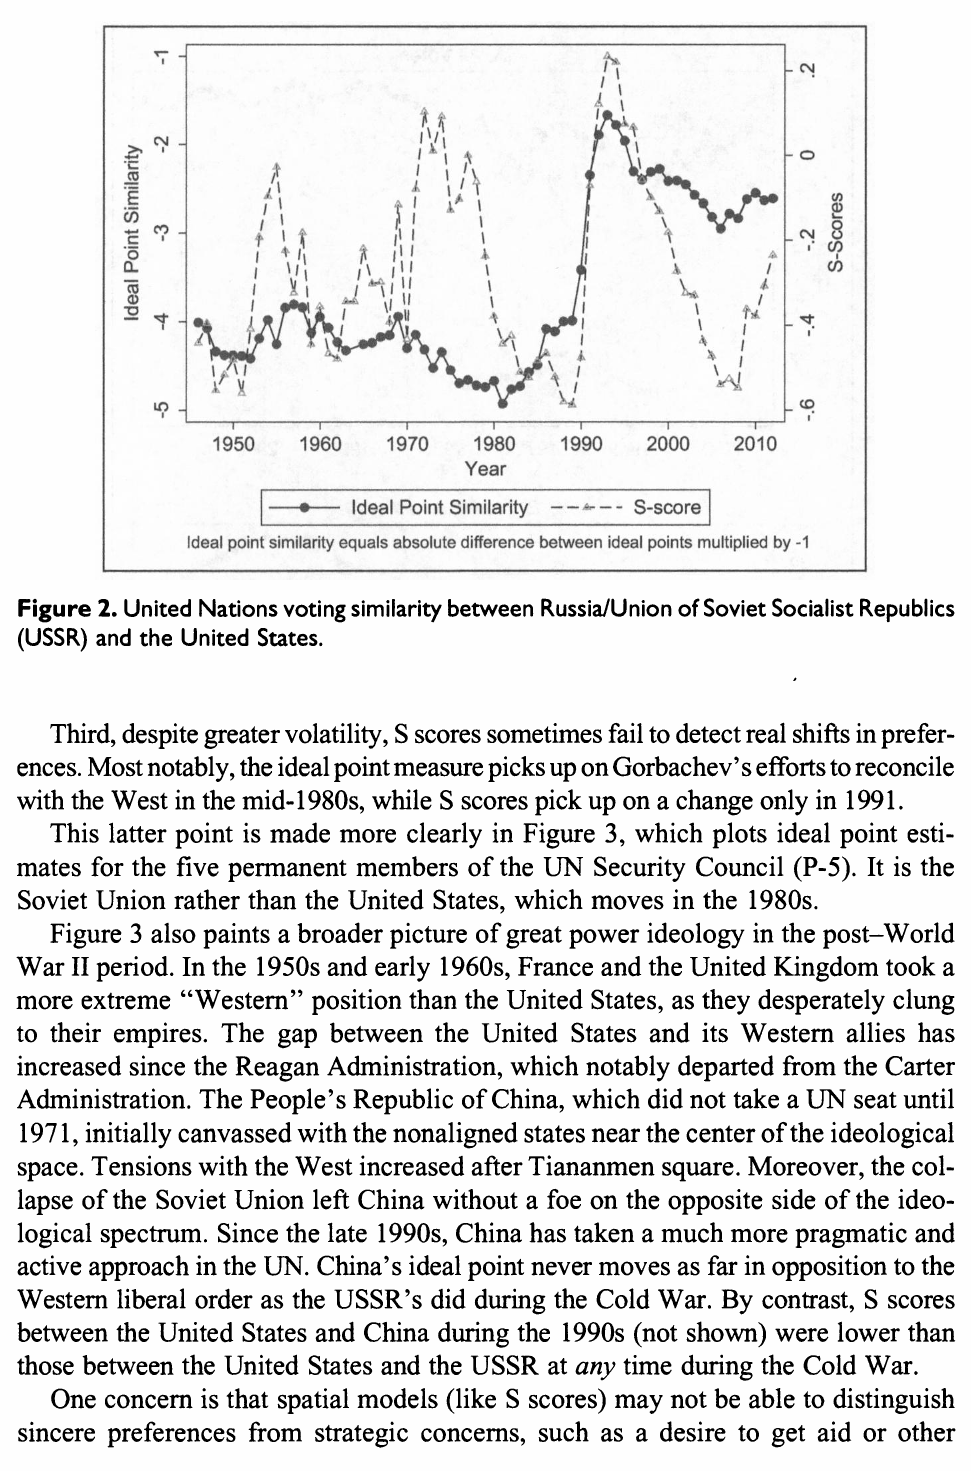
By S scores, the three darkest years in the us–Soviet relationship since 1946 are 1989, 2008 and 2009 (p. 438), and Washington and Moscow were closer in the mid-1950s and mid-1970s than at almost any point after the Wall came down. The explanation is agenda: the Suez votes split the United States from its allies, and the G-77’s North–South agenda of the early 1970s put the superpowers on the same side of many votes about un supranationalism, without either changing its mind about the other (p. 438). The ideal-point line ignores both, sits between −4 and −5 for forty years, and turns up from about 1986.
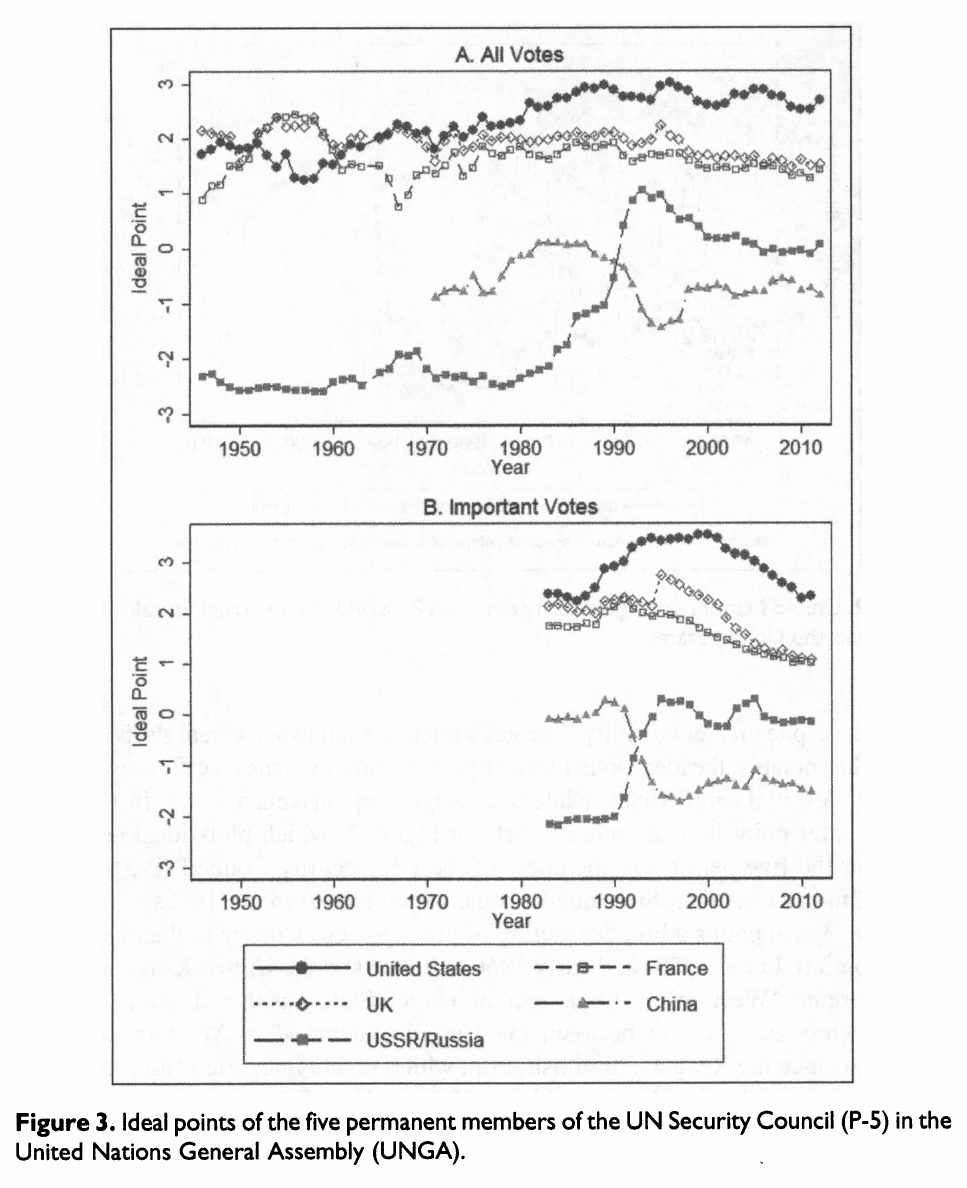
That timing is the first thing the model is good for. “It is the Soviet Union rather than the United States, which moves in the 1980s” (p. 439), under Gorbachev, where an S score sees nothing until 1991. A dyadic score can tell you two countries drifted apart; it cannot tell you which one walked. The rest of Figure 3 is a short history of great-power ideology: Britain and France to the right of the United States in the 1950s “as they desperately clung to their empires,” the gap between the United States and its allies widening from Reagan on, China entering in 1971 near the non-aligned centre, pulling away after Tiananmen, and never as far out as the ussr had been (p. 439).
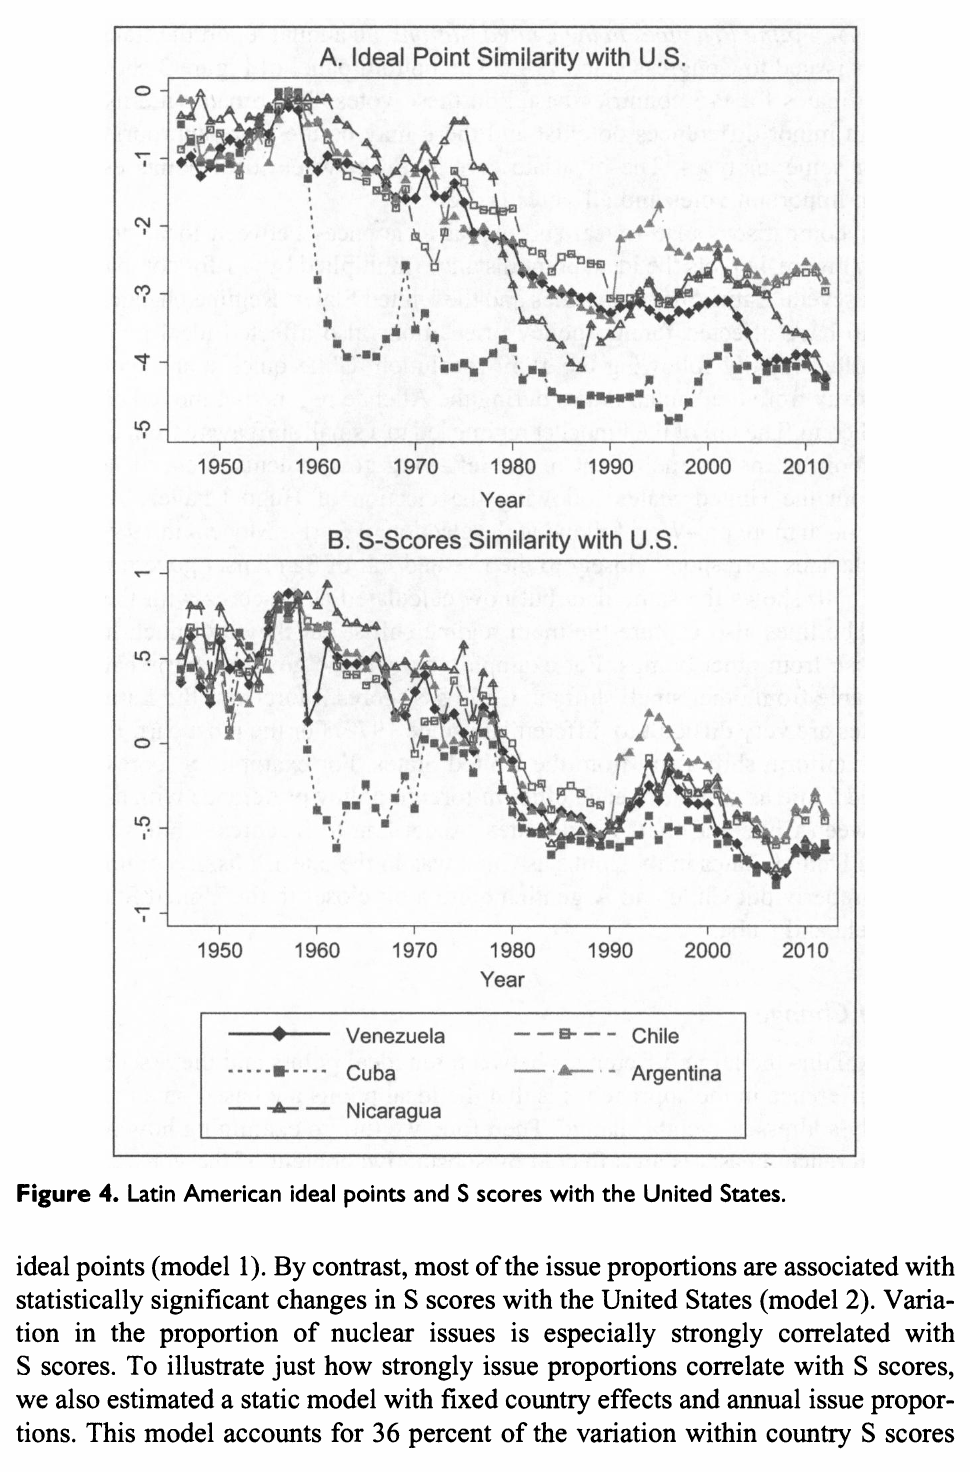
Figure 4 is the regime-change test, and it is where the “gradual” complaint dies. Cuba falls off a cliff after 1959. Chile “quickly and temporarily shifted away from the United States during the Allende regime but moved back after the 1973 coup.” Venezuela turns after Chávez, Argentina turns West under Menem in 1989, Nicaragua tracks the Sandinistas in and out (p. 441). In the S-score panel the same five countries move as a bloc, Allende is “barely distinguishable from other small shifts,” and Chile in the 2000s sits as far from Washington as Cuba did in the late 1960s (p. 441). Broner, Martin, Meyer and Trebesch (2025) list “little time variation” among their reasons for building a treaty database instead of extending this series; that is their characterisation, and the paper’s evidence runs the other way.
The agenda test, done properly
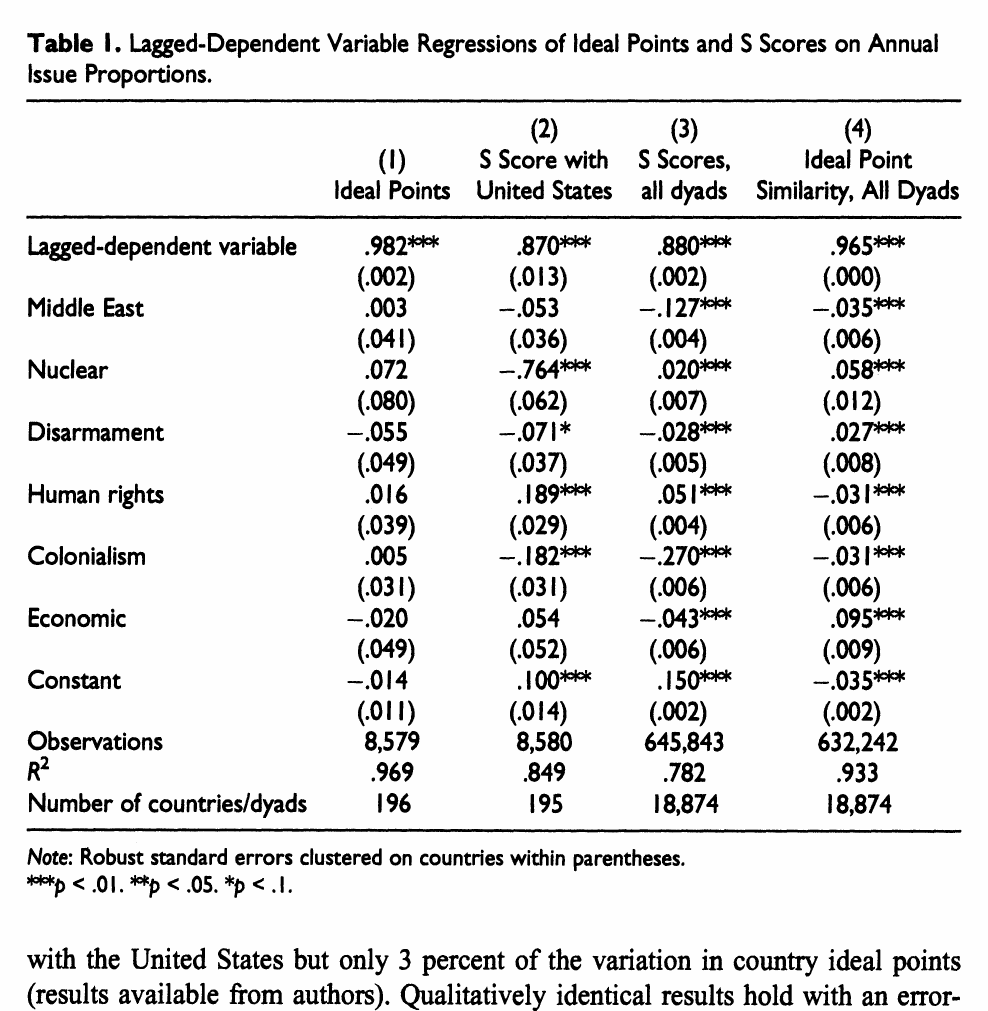
Face validity is cheap, so the paper regresses both measures on the year’s agenda: the shares of resolutions on colonialism, the Middle East, nuclear issues, disarmament, human rights and economics. In Table 1 none of the six shares moves a country’s ideal point; four move its S score with the United States, the nuclear share alone with a coefficient of −.764 (p. 443). Issue shares explain 36 percent of the within-country variation in S scores with the United States and 3 percent of the variation in ideal points (pp. 442–443). Year dummies explain 50 percent of the S-score variation and 27 percent of ideal-point distances, and in sixty of sixty-six years every dyadic S score in the world moves significantly in the same direction (p. 444). The obvious patch, residualising S scores on year dummies, is dismissed for a good reason: it “would incorrectly adjust for instances where there are real common shocks to preferences, such as with the end of the Cold War” (p. 444). Sometimes everyone really did move.
The discrimination parameters also say what the line is about. Human rights resolutions carry 0.35 more weight than uncategorised ones (half a standard deviation), colonialism 0.31, economics 0.12, disarmament 0.09; Middle East and nuclear resolutions are not significantly different from the base (p. 444). Nuclear votes tend to separate haves from have-nots, which puts all five permanent members on the same side, and their share of the agenda ranges from zero to about 30 percent by year (pp. 444–445), so a great-power-agreement index built from raw agreement lurches with the disarmament calendar. Nothing is thrown away; the weights downrank it. Anyone whose question is the Middle East is told to re-estimate on that subset, which the authors did, and which correlates with the main line at .83 (p. 445).
The surprising thing
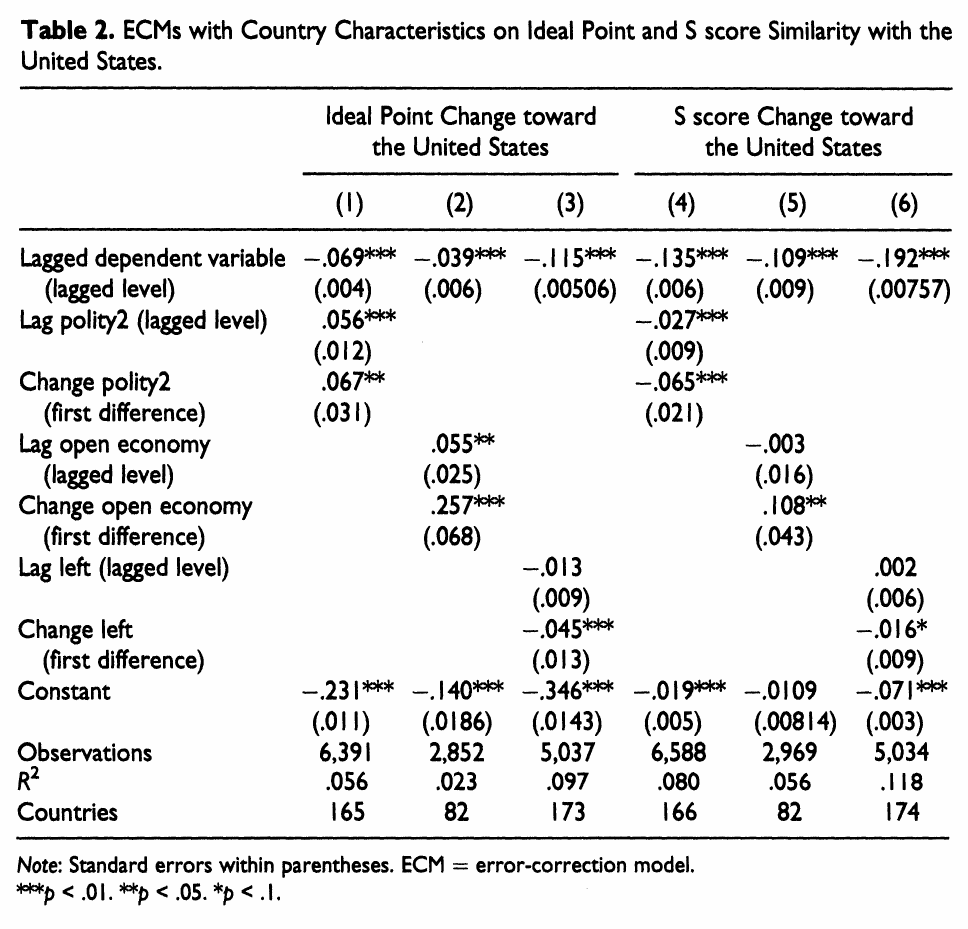
The validity check I would put on the first slide is Table 2. Error-correction models with country fixed effects and no year effects: does a country that democratises, opens its capital account, or elects the left move toward or away from the United States? On ideal points the answers are the ones you would guess, and a country going from fully closed to fully open moves about 0.2 toward the us pole (p. 446). On S scores, democratisation carries “a strong and significant negative correlation” with similarity to the United States, “exactly opposite of natural expectations” (p. 446). Add year fixed effects and the ideal-point results are “virtually unchanged” while the S-score coefficients on democracy and openness turn positive and significant (p. 447). In Latin America the gap between left and right governments is significant at p < .001 on ideal points and not at conventional levels on S scores (p. 447). So the measure most of the pre-2017 alignment literature used had the democratic-peace correlation upside down until you controlled for the calendar, and a specification that omitted year effects got a clean, significant, wrong sign.
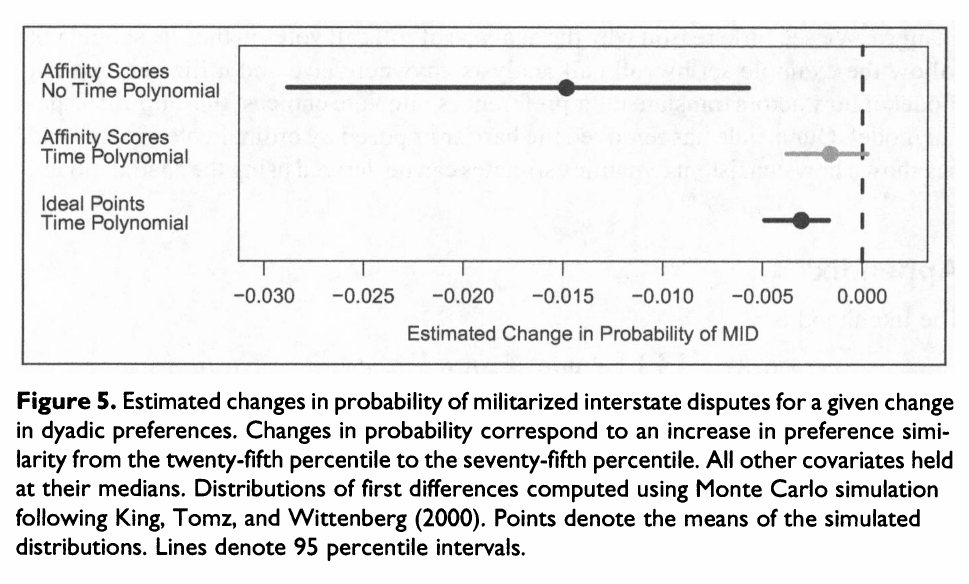
The paper then re-runs Gartzke (2000), the study that made un affinity a standard control in the democratic-peace literature, on 18,303 politically relevant dyad-years for 1950–85. Affinity predicts fewer militarised disputes until you add the now-standard cubic in years since the last dispute, at which point it stops being significant at the .05 level; swap in the negative ideal-point difference and the effect is back, significant, tighter, and with a better aic (4,239.8 against 4,302.5; p. 448 and n. 12). The effect sizes are of the same order, which is the modest and correct claim: less noise, same signal.
Are the positions for sale?
The caveat the reading group attached to this paper comes from Kuziemko and Werker (Journal of Political Economy, 2006), who find that a country’s us aid rises by about 59 percent in the years it holds a rotating Security Council seat. If votes are what a hegemon pays for, a displayed position is a transaction as well as a taste. It is a fair worry, and worth being precise about what the paper says to it, because the authors saw it coming and disagree about the venue. They are explicit that the model recovers “revealed preferences rather than underlying ’true’ preferences,” and that “given that unga votes are nonbinding, we suspect that strategic voting is less prevalent than in other arenas of world politics, such as the un Security Council” (pp. 436–437). They concede the evidence of vote-buying in the Assembly (Carter and Stone 2015), note that it should bite hardest on resolutions the United States actually lobbies, and offer a check: a second set of ideal points estimated only on the 336 votes the State Department has flagged as important in its annual report to Congress since 1983, the votes on which it “declared it lobbied other countries” (pp. 437, 440–441). That series is panel B of Figure 3, and it correlates with the all-votes series at .92 (p. 441).
You can read .92 two ways. The charitable reading is that the votes most exposed to buying tell the same story as the votes least exposed to it, so the buying is not what the line measures. The other reading is that if the influence is spread evenly it would not show up as a difference, which is not the same as not being there. The authors take the first, and their remedy is the honest one: the effect of aid on positions “could be modeled empirically based on the ideal points we estimate” (p. 437), that is, ideal point on the left-hand side, aid on the right. For the gravity papers in the first block that is the operative point. When trade is regressed on ideal-point distance the distance is treated as given, but the hegemon that might pay for alignment is also the one offering market access, so the coefficient is a reduced form for a bargain rather than an elasticity of trade with respect to taste. The carrots-and-sticks papers and Kleinman, Liu and Redding do what the authors recommend and put the vote on the left. Kuziemko and Werker’s 59 percent is about the other chamber; it is a reason to run that regression, not a number about this dataset.
Housekeeping, and where it sits
Two notes from Voeten’s July 2025 codebook. The estimates are now by calendar year rather than session, because “researchers in practice virtually always use years” and sessions increasingly spill into the next year and into emergency sessions on Gaza and Ukraine; a session-based legacy series is kept and correlates with the new all-votes series at .9877. And there are two series, one from final-passage votes only (the fp suffix means final passage, nothing more exotic) and one from all votes including paragraphs and amendments, correlated at .9846, the all-votes series being more precise but in some years dominated by a single issue. A group merging Gopinath, Gourinchas, Presbitero and Topalova’s (2025) blocs, built on an older release, with a fresh Dataverse pull should re-derive the blocs rather than paste them; the scale is zero mean and unit variance over whatever sample was run.
On the reading list this is the data row of the measurement sub-block and the right-hand-side variable of most of the first block: the blocs in Gopinath and coauthors, the alignment in Aiyar and coauthors’ (2023) fdi gravity, the outcome in Kleinman, Liu and Redding (2024). What the paper supplies is not the data, which is Voeten’s ongoing labour, but the reason to trust one number over another: the anchored ideal point measures a position, the agreement score measures a schedule. What it does not supply is any claim that the position is about the thing your regression is about. The authors’ closing warning is that un-based measures “have nothing to say about whether two countries agree on how to resolve a border conflict or regional issues,” and are useful only “if we believe, theoretically, that a state’s position on global issues matters for the outcome under consideration” (p. 449). Which is a polite way of saying that after seventy-five articles in fifteen years built on un votes (p. 432), the authors of the best un-vote measure would like you to think, briefly, about whether the General Assembly is where your question gets decided.