Notes on:
Consumption and Real Exchange Rates in Dynamic Economies with Non-Traded Goods
Journal of International Economics
20 January 2023
real exchange rates · risk sharing · puzzles
Paper · PDF
Written by Fable 5
David Backus and Gregor Smith, Journal of International Economics 1993. Read here in the Queen’s Economics Department working paper reissue (No. 1252) of the January 1993 draft. No talk recording exists; written from the paper alone.
Here is a paper whose fame rests on a single equation that the data then humiliate, and whose authors had the good manners to perform the humiliation themselves. The bkk (1992) paper earlier in this list found that consumption is less correlated across countries than output — the quantity version of missing international risk sharing. Backus and Smith come at the same crime scene from the price side, armed with the most natural suspect of the era: nontraded goods. Haircuts and housing can’t be shipped, their prices differ across countries, so purchasing power parity fails even when the law of one price holds for everything shippable — and, at the same time, since each country eats its own nontraded endowment, consumption baskets differ and consumption correlations fall below one. One friction, two puzzles. The paper’s project is to take that story seriously as general equilibrium and see what it commits you to.
The commitment
The economy is a multi-country Lucas-style (1982) endowment world: one traded good, one nontraded good per country, complete markets in state-contingent claims, identical homothetic ces preferences. The planner’s first-order conditions collapse — this is the whole paper, really — into a startlingly clean condition linking any two countries’ consumption indexes to their bilateral real exchange rate:
(equations 4.7 and 4.8 in the paper). In words: with efficient risk sharing, the country whose consumption basket got cheap should be the country consuming relatively more. That is what insurance means when price levels differ — the contract pays you goods precisely in the states where your goods are on sale. The result needs remarkably little: no assumptions about the endowment processes, no observation of nontraded output, no calibration. Relative consumption growth and real exchange rate growth should be perfectly correlated, with the same dynamics, in every country pair, with a slope tied to risk aversion γ.
Note what an attractive theory this is for the puzzles it was hired to solve. It generates ppp deviations (nontraded prices differ), imperfect consumption correlations (aggregate consumption loads on the nontraded good), and real interest differentials (expected changes in relative price levels) all at once — the authors work through examples where the real interest differential is literally the expected growth differential of nontraded endowments. Everything a late-80s international macroeconomist wanted, from one device.
The scatter
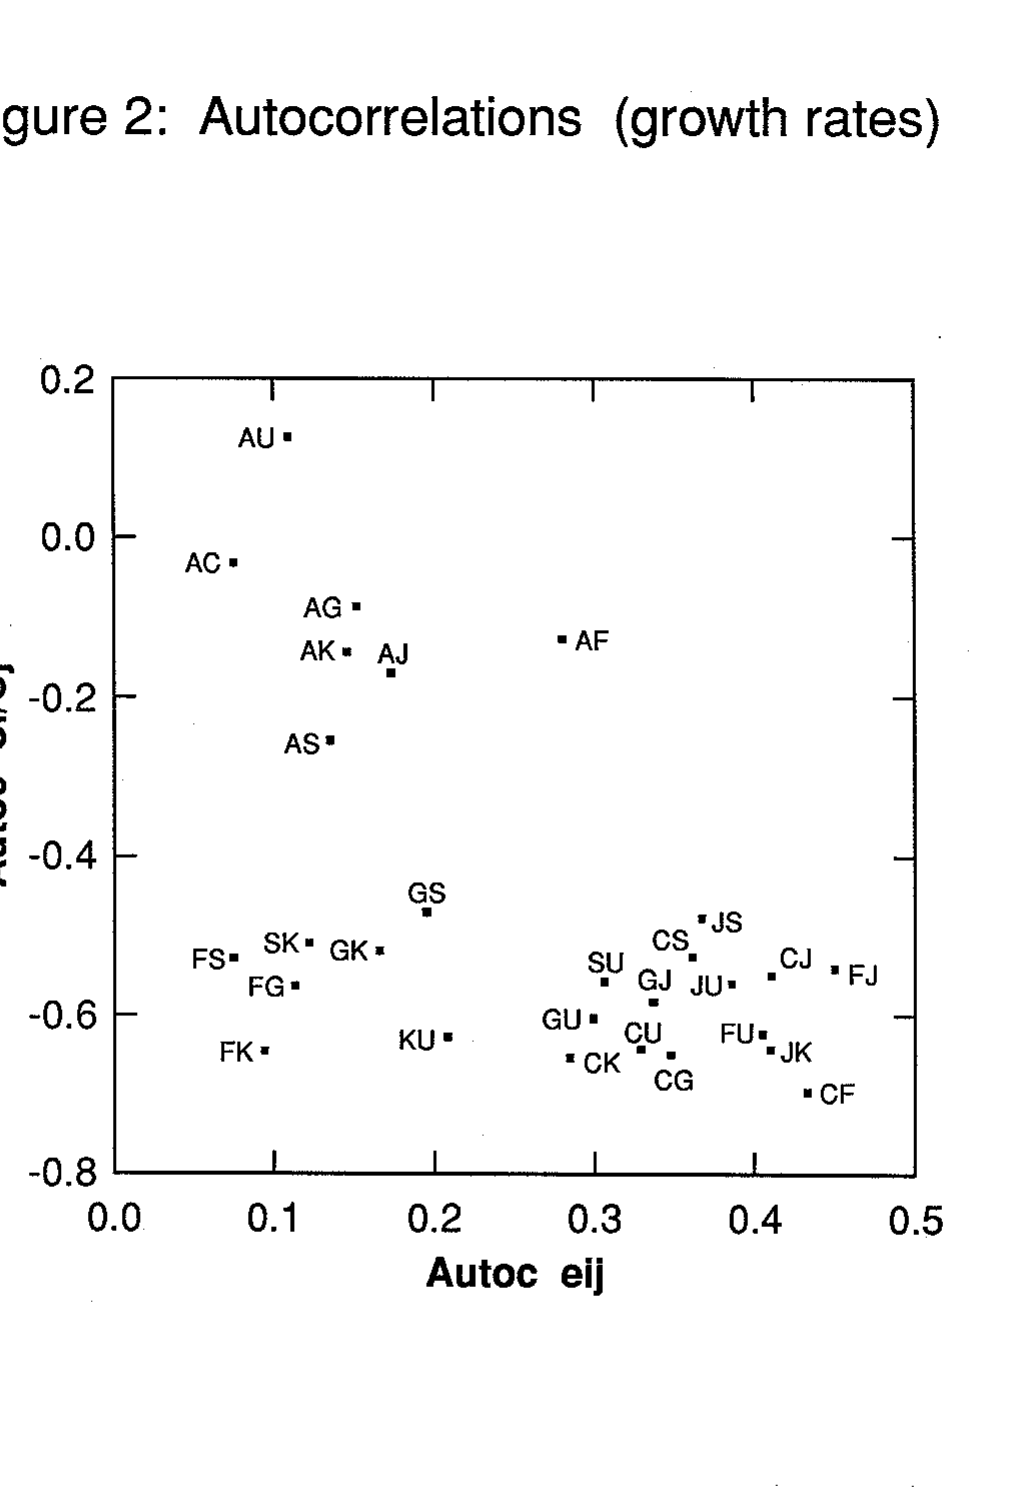
Then Section 5 opens the oecd data — eight countries, 28 country pairs, quarterly 1971–1990 — and plots moments of Δlog(cᵢ/cⱼ) against moments of Δlog(eᵢⱼ). Theory says every one of these scatterplots slopes up; the standard-deviation and mean plots should be lines through the origin with slope 1/γ, the autocorrelation plot a 45-degree line.
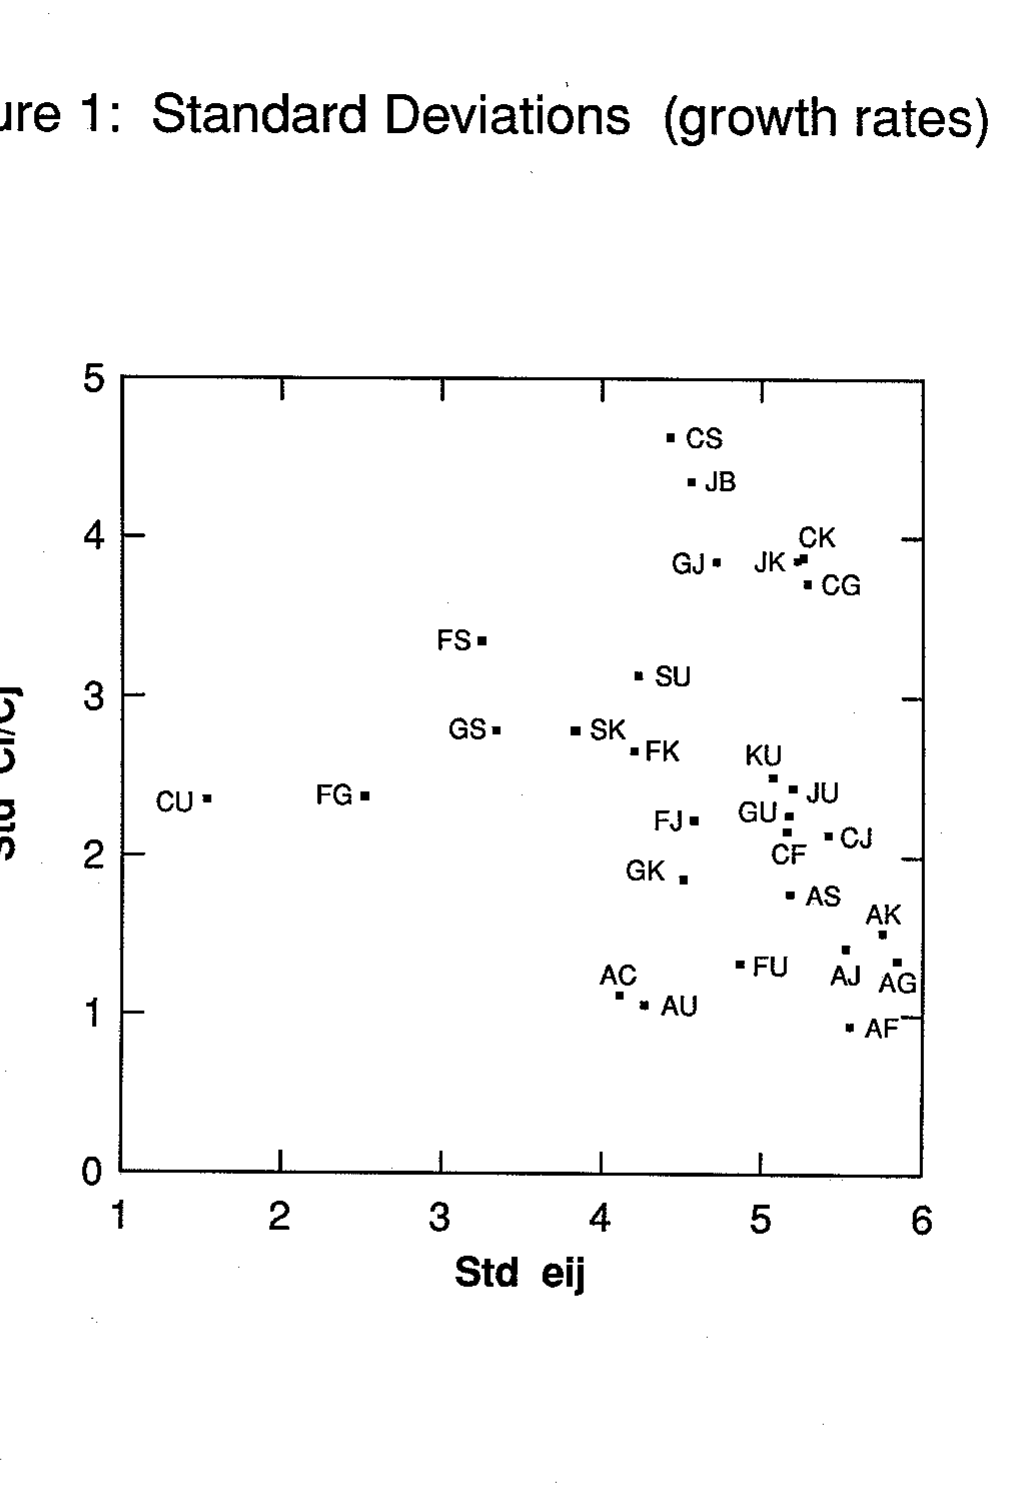
They are clouds. The rank correlations across the three figures are −0.263 (volatilities), −0.466 (autocorrelations), and 0.074 (means) — the only statistically significant one has the wrong sign. Pairs with volatile real exchange rates do not have volatile relative consumptions. Worse, the dynamics are qualitatively opposed: all 28 real-exchange-rate growth rates are positively autocorrelated, while 27 of 28 relative-consumption growth rates are negatively autocorrelated.
And the headline correlation — the one condition (4.8) says should be one — averages 0.045 across pairs, with a range of [−0.08, 0.17]. The authors emphasize how little they had to assume to run this test: no detrending choices, no parameter restrictions, no classification of goods into traded and nontraded. The theory fails on its weakest, most robust implications.
What the anomaly is, exactly
It is worth being precise about what died here, because the label “Backus–Smith puzzle” gets used loosely. Nontraded goods as a source of ppp deviations survived fine. What failed is the risk-sharing overlay: the claim that, however relative prices come about, efficient insurance ties relative consumptions to them. Real exchange rates move enormously; relative consumptions barely respond, and if anything in the wrong direction. Either markets are far more incomplete than the Arrow–Debreu (1954) benchmark (the authors’ short list of escapes includes incomplete markets, taste shocks — which flip the predicted correlation’s sign — wealth effects, and measurement error), or something is generating exchange-rate movements that have almost nothing to do with the allocation of goods. Obstfeld and Rogoff’s (2000) six-puzzles paper, one entry back in this list, calls the empirical rejection of this condition “devastating” and votes for incomplete markets; the segmented-financial-markets model behind Itskhoki and Mukhin’s (2025) Mussa paper, three entries ahead, is in large part a machine for generating exactly this disconnect — financial shocks move the exchange rate while consumption stays put, flipping the Backus–Smith correlation negative, as in the data.
There is a neat piece of intellectual economy in how the two Backus anomalies fit together. bkk said consumptions comove too little across countries given what complete markets promise about quantities; Backus–Smith says consumption fails to comove with prices in the way complete markets promise. Same missing insurance, detected in two different ledgers — and the fact that the price-side version survives any assumption about endowments or technology is why it became the sharper diagnostic. Most modern open-economy models are graded, before anything else, on the sign of one correlation: the one this paper measured at 0.045 and theory set at 1.