Notes on:
What if? The Economic Effects for Germany of a Stop of Energy Imports from Russia
ECONtribute Policy Brief 028; published as Economica 91(364), 2024
7 April 2022
geoeconomics · production networks · elasticity of substitution · energy · sanctions
Talk · Paper · doi · PDF · Transcript
Made with AI: Fable 5 (reading), Fable 5.1 (writing)
Rüdiger Bachmann (Notre Dame), David Baqaee (ucla), Christian Bayer (Bonn), Moritz Kuhn (Bonn), Andreas Löschel (Bochum), Benjamin Moll (lse), Andreas Peichl and Karen Pittel (ifo, Munich), and Moritz Schularick (Sciences Po and Bonn). ECONtribute Policy Brief 028, dated 7 March 2022, twelve days into the war; the version read is that brief with the 29 April 2022 technical appendix bound in after it, which is where the formulas, the model tables and the section on “why Leontief production at the macro level is nonsensical” live. Later published as “What If? The Macroeconomic and Distributional Effects for Germany of a Stop of Energy Imports from Russia,” Economica 91(364), 2024, doi:10.1111/ecca.12546. Baqaee and Moll presented the paper at Markus’ Academy (Princeton) on 7 April 2022, with Markus Brunnermeier interrupting throughout; that recording is used here and three slides are taken from it. Table 2 is cropped from the brief; the appendix’s own Table 2, on the hardest-hit industries, and its Table 3 are cropped from the appendix. The sequel, Moll, Schularick and Zachmann’s 2023 retrospective on what actually happened, is digested separately.
A bottleneck is a claim about a derivative
Start with the arithmetic everyone in Berlin was doing in March 2022. Russia supplied 55 percent of Germany’s gas, gas was 27 percent of German primary energy, and gas is what the chemical industry turns into ammonia and what households burn, a third of the total, to keep warm. Cut it and, the argument went, production cascades down the supply chain: no gas, no ammonia, no fertilizer; no gas, no steel; no gas, “mass unemployment and poverty,” in the phrase Moll says politicians were using on television. The chief executive of basf would shortly ask, in a newspaper interview at the end of that month, whether Germany wanted to destroy its entire economy with its eyes open.
There is a second arithmetic, equally simple and equally wrong. Germany’s gas imports are about 1.2 percent of its gross national expenditure; lose 30 percent of them and you lose 0.36 percent of gne. The paper’s own word, nonsensical, is reserved for the Leontief side; on this side it says only that the second-order terms can be large. In the talk Moll is less polite, calling both extremes nonsensical calculations, and for this one he borrows an analogy Larry Summers used about the financial crisis: electricity is 3 or 4 percent of gdp, so let it fall by 80 percent, and some economist will tell you the loss is 3 percent of gdp, which Summers called crazy and Moll says the authors obviously agree with.
What separates the two arithmetics is one number. Write output as a ces function of energy and everything else , with the energy share and the elasticity of substitution. If (Cobb-Douglas) then : a 10 percent energy shock with costs 0.4 percent of output. If (Leontief) then : the same shock costs 10 percent, because when energy falls 10 percent, 10 percent of every other input becomes worthless. The political debate was a disagreement about which line Germany sat on; the paper’s move is to show that the territory in between is much closer to Cobb-Douglas than anyone’s intuition suggests, and to write the second-order term in a form you can have opinions about:
(eq. 5 in the appendix), where is the expenditure share of energy in output and of it is how much that share rises after the shock. The first term is Hulten’s theorem: the loss from a small shock is the input’s expenditure share times the shock, and nothing else about the economy matters. The second term is where the elasticity hides. Under Cobb-Douglas the share never moves. Under Leontief it jumps to 100 percent, because the marginal product of everything except energy, and hence its price, falls to zero. The paper treats that prediction as disqualifying: a model in which a 10 percent gas shortfall makes German labour and capital worthless is not a cautious model, it is a broken one.
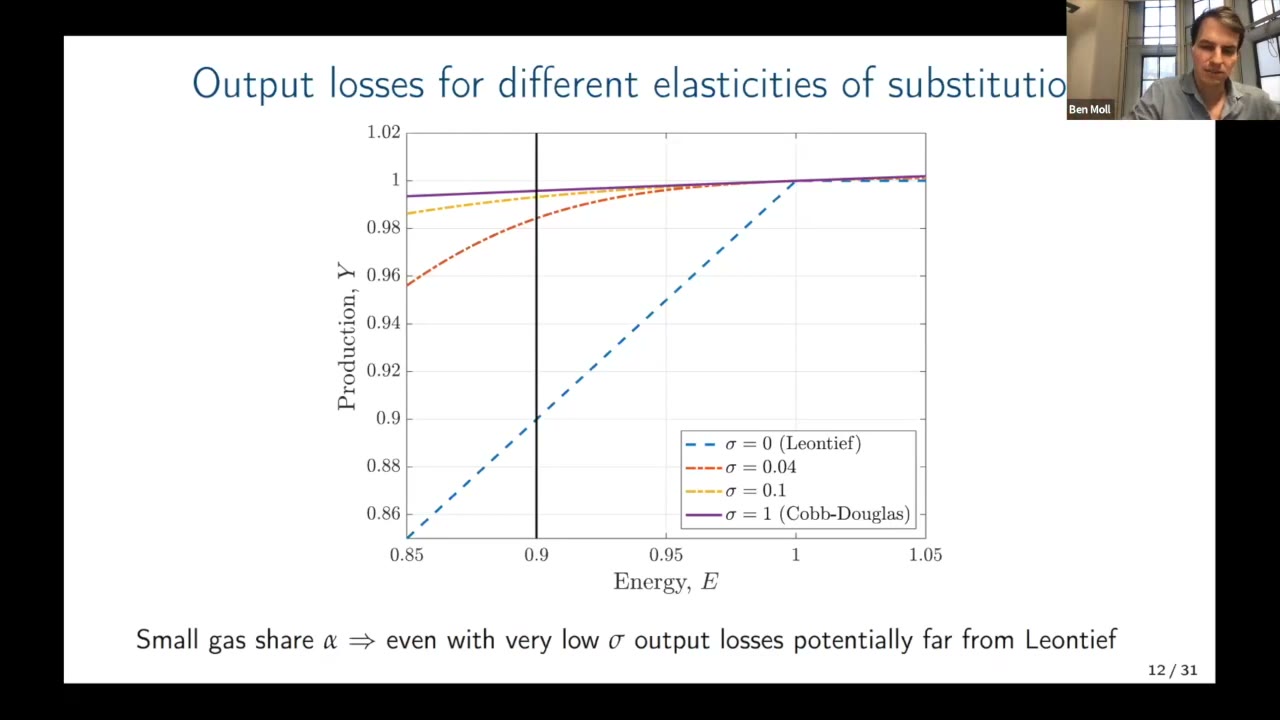
The figure is the paper’s most useful picture. With , well below anything in the empirical literature, a 10 percent energy shock costs under 2 percent of output, not 10; the red line hugs the purple one. And is already, by the paper’s own accounting, at the edge of sense: it implies the energy price rises almost tenfold, the price of other inputs falls by more than 30 percent, and the energy share goes from 4 to 26 percent, movements the authors call “borderline reasonable” and below which they call nonsensical. The paper’s line is flat: “Estimations assuming zero short-run substitution are not suited for policy analysis.”
The shock comes before the elasticity
The shock itself is built in layers by the energy economists on the team. Russian oil and coal can be replaced on world markets. Gas mostly cannot: the pipelines run where they run, Europe’s lng terminals were already close to full, and the iea thought perhaps 20 bcm of extra lng realistic against the 155 bcm the eu as a whole had piped in from Russia in 2021. The paper assumes gas imports from elsewhere rise by only 5 percent of consumption, leaving a 50 percent shortfall; switching power generation to lignite, hard coal and nuclear frees close to 20 percent of consumption; what remains is a 30 percent cut in gas for households, services and industry, about 8 percent of total energy. That is the shock every scenario uses, over a horizon Moll describes in the talk as “roughly until the next winter,” because gas demand is seasonal and the summer is for filling storage.
The network drops out, which is the surprise
The rich model is Baqaee and Farhi’s (2024) Networks, Barriers, and Trade: 40 countries, 30 sectors, nested ces on the World Input-Output Database (Timmer et al. 2015), chosen because it is known to generate large losses from trade barriers. The paper’s theoretical contribution is a lemma about what it does with an import stop. To first order, the change in real gne is the expenditure-weighted change in imports minus the expenditure-weighted change in exports, and the input-output matrix appears nowhere. To second order, add half the change in those shares times the shocks. For a stop of energy imports alone this collapses to
(eq. 7 in the appendix), where is real gne and is the share of energy imports in it: the same formula as before, imports in place of purchases. The appendix says the economy “behaves like one large representative producer,” and is careful about what that does not mean. The network matters; production chains amplify and the ability to import the downstream good dampens; but everything it does is summarised in how one share moves.
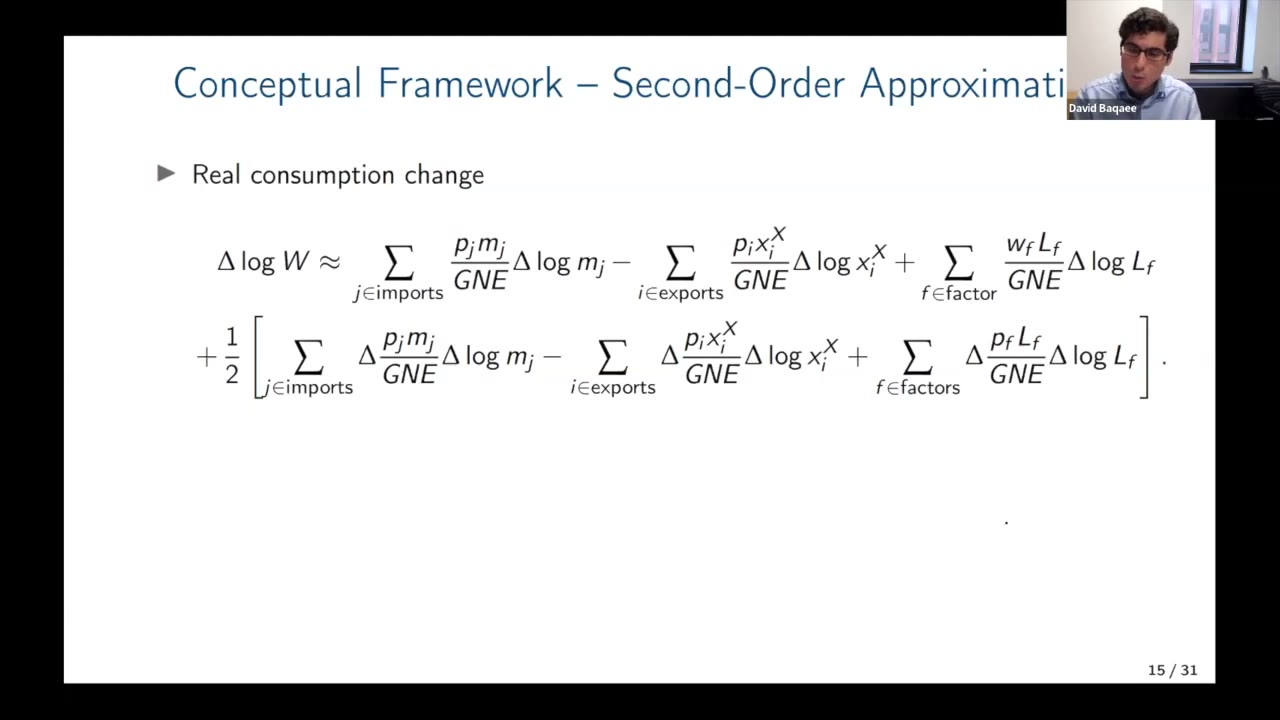
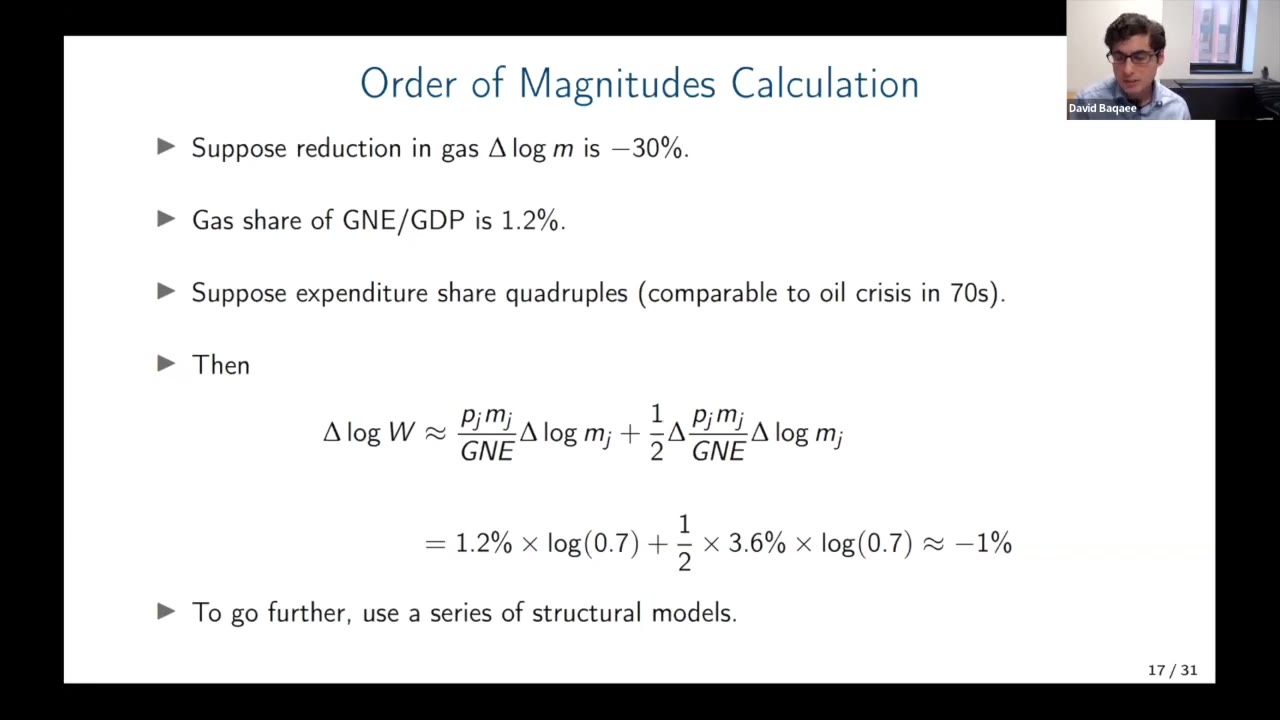
This is why the paper can do its arithmetic on an envelope and mean it. Energy imports are 2.5 percent of gne. Cut all Russian energy, substitute none of it, and let the share triple: . Treat gas as a separate input (1.2 percent of gne), cut it 30 percent, let its share triple: , the paper’s preferred envelope. In the talk Baqaee disciplines the share with history rather than a model: the world’s expenditure share on oil went from about 2 to about 8 percent across the two 1970s shocks, so let Germany’s gas share quadruple, and the answer is about minus 1 percent.
Where 0.5 to 3 comes from
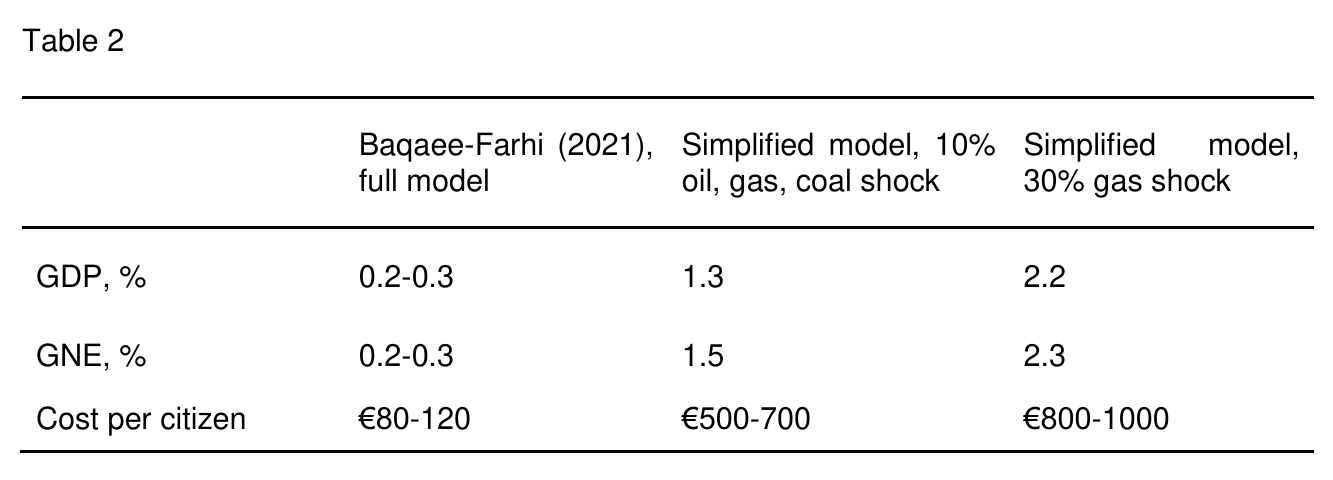
The headline range is three calculations laid end to end, each more pessimistic in construction than the last. The floor is the full model, run as an eu-wide choke-off of all Russian imports with labour and capital stuck in their sectors and the elasticities pushed from Baqaee and Farhi’s own values down to 0.05; it loses 0.19 to 0.30 percent of gne, “firmly below 1%” of gdp, rounded in the abstract to half a point.
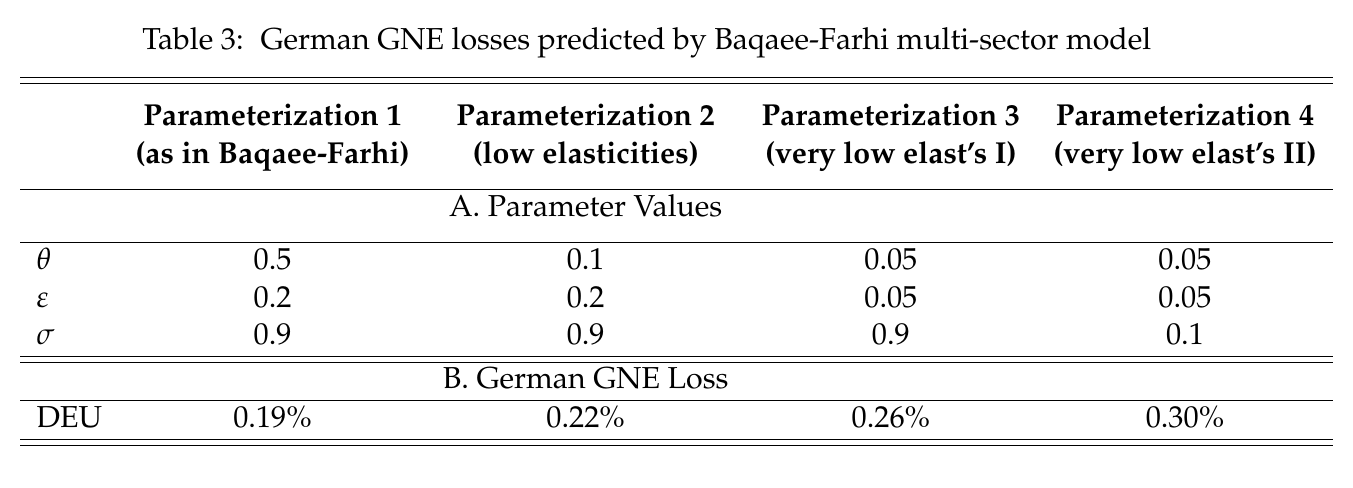
The authors immediately discount their own floor, because the model’s sector list has “Electricity, Gas and Water Supply” as one input, so the simulation lets a chemicals plant substitute gas with water. The middle column therefore drops the network and runs the one-sector ces on a 10 percent shock to all fossil energy (share 4 percent) at : 1.5 percent of gne, 1.3 of gdp, €600 per head. The last column makes gas a separate input (share 1.2 percent), cuts it 30 percent at : 2.3 percent of gne, 2.2 of gdp, €912 per head. The elasticities follow a rule Moll states out loud in the talk: take the short-run estimates, go to the bottom of the range, divide by two. The literature puts short-run own-price elasticities of gas and energy between 0.15 and 0.25 (Labandeira and coauthors’ (2017) meta-analysis gives 0.18 for gas; Steinbuks (2012) 0.16 for uk manufacturing and more than three times that for process heat; Auffhammer and Rubin (2018) 0.17 to 0.2 for households). Then 2.2 becomes 3 “so as to leave a ‘safety margin’” for what a real model omits, chiefly Keynesian demand effects; a companion heterogeneous-agent model by Bayer, Kriwoluzky, and Seyrich (2022), fed a 2.2 percent productivity shock and a 3 percent capital-obsolescence shock, lands at about 3 percent, inside the margin. (One untidiness: the brief’s text calls the middle scenario an 8 percent shock costing 1.4 percent of gdp, while its table and the appendix say 10 percent and 1.3.)
What was supposed to do the work
Three margins. Substitution across suppliers, which does everything for oil and coal and almost nothing for gas. Reduction in use, which is where the 30 percent lands: households turning down heating, industry switching process heat to other fuels, power stations burning lignite. And a margin the paper says the “engineering view” of substitution misses entirely: you need not replace the gas, you can replace the thing the gas was for. Moll’s example in the talk is the chain everyone cited against him, gas to ammonia to fertilizer: German ammonia producers lose, the fertilizer is imported, the farms downstream do not notice. Reallocation across firms and sectors is the same idea one level up, and it is why the macro elasticity exceeds the micro one; the appendix notes that the three industries that would be hit hardest, chemicals, food and metals, employ 1.5 million people against 2.6 million in the three that Covid actually shut, and an import stop would not shut them.
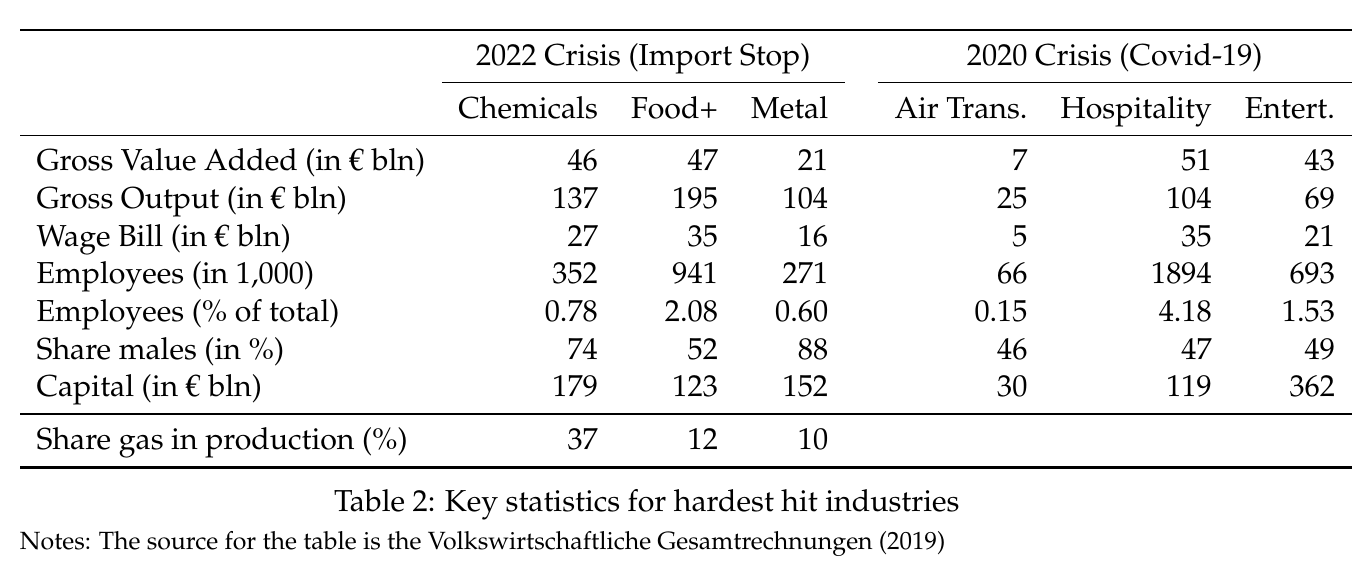
The full model’s numbers are smaller than the ces ones precisely because trade lets the downstream good come in from abroad; Moll concedes in the talk that this is “probably a bit too optimistic” for six months, which is why the headline rests on the column with no trade in it.
Anyway, the sentence the paper wants you to leave with turns a modelling choice into a belief that can be argued about in public:
In the model, the change in the share of energy imports in gne summarizes in a succinct fashion the substitutability implied by model choices about elasticities and changes in the input-output structure. Beliefs about substitutability boil down to beliefs about changes in the energy import share in gne.
That is also how the critics get handled, in the talk more than on the page. Tom Krebs wanted a lower elasticity for chemicals; fine, says Moll, put it through the formula and see what share it implies. The Chancellor and the Economics Minister said, in Moll’s paraphrase, that “sheer physics stands in the way of these macroeconomic models”; his reply is that resource constraints and production functions are physics, and that the serious version of the objection, that the shock is 55 percent rather than 30 or that gas cannot be moved between plants, is a statement about the share and can be priced. What no reading of the physics delivers is the 10-percent-plus outcome a tenth of Brunnermeier’s poll audience had voted for before the talk began.
Where it sits
Context in sub-block 1.1, immediately after Baqaee and Farhi’s (2019) Beyond Hulten’s Theorem, of which it is the field test: Domar weight to first order, elasticities to second order, here for one input, one country and one month, with the second-order term written as a share. Read it for three things. The decomposition, because every “critical input” and chokepoint claim in blocks 1 and 2 is a claim that the second term is large, and this paper shows what a large second term implies for prices and shares. The horizon, because the exercise is calibrated to seven or eight months and the authors say plainly that a year on the elasticity is a different number. And the caveats it puts on itself, which are the ones to carry to the models that cite it: no demand amplification, no financial frictions, elasticities for a 30 percent shock extrapolated from estimates of small ones (Brunnermeier’s isoquant that goes Leontief far from the origin), and an off-the-shelf network with no gas in it. Russia turned off the pipeline that summer, and the sequel is the autopsy; here it is enough to say that nine economists said “substantial but manageable,” the government said physics, and the physics turned out to have an elasticity.