Notes on:
GPT as a Measurement Tool
NBER Working Paper 34834
7 May 2026
measurement · text as data · LLM
Talk · Paper · doi · PDF · Transcript
Made with AI: Opus 5 (reading and writing)
Part of AI and Economic Measurement, Spring 2026
Hemanth Asirvatham (OpenAI), Elliott Mokski and Andrei Shleifer (Harvard) — presented at the nber conference on ai and Economic Measurement, Stanford, 7 May 2026; discussant Matthew O. Jackson (Stanford); written from the nber working paper (no. 34834).
The rubric
You are an economist and you want to know something about people. Almost everything people generate is qualitative — speeches, sermons, diaries, syllabi, court opinions, Reddit threads, county websites — and you have historically had two options. One of the presenters put it this way on stage: “there’s like the sociologist route… or I’m going to go down the more econ route of I’m going to use the sliver of data that is quantitative.” Read forty things deeply and have no statistical power, or measure the thin quantitative residue and be several abstractions away from the thing you cared about.
So you hire research assistants. You write a rubric — “how populist is the rhetoric in this speech, 0 to 100” — you hand it to five people, you average them, and the average becomes a column in your spreadsheet. This is not a scandal; it is how a large amount of social science data has always been made. It is just expensive, and expense is what caps your sample.
gabriel — the package the paper introduces, which is what the talk was mostly about — replaces the five people with an api call. It is worth being precise about how little is going on here, because the authors are unusually insistent about it themselves. The paper: “gabriel is not a new machine-learning model and performs no training or fine-tuning of its own.” It is a prompt wrapper. You give it a spreadsheet and an attribute written in English, it asks gpt the identical question with the identical output schema once per row, in parallel, and it gives you back a number from 0 to 100 for every row. The authors’ analogy is Stata, and they push it further than you’d expect: “Stata has no secret sauce in performing a regression.” The claim under validation is not about their code. It is about whether gpt can be a measuring instrument at all.
The reason anyone cares is the price. In the talk: a hundred thousand full-text church sermons rated on ten attributes is “on the order of a million dollars… with human labelers[;] it’s 50 bucks with gpt.” That was the spoken version; the working paper’s own cost table is somewhat more conservative in both directions, and if you want exact figures you should take the table’s, not the stage’s. Either way the ratio is the story, and once labeling is nearly free the binding constraint on empirical work stops being money and starts being something else. Hold that thought.
Two words
The paper’s validation asks two questions, and both of them are forced to say what they literally mean. Is the number accurate — does it agree with an accepted benchmark, human coders where the construct is a judgment call, external data where a ground truth exists? And is the number direct — is it read off the text, or reverse-engineered from things the model already knows? The paper’s own example, spoken: “if I give a speech and I’m trying to measure how pro-environment that speech is, am I really measuring whether it’s pro-environment or is the model instead… measuring whether it’s liberal? That would be bad.”
Start with accuracy. Against four established human-labeled benchmarks, gpt-5 correlates with the human consensus at 0.78 on formality, around 0.71 across twenty-one Varieties of Democracy indicators (Lindberg et al. 2014), and 0.55 on politeness. If you stop reading there you conclude that the machine is somewhere between good and mediocre, and that politeness is hard.
The result the paper turns on
Then the paper asks the question that reframes the whole exercise: what score does a human get on this test? For every text rated by several people, compare the model’s correlation with the human mean against each individual human’s correlation with the consensus of the others, held out one at a time.
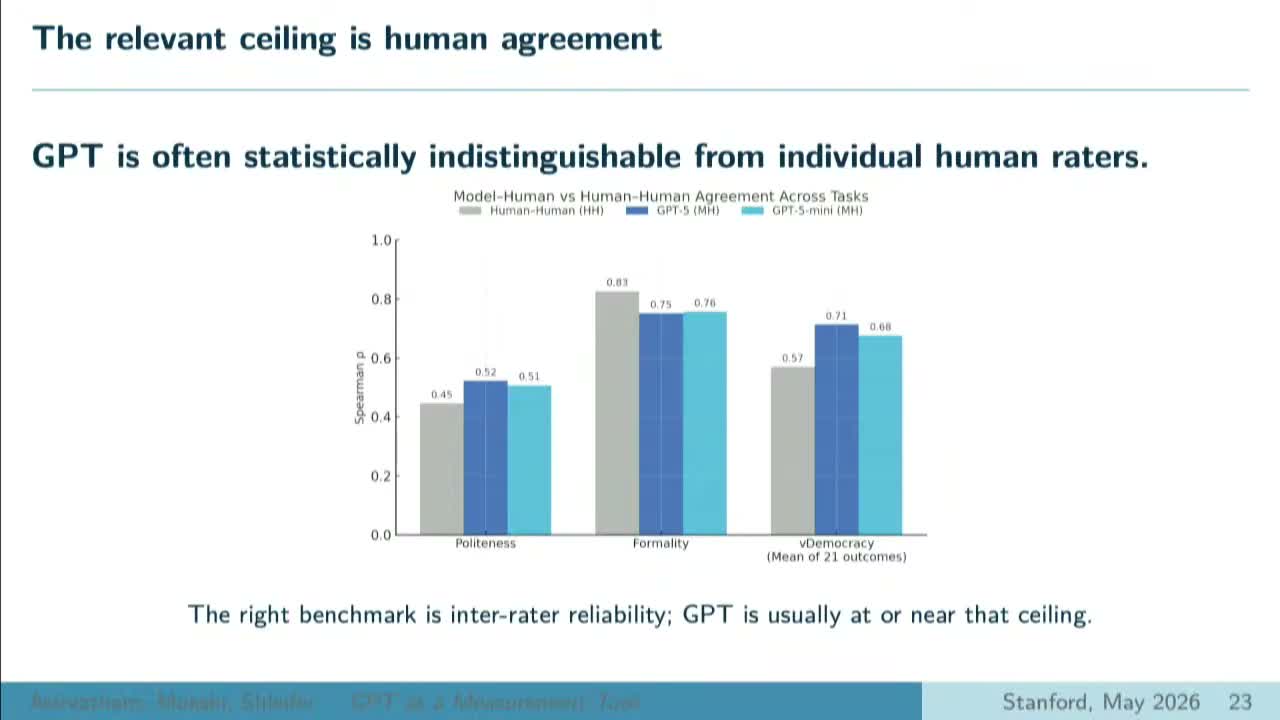
On politeness the typical individual human manages 0.45 against the consensus; gpt-5 manages 0.52. On the democracy indicators humans get 0.57 and the model gets 0.71. On formality the humans win, 0.83 to 0.75. The paper’s scoreboard, verbatim: “For gpt-5, the frontier model, across all 23 tested variables we find that gabriel outperforms humans on 13 (12 vDem outcomes and politeness), underperforms humans on 3 (2 vDem outcomes and formality), and is statistically indistinguishable from humans on the remaining 7.”
It is worth slowing down on what “better than a human” is doing in that sentence, because it is a subtler claim than the headline and a more interesting one. It does not mean the model is right and the humans are wrong. It means the model lands closer to what the humans collectively agree on than a randomly chosen one of those humans does. The 0.55 on politeness was never 45% wrongness; it was the residue of a genuinely contested judgment, in which five annotators shown the same one-line message scatter across most of the available scale. The benchmark was never a fact. It was a committee. Once you notice that, the relevant ceiling on any correlation with human labels is inter-rater reliability, and it is nowhere near 1.0 — which also means that every earlier paper scolding a model for failing to hit 0.9 against human coders was grading against a number no human was hitting either.
Doing it 1,141 times so you can’t accuse them of picking three
The obvious worry about four well-chosen datasets is that they were well chosen. So the authors went to HuggingFace, took roughly 317,000 candidate text datasets, filtered to those whose annotations were made by humans rather than machines, filtered again on permissive licenses, screened for suitability, and ended with about 338 prepared datasets carrying real human gold labels. From those they isolate 1,141 distinct binary classification tasks of the form “is this text an instance of X.”
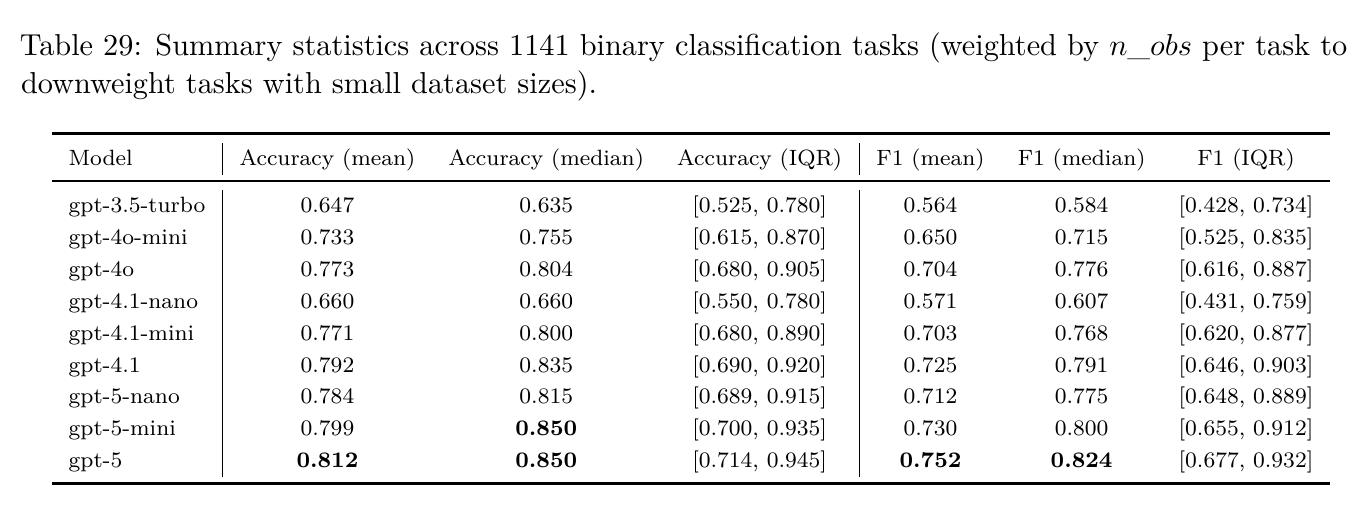
Median accuracy 0.850 for gpt-5, mean 0.812, interquartile range 0.714 to 0.945, median of 0.824. The more diagnostic number is one row up: gpt-5-nano, a tiny distilled model with very little room to store memorized facts, scores 0.784 and beats gpt-4o’s 0.773. The authors take this as evidence against the regurgitation story — “if pure regurgitation were the driver instead of reasoning, we would expect slightly older large models like gpt-4o to outperform tiny distilled models like gpt-5-nano. The opposite is true.” Fair. It is also fair to note, since nobody on stage did, that the eligibility screen for this benchmark and the per-dataset evaluation parameters were themselves set by gpt calls. The labels being matched are human. The question of which exams the candidate sits was answered in part by the candidate’s family.
Then there is the finding the authors clearly did not enjoy. They generated a hundred wildly different rewrites of their rating prompt — a mock-Jacobean one beginning “Peruse thou the whole of the foregoing text with utmost diligence,” an all-caps text-speak one, a curt one-liner — and found that “even very short and unsophisticated prompts result in essentially the same ratings.” Prompt length is essentially uncorrelated with agreement. One of the authors, taking the microphone back: “it was a real blow when I learned that uh our prompts were not magic but I think it’s probably good for the research community.” He is right on both counts, and the second one is the whole argument for the package existing.
Directness, and the one equation
For contamination, the design is nice: models have staggered training cutoffs, so compare each model’s accuracy on datasets posted before its own cutoff against those posted after. None of the models shows a statistically significant difference. The authors flag the weakness themselves — a HuggingFace posting date is only an upper bound on when the data first hit the internet — which is the correct way to hold that result.
For shortcut inference, they generate a thousand synthetic Labour mp campaign speeches with all environmental content deliberately excluded, plus a thousand pro-environment paragraphs to bolt on, and rate both versions on “pro environment” and on “left wing.”
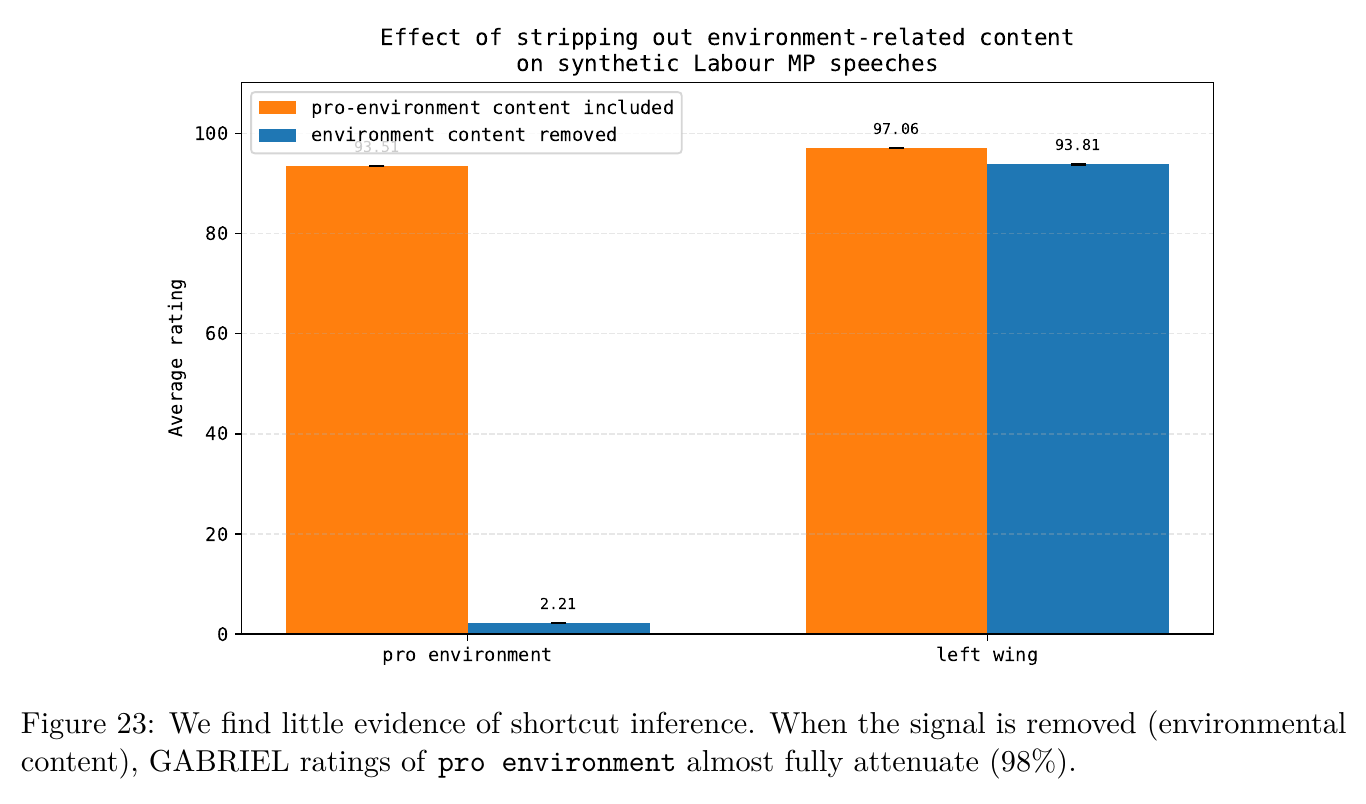
Take the environment out and the environment rating goes away; the political context that would have licensed a guess stays exactly where it was. On real data — web-scraped county business-regulation reports with every environmental passage excised — the environmental rating falls 81% rather than 98%, and the control attribute moves less than 10%. The gap is not shortcut inference; it is that the excision was imperfect, which the authors handle by modeling the rating as a sum of what was actually read and what was inferred,
where is the rating of the original document, the part driven by signal genuinely present in the text, the part inferred from context, and noise (equation 1 of the working paper); and then correcting the naive difference for whatever signal survived the stripping,
where is the rating of the stripped document, a separate measurement of how much related content is still in it, and the ols coefficient converting leftover content into leftover rating (equation 5). Debiased ratings then track the originals at an of 0.86 — which happens to be exactly the between stripped and original ratings of the control attribute, i.e. the practical ceiling. The authors’ own verdict on the tool they built for this: “debiasing may be unnecessary.”
What it buys you
The showcase application runs eighteen million English Wikipedia titles through a cascade of filters, deduplication and classification down to 37,000 historically significant technologies, each enriched with an invention year, an adoption year, an inventor, an institution, a country and a couple of dozen rated attributes; about 25,000 of them, invented between 1800 and 2010, carry the regressions. Prior datasets of this kind topped out at a few hundred. Adoption lags fall roughly tenfold across the industrial era, from forty to sixty years between working prototype and wide adoption by the target audience down to about five today. Twenty-two rated attributes explain 23% of the variation in how fast a technology moves relative to its contemporaries, with a couple of signs — specialized training predicting faster adoption, ease of use predicting slower — that are backwards on any naive reading, and the paper says so rather than burying it. Bell Labs turns out to be the most prolific single institution in the dataset at about 3% of attributable industrial-era inventions; California alone accounts for over a quarter of the technologies, and California, New York and Massachusetts together out-invent the other forty-seven states combined. On the question everyone in the room actually wanted answered: “software is fast, but it’s not fast because it’s unique. It’s because it’s just modern.”
The discussant, and the 1980s
Jackson discussed all three papers in the session together, and his opening frame was historians: this is work that used to take archives and careers, done “in… probably days or weeks.” He then made a pro-gabriel argument the authors had not made for themselves, which is that consistency is a virtue in its own right — “if you employ four different ras to go and do this and they each have a slightly different encoding techniques and so forth, you might end up with data that’s much worse than using a very simple system that you can give explicit directions.” And he offered the constructive push: use this to audit what we already have. “This approach could be used to start dealing with a problem that we’ve had for years which is understanding measurement error out there in data sets that are existing and have been used quite a bit… collect parallel data sets… and begin to understand measurement error better.” That is an invitation rather than an objection, and it is the most valuable thing said about the paper all session.
Then the warning, which is the part I would pin above the desk. Jackson: in the 1980s “there was suddenly minute-by-minute stock data that was available. People started analyzing it like crazy. We found the day of the week effects, the January effect, the index effect, um large cap effect. There were all kinds of particular anomalies.” And so: “as we start deploying these tools, it’s possible that we can become inundated with different interesting relationships that we couldn’t have seen before… we have to start disciplining ourselves or we’re just going to be under a sea of potential research questions.” When the cost of a variable falls to approximately zero, the supply of testable hypotheses becomes unbounded, and the scarce input is no longer the data — it is the theory that says which question was worth asking before you looked.
The authors picked this up in the Q&A rather than on the spot: “there is a need for understanding what we do with an explosion of data… having some more rigor and thoughtfulness about what we measure, or do we measure on one sample and then only run it once we’ve done all our experimental methods on a left-out sample, or things like that, to avoid p-hacking.” The working paper’s own best-practice appendix says the same, recommending that you finalize your attributes on half the corpus and only then run the held-out half. This is machine-learning hygiene imported wholesale into applied economics, and it is the correct answer. It is also, of course, an answer whose enforcement mechanism is entirely the honor system.
The question nobody wanted
The sharpest exchange came from a questioner the chair did not name, so I will not guess at one. The complaint: “I was kind of surprised about the complete absence of references to the existing tools in nlp. In fact, like natural language processing doesn’t appear in the paper at all… since 2018 we’ve had tools that do this with just encoder-only models… have you compared your data and accuracy to any bert models either off-the-shelf or fine-tuned?” And the sting in the tail: “these bert models just run on our laptops. They don’t require a server farm… and they basically do the same thing. So it seems to me maybe the future isn’t just using these massive behemoths that we have to prompt to do the work, but to build better small tools, small berts.”
One of the authors conceded the comparison — “there’s a few comparisons we do in the paper, but I think there’s like more to be done” — and then gave a real defense rather than a dodge: bert is something “you have to have technical skill to train… on one specific labeling task or a narrow range of labeling tasks. What we’re trying to accomplish with gpt[,] llm scale models[,] is the general nature of human comprehension… you just ask the question, you don’t train anything.” He granted the lightweight case outright, for anyone with a hundred million documents to get through.
That is a genuine disagreement about what the tool is for — generality without training, versus accuracy per watt — and not about whether the numbers are right. It is also true, and slightly awkward, that the paper’s own comparison baselines in the Metacritic exercise are bag-of-words and nltk: the pre-2018 techniques, which is precisely the comparison the questioner was objecting to.
Still, the honest summary of this paper is that it went and did the boring, enormous, unglamorous thing — 1,141 tasks, staggered cutoffs, a hundred deliberately terrible prompts, a synthetic corpus built solely to be mutilated — and reported the result even where it deflated their own product. The finding is that a rating of a speech is about as good as a person’s, and that “as good as a person’s” was always a noisier standard than anyone writing it into a methods section admitted. The tool that turns eighteen million Wikipedia titles into 37,000 technologies will also, next Tuesday, turn one afternoon into three hundred measured attributes, forty of which will clear — about fifteen of them by luck alone, and nothing in the output will tell you which fifteen.