Notes on:
The Remains of the Trade: The U.S.–China Trade War and its Aftermath
Working paper
13 September 2026
trade war · US-China · tariffs · global value chains
Talk · Paper · PDF · Transcript
Made with AI: Opus 5 (reading, adjudication, diagram and writing), GPT 5.6-Sol (reading), Fable 5.1 (adjudication), GPT 6-Astra (verification)
You are a Chinese exporter of frozen cobia. Essentially every fish you sell abroad goes to the United States — in the 2023 trade data the share rounds to one, which is the sort of number that makes an empiricist check the code twice. Then the United States shuts the door. You cannot eat the fish and you cannot instantly grow a European market, so you slide down your supply curve and cut your price. And here is the step the whole paper turns on: you quote one f.o.b. price to the world. You do not cut the American price. You cut the price. Every buyer in every other country wakes up to cheaper Chinese cobia, whether or not they have ever heard of a Section 301 tariff.
That is the transmission mechanism in “The Remains of the Trade: The U.S.–China Trade War and its Aftermath,” by Pol Antràs, Adrian Kulesza and Andrea Presbitero — a September 2026 draft, seventy-four pages, unpublished and labelled work in progress, with a companion website that is more of the paper than the paper is. One tariff on one product becomes one scalar price decline per product, and that scalar is the only thing that ever reaches a third country. Everything else in the paper is bookkeeping about who gets hit by it and how.
A note on dating, because it matters throughout. An earlier version of this was presented at the second AlUla Conference for Emerging Market Economies on 8 February 2026, seven months before this draft, and essentially every headline number moved in between. So did one of the four margins, which was deleted. Where a number below comes from the talk I say so; where it comes from the draft I say that instead; I never mix them.
The setup. China’s share of us goods imports went from about 22 percent in 2017 to about 8 percent in early 2026, and the us share of China’s exports from about 20 to about 10 (draft, Figure 2). China exported $3.77 trillion of goods in 2025, so a ten-point swing in the us share is a redirection the draft describes as “comparable in size to the gdp of certain high-income economies such as Chile, Portugal or Greece.” The trade-weighted us tariff on Chinese goods stood at 47.5 percent in November 2025.
The obvious thing to write about this is diversion: who replaced China in the American market. The draft goes out of its way not to write that paper. Countries hit with higher Liberation Day tariffs did not visibly lose us market share — the cross-partner slope has a t-value of −3.91 that collapses to −0.87 under robust standard errors, is driven by China alone, and reverses sign unweighted. Taiwan and Vietnam grew their us sales while carrying announced rates of 32 and 46 percent. Section 3 opens by setting aside “this narrow diversion narrative” and turns to the markets where the displaced goods actually went, which is everywhere else.
One price, four ways to be hit
The shock itself is one line (eq. 4, draft p.16):
where is the proportional fall in China’s world price of product , is the share of China’s exports of that used to go to the United States, and are the demand elasticities China faces in America and on average worldwide, is the elasticity of Chinese export supply, and the last term is the tariff change from January to September 2025. The load-bearing assumption is that is finite. Let Chinese supply be perfectly elastic and is zero, nothing travels, and there is no paper.
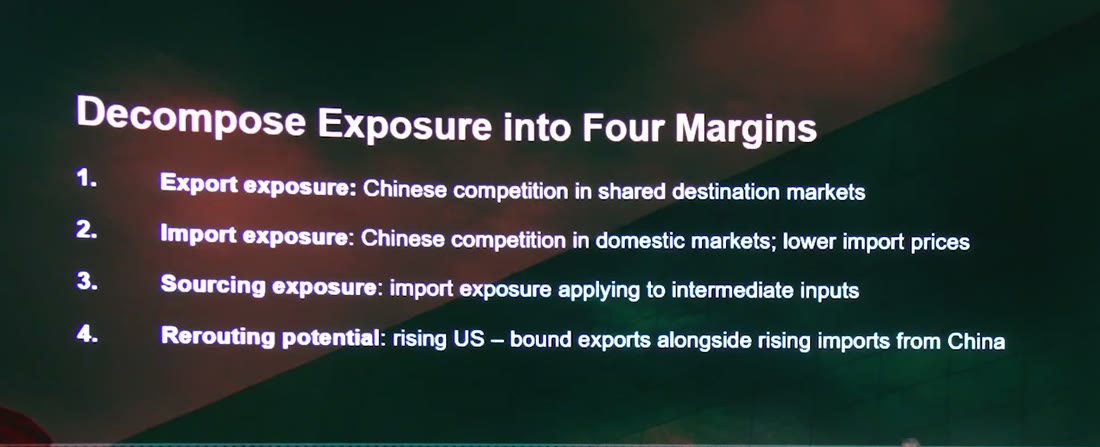
From that one scalar, four channels fan out, and they are not variations on a theme — they hit different people in different directions. Chinese goods arrive in the markets where you sell (export competition). They arrive in your own market and displace your producers (import competition). They arrive in your own market and make your shopping cheaper (consumer gains). They arrive as components and machines and make your production cheaper (sourcing gains). Antràs put the last two to the room plainly in February: cheaper Chinese goods are “a good thing for consumers,” and “if you can buy your inputs, your components, your machines cheaper than you did before, that is going to enhance your productivity.”
Three of the four are the same object — a scalar weight multiplying for the same product. The fourth is not, and it is the one people will get wrong. Sourcing gains put the shock inside the input sum: the gain to output runs through the price falls of its inputs . A product with of exactly zero can still gain, if something it is made of got cheaper. The draft is emphatic that this “is not simply a version of our consumer gains index restricted to intermediate inputs,” and it is right, which is why the schematic draws that branch differently.
The argument is against a measure, not a country
Here is what the paper is actually for. Everyone — ministries, the imf, the literature — measures exposure to China with a Finger–Kreinin similarity index: sum over products and destinations of the minimum of your export share and China’s export share. Antràs described his own conversion to scepticism in February with unusual candour: “everybody’s using this measure but why… I’m a theorist by heart, so I started thinking why should I be using this measure, and then what we realize is maybe we shouldn’t.”
Put the benchmark and the replacement next to each other (eqs. 2 and 7 of the draft, pp. 15 and 18):
Four differences, and every one of them is a defect on the left. The minimum becomes a product. The China-side share stops being China’s share of China’s own basket and becomes China’s share of the destination’s absorption — because what should frighten you is how much of that market China already supplies, not how much that market matters to Beijing. An elasticity appears, converting a price fall into a share shift. And the shock appears at all: similarity has no in it anywhere, so it cannot say that the pressure is fiercer in some goods than others. It is also symmetric, which the draft skewers by noting that the index “would imply that China is as impacted by competition from Honduras as Honduras is impacted by competition from China.”
Symmetry is the joke; the missing shock is the substance. Two countries can look identically similar to China and be affected completely differently, and when you actually compute it, they are. Similarity ranks Vietnam, Taiwan, South Korea and Japan at the top — the big diversified manufacturers that look like China. Model-based export competition keeps Vietnam and throws out most of the rest.
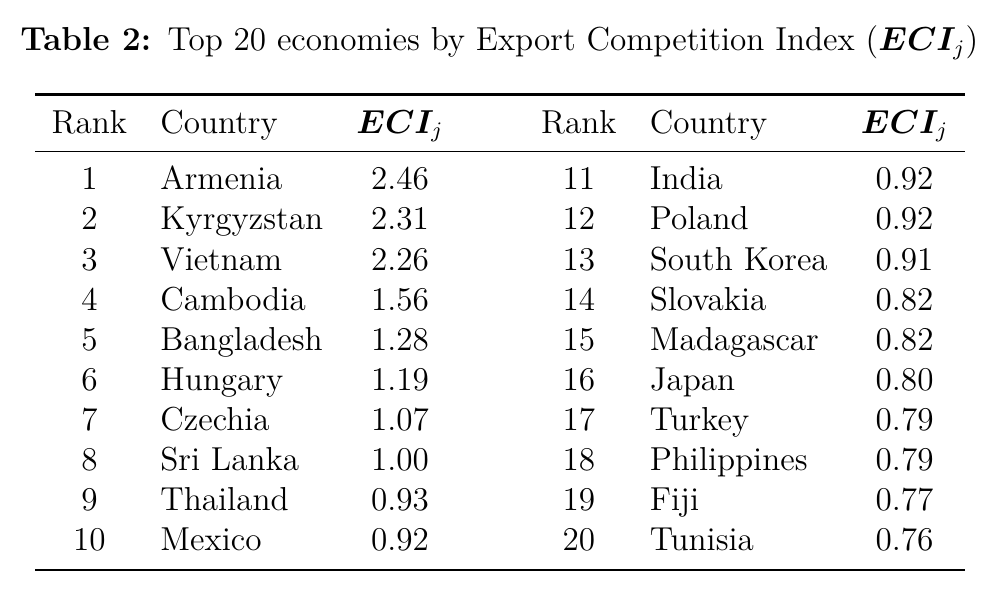
The two rankings correlate at 0.493, which is high enough to look reassuring and low enough to change every policy conclusion. On the import side it is worse, or better, depending on your appetite: import similarity and import competition correlate at −0.039, and only Czechia, Japan and Poland appear in both top twenties. The reason is the one Antràs gave in February with Saudi Arabia as his standing example — the Kingdom buys from China much of what America buys from China, and is nonetheless not hurt by it, because there are “very few local producers of the set of things that Saudi Arabia imports.” Similarity cannot tell that from a threat.
Every index number carries a clause you must not drop. These are first-order predicted changes for the covered basket of products, with shares re-normalised over the products that survive the elasticity coverage, and for export competition and sourcing gains the destinations exclude the us and China. Armenia’s 2.46 is not a forecast that Armenian exports fall 2.46 percent. Footnote 7 of the draft says so, and Appendix B.3 adds that the re-normalisation “leads to the possibility that the indices do not accurately reflect the aggregate trade flows of a country,” which is a sentence most authors would have found a way not to write.
And now the funny part. Decompose the variance of the log price shock across products, and the export share — one observable number you can compute in an afternoon — accounts for 78.4 percent of it. The elasticity ratio accounts for 18.9 percent. The tariff changes, the actual policy, account for 2.6 percent. Shock and share correlate at 0.831 in levels and 0.963 in ranks, and the export-competition index computed with all the elasticities stripped out correlates with the real one at 0.974. The ces machinery is doing real conceptual work — it is what tells you to use absorption shares instead of basket overlap — but the cardinal ranking it produces is very close to one trade share. The top of that trade share, in the paper’s own Table 7, is frozen cobia, fresh anchovies, organo-sulphur compounds, salted anchovies, Norway lobsters, decaffeinated coffee and ski-lifts.
The three tests, and they do not agree
Now the part that deserves the most care, because the paper does something admirable and easy to misreport: it runs three validation exercises, prints all three, and one of them fails.
The failure is on the us side. From ces demand, conditional on the tariff, the endogenous fall in the Chinese price should cushion the contraction in us purchases — the tariff term enters negatively, the price term positively. That is not a decoration on the model; it is the same supply-curve logic that generates in the first place. So they test it directly, in log changes.
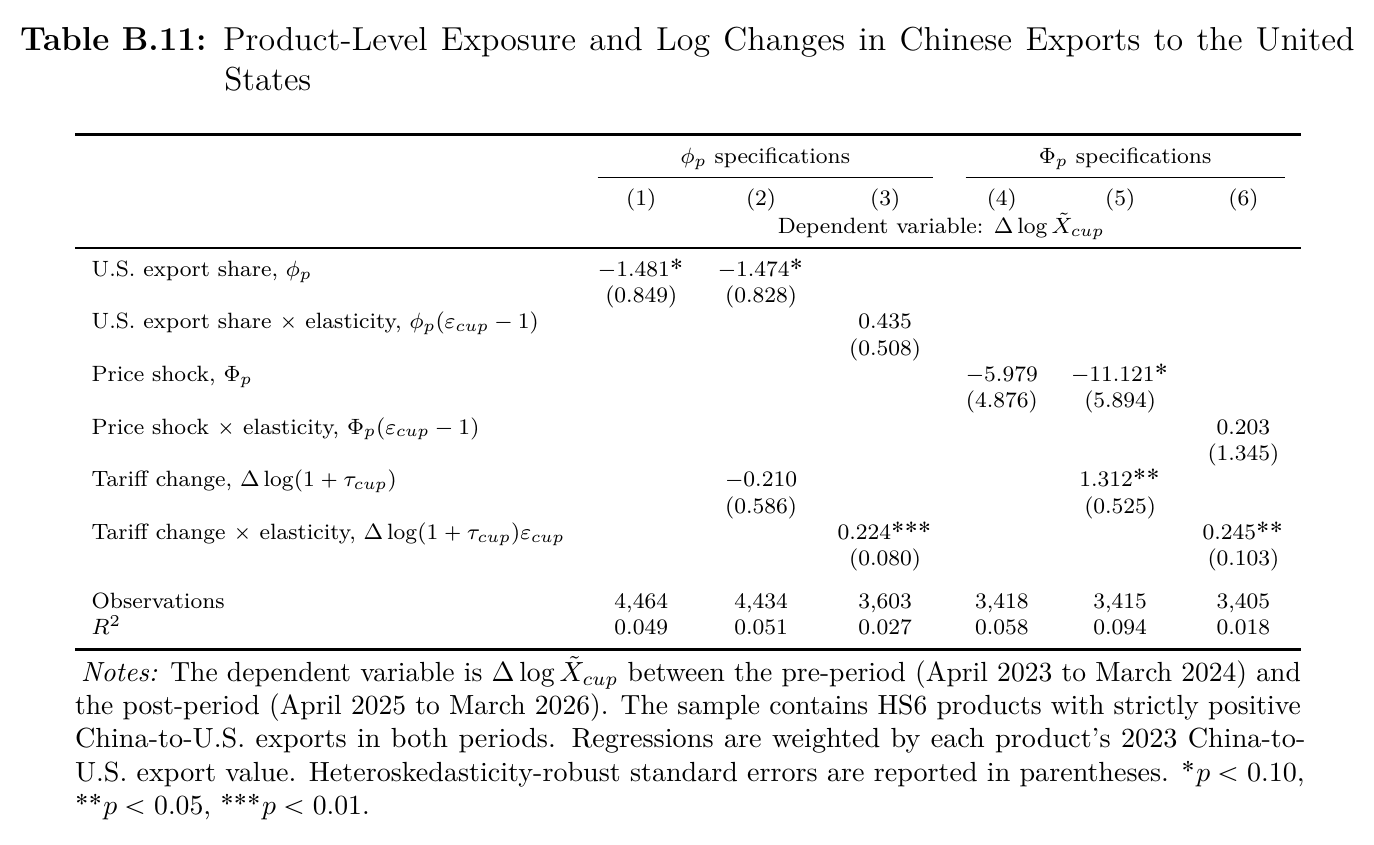
Be precise about what fails. Wherever the shock enters in levels, the price term has the wrong sign — the export share at −1.481 and −1.474, the price shock at −5.979 and −11.121, all four opposite to the model. The tariff coefficient does carry the predicted negative sign in column (2), at −0.210, but it is nowhere near significance, and in column (5) it turns positive and significant, which is the more damaging line. In the two columns that interact with elasticities the price terms come out positive, at +0.435 and +0.203, exactly as the model says — and cannot be distinguished from zero, while their tariff components go the wrong way. So: right sign without precision on one side, wrong sign on the other, and no column that recovers the pair. That is what the authors claim and no more, and the standard errors of 4.9 and 5.9 on the price terms mean this is a failed sign test, not a precisely estimated refutation. Their own explanation is that statutory tariffs are “a noisy or imperfect proxy for changes in the effective trade barriers” once you allow for exemptions, enforcement, avoidance and non-tariff measures — remember that sentence; a minister is about to say it back to them from the floor.
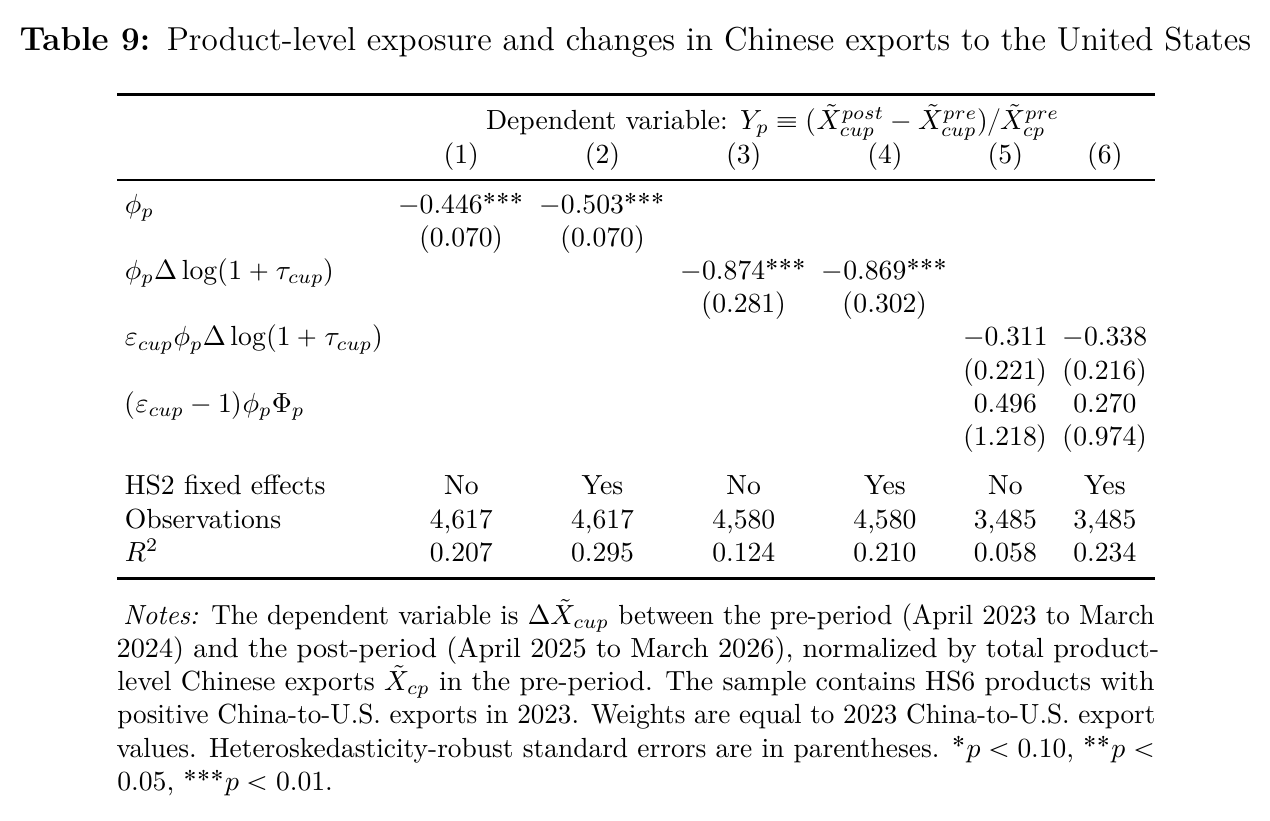
“Motivated by this failure,” they say, they rescale: instead of the log change in Chinese sales to America, take the level of the contraction divided by China’s total pre-period exports of the product. The model then predicts a negative direct tariff term and a positive price offset.
And the third test, the one the indices actually lean on, passes. Look not at the American market but at third markets: do Chinese exports of high-exposure products grow faster everywhere else? They do, robustly, with destination fixed effects and two-way clustering. The theory pins one of the coefficients at exactly 1; the estimate sits above it and the hypothesis that it is 1 cannot be rejected. The paper puts the magnitude at roughly 13.7 percent faster growth to a non-us destination for a ten-point rise in a product’s us exposure. It is fragile in the way such things are — strip the weights or go to HS6 fixed effects and it fades — and the authors call it evidence of “a broad cross-product reallocation pattern,” not a causal estimate.
Stack those up honestly and you get three layers, each true. The product-level reallocation survives: goods China used to sell to America contracted in America and grew faster elsewhere, and the model ranks those goods sensibly. The conditional structural story about why — the cushioning — fails its direct test, and the authors say so in one flat sentence. The gentler levels version gets both signs right and cannot tell either from zero, and loses the sign when you take the weights off. What has never been tested anywhere in the paper is the thing everyone will quote from it: the country rankings. No exercise checks a realised export loss, domestic-sales loss, import-price gain or sourcing gain for any country, and the authors decline causal or quantitative validation outright, calling the whole exercise “a qualitative check on whether the model aligns with broad cross-product patterns in the data.”
A paper that publishes its own failed validation, in an appendix table it could easily have dropped, and then tells you in the main text that it failed, is behaving better than the median paper. That is worth saying plainly, because the sentence “the paper’s own test refutes its mechanism” is wrong, and so is “one test is a bit noisy.”
What the dashboard knows
The paper reports 110 economies. The companion platform publishes all 224, with a tab that switches between them, and the gap between the two is the most interesting undocumented thing in the project.
The screen is stated in the draft and is perfectly reasonable: drop populations under 200,000, drop Hong Kong and Macao as special administrative regions of China, then drop any country where each index covers less than 25 percent of the underlying trade flows. What the draft does not do is name a single country the rule removes. The site hands you the coverage columns, so you can.
Almost all of the bite comes from one index. Import competition needs the share of each sector in a country’s domestic sales, and HS6 domestic production data do not exist, so the paper proxies it with export shares and warns that this “introduces noise… so our results below should be treated with a grain of salt.” An economy whose exports are two commodities therefore has almost no import-competition coverage by construction — the proxy has nothing to work with. In the draft’s own coverage appendix, the import-competition index has by far the lowest median coverage of the four, a minimum of zero, and a couple of dozen economies sitting at exactly zero before the screen is even applied.
On the site’s coverage columns, Saudi Arabia scores 75.4, 18.5, 68.0 and 76.6 across the four indices: excluded on one of four, by a single number, with three-quarters coverage elsewhere. Australia is 42.8, 12.8, 66.9, 43.2. Nigeria is at 17.8 on import competition, Qatar at 5.7, Algeria at 6.1, and Iraq, Angola, Libya and Turkmenistan at 0.0. Resist the conclusion that commodity exporters are screened out wholesale — they are not. Kazakhstan, Russia, the uae, Chile, Peru, Azerbaijan, Venezuela, Iran, Paraguay, Ghana and Colombia all survive into the 110, and they head the consumer-gains and sourcing-gains tables. The honest formulation is narrower and more interesting: the screen is an import-competition coverage screen computed on an export-share proxy, so it falls hardest on economies whose exports are concentrated in a handful of primary commodities, and it takes them out of all four tables to protect one.
The site, meanwhile, ships the full 224-economy panel, ranks countries within whichever sample you pick, and warns that its rankings will not match the published tables — which is fair, since on sourcing gains the entire published top five drops out of the full-sample top five. Its data dictionary is careful about the consumer-gains index being an import-price decline rather than a cpi change, almost verbatim from the paper. On import competition it says only “Equation (10).” The one index whose denominator is a proxy, whose missing values drive the sample screen, and about which the paper asks for a grain of salt, is the one the dashboard describes in three words. The caveat and the silence are the same fact seen twice, and a visitor who never reads the paper gets the number without the warning.
The room
The responses in AlUla did not come from academic discussants. They came from two ministers and a central bank governor, which turns out to be a considerably better use of forty minutes.
The Saudi minister did not touch the indices at all. His theme was that reallocation is a test of institutional delivery, and that the scarce input is speed: “Time is not neutral — delay carries macroeconomic cost that compounds over time.” Countries will be “takers of a new global economic order” or “central actors in this reallocation,” and he wants a “modernized continuously evolving rules-based system.”
Then Argentina’s minister got ten of the six minutes he had been allotted and earned every one of them. He had been reading the paper — “it was actually a book more than a paper” — when his email alerted him that he had to go and sign the trade agreement with the United States. “And suddenly I was inside the paper.” He then narrated the paper’s predictions against his own negotiation. To decide what to ask the Americans to open, Argentina used what he credited to Ricardo Hausmann as the product-space method — if the countries that export your good also export some other good, the two are close — to find goods adjacent to its revealed comparative advantage; the outcome was that the us kept the reciprocal tariff in general but “on about 2,000 products they basically retracted that reciprocal tariff to zero.” The agreement was also, domestically, a way to “break a little bit that barrier that Mercosur was.” On China, he said, the Americans asked for “more like a surveillance thing.”
His challenge was the good one. Mercosur negotiated with the eu for twenty-six years and then suddenly signed, and signed with efta too, and he does not think that is independent of what Washington has been doing. “Is it possible… that the rupture of multilateralism may at the end lead to more trade and not less trade?” And his explanation for two decades of flat trade-to-gdp was not tariffs at all but standards, certifications and sanitary rules, which he called infinite tariffs: “If you put a sanitary barrier, it kills trade. It just goes to zero.”
Which is, almost word for word, the draft’s own excuse for its failed test. The reason the authors give for statutory tariffs failing to deliver the predicted signs is that statutory tariffs are not the barrier firms actually face. A minister who negotiates them for a living volunteered the same diagnosis from the floor, without having seen the appendix table.
Ethiopia’s central bank governor took the other side of the Argentine question — “whether this attack on rules based regime is necessarily beneficial to the world, I will leave it as a question” — and then landed the sharpest technical objection of the session. Looking at the top-20 tables, he pointed out: “you have Djibouti on the top in one area — by the way, that exactly means Ethiopia, because most of the import that comes to Djibouti… is destined to [Ethiopia].” An index built on bilateral import flows reads an entrepôt as an exposed economy. He also volunteered that the margins he found most valuable were the price-decline one and rerouting — that is, the one that has since been renamed and the one that has since been deleted.
Antràs replied to each in turn, and was candid. To the Saudi minister on speed, he offered the work with his PhD student on the average period of production: in the first trade war, sectors reallocated at predictably different speeds, “something that policy makers can use to try to predict which are the sectors that can move things more quickly,” which is now an appendix of the draft. To the Argentine minister he said, in order: “I congratulate you on your deal,” and then, “I would push back on the notion that this is a development that will lead to more trade. It will lead to more trade agreements… are we going to end up with more trade? I’m a little bit skeptical. And I also worry about the terms of those deals.” More instruments, on worse terms, is not more trade — a distinction the draft never tests, and an unusually direct thing to say to a man who had signed one that week. To the governor he agreed about intra-African trade and offered Spain after 2008 as a case where a collapse in domestic demand produced a durable export expansion.
He did not answer the Djibouti point. His replies came before the moderator’s follow-ups, there was no second round, and the session closed for time.
Anyway. In February, Saudi Arabia was the running example: the country with high import similarity to the us and low import competition, because it has few local producers of what it buys from China. In the September draft, Saudi Arabia appears exactly once, in the acknowledgements, as the venue. It is in none of the six tables. That is not a reaction to anything said in the room — it is the coverage rule doing its job, an import-competition coverage of 18.5 against a floor of 25, because the export-share proxy for domestic sales has almost nothing to work with in an oil exporter. Djibouti, Haiti, Lesotho and Myanmar, all of which were in the February top twenties, went the same way, at coverages between zero and 1.3. The governor’s transit-port objection was correct and the paper removed Djibouti for an entirely unrelated reason, which is the kind of thing that happens when a screen is honest and a critic is right at the same time.
The title is the authors’ own joke, and they explain it on page 2: much as in Ishiguro, “the drama here lies less in rupture than in reorganization.” The aggregate trade-to-gdp ratio is flat, nobody is deglobalising, and underneath, a scalar you cannot observe is quietly reordering who sells what to whom — mostly, on the paper’s own decomposition, according to a trade share that was sitting in the data the whole time.