Notes on:
An Equilibrium Model of the International Price System
American Economic Review
2022
geoeconomics · currency dominance · invoicing · Renminbi
Paper · PDF
Made with AI: Fable 5 (reading), Opus 5 (writing)
Dmitry Mukhin (lse). American Economic Review 112(2), 2022, pp. 650–688; page and section cites follow the published version. The only Mukhin seminar video found (Online ifm, October 2020) turns out to be the companion paper with Egorov on optimal policy under dollar pricing, so it is not used here; pdf-only digest. Figure and table are cropped from the pdf.
A price system, not just a pricing convention
Two-thirds of world trade is invoiced in dollars, and the countries whose currency is the dollar or is pegged to it account for about a fifth. The two-thirds is the model’s own number rather than a measurement, because no global invoicing data exist; in the subsample of countries that do report, the dollar takes 53 percent of exports against a 12 percent trade share, so the gap is there in the data too. Gopinath and Stein (2021) explain that gap through safe-asset demand; Mukhin explains it through the goods market alone, with a model in which every exporter in the world chooses the currency of its sticky price, and the choices hang together. The title’s “system” is the point: currency choice is a coordination game played through input-output linkages and competitors’ prices, and once it is written down as a general-equilibrium model with real trade data it can be solved, fitted, and run forward.
Why anyone would invoice in a third country’s currency
An exporter from selling in sets a sticky price and wants it to stay close to its desired flexible price. That desired price (eq. 15) is a weighted average of its marginal cost, which depends on its own currency and on the prices of the intermediate inputs it buys from everywhere, and of competitors’ prices in market , which depend on what currencies they invoice in:
where is the candidate invoicing currency, the share of intermediates, the strength of strategic complementarity in pricing, and the ’s exchange rates. With no intermediates and no complementarities the desired price is stable in the producer’s currency and producer-currency pricing is always optimal; in autarky it is stable in either the producer’s or the customer’s currency and the choice is between those two. A vehicle currency only becomes optimal when enough of an exporter’s costs and competitors are foreign (Proposition 1): if suppliers and rivals price in dollars, one’s own optimal price is most stable in dollars, and so on around the loop. Openness and global value chains therefore create the incentive to coordinate, and the strong complementarity that sustains dollar pricing also allows multiple equilibria.
Which currency wins is then a question about fundamentals, which Mukhin isolates in the flexible-price limit where the equilibrium is unique. Two things favour the dollar. Size: as long as the United States has positive weight in world trade, there is a region of parameters where dollar pricing is the unique equilibrium, and it grows with that weight (Proposition 2). Anchoring: even among symmetric countries, a currency with lower idiosyncratic volatility — because others peg to it — is a better approximation to the diversified basket every exporter would ideally price in, so the dollar’s role as the anchor of emerging-market exchange-rate policy feeds its role as the vehicle currency of trade (Proposition 3). The parameter is the size of the hard-peg bloc, the tightness of the crawling pegs. Section iic adds that the transition between vehicle currencies is gradual and starts with trade involving the issuer itself, which is how sterling gave way.
Fitting the world
The full model has Calvo pricing, fixed costs of switching invoicing currency, many sectors, and is calibrated to world input-output tables and the 2001–2015 covariance matrix of exchange rates and inflation, that window being only the last of three: the model is estimated sequentially for 1995, 2005 and 2015 off the fifteen years running up to each date, which is the machinery that carries history forward. Firms’ optimal choice maximizes a statistic (Proposition 4) that rewards the currency whose exchange rate moves most closely with the exporter’s desired price and then subtracts that currency’s own variance and its inflation, so the winner is the currency in which a price left unchanged drifts least out of line. Almost none of this is fitted to invoicing: the trade shares come from the input-output table and the exchange-rate and inflation moments from the data, and the only invoicing moment targeted is the 1995 dominant-currency share, which is what pins the fixed cost of switching currency at . The pass-through of exchange rates into domestic prices across countries — high in Latin America and other dollarized economies, low in Europe — is not observed prices at all but a sufficient statistic read straight off the input-output table, and it is offered as description; the invoicing data are held back and used to judge the fitted model instead.
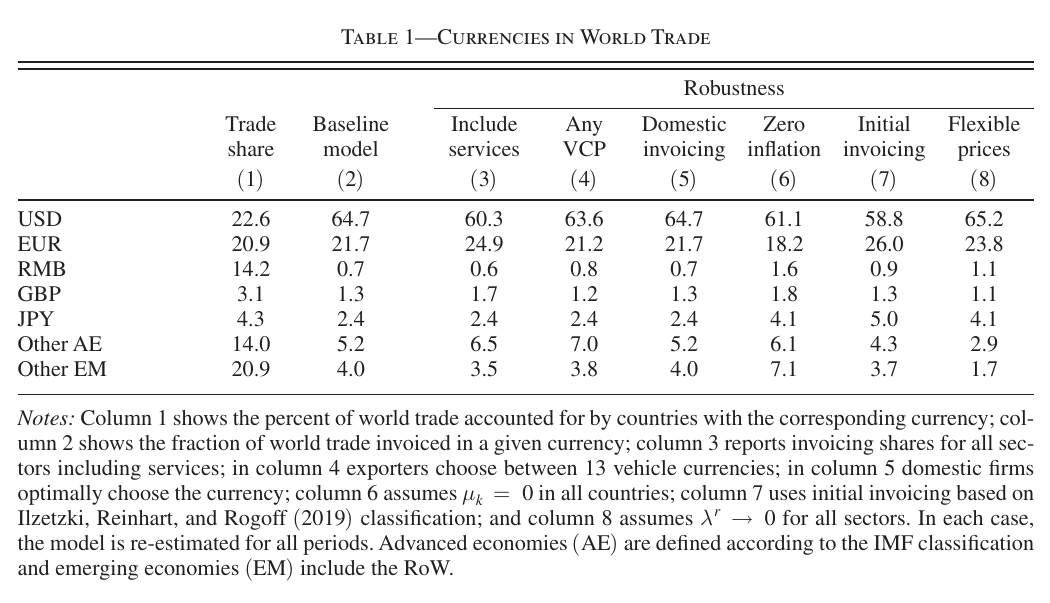
The model gives the dollar 65 percent of world trade invoicing against a 23 percent trade share for the dollar bloc, the euro 22 percent against 21, and the renminbi under one percent against 14. Size explains a third of dollar use; the rest is coordination. The cross-country pattern of import invoicing and Switzerland’s sectoral invoicing shares are matched as well, and a naive invoicing rule (price in the buyer’s or seller’s currency) fails the same tests.
The future of the dollar, in five bars
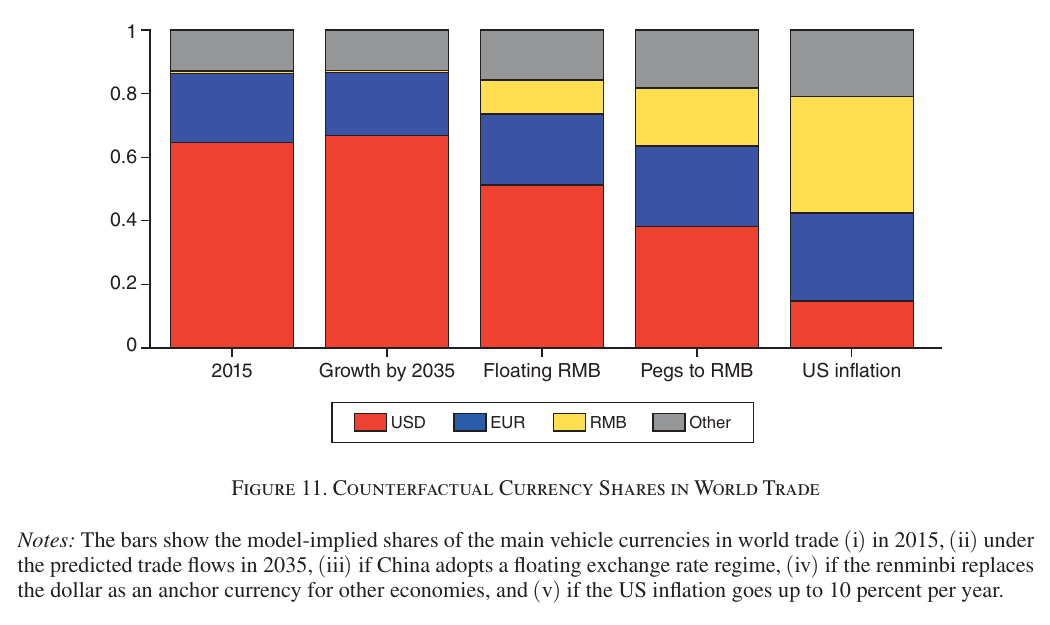
Chinese growth alone does nothing for the renminbi — by 2035 the dollar’s share rises slightly, because the emerging economies gaining weight are dollar-pegged. A floating renminbi gets to 11 percent, less than China’s trade share, and is almost never used between third countries. If emerging markets re-anchored to the renminbi it would reach 18 percent and the dollar would fall to 38, with several regional currencies in the Eichengreen manner, but no new dominant currency.
References
Where it sits
Context in 3.1, and the quantitative benchmark for the sub-block’s geoeconomic questions. Internationalizing Like China (Clayton et al. 2025) and Bahaj–Reis (2026) ask whether policy can move a currency’s international role; Mukhin says how far it has to move and which levers count — pegs and the issuer’s own stability, not trade share. The dominance-and-coercion papers in 2.2 and 3.1 take the dollar’s position as the hegemon’s endowment; this is the model of where that endowment comes from and what would end it, and its last counterfactual is the one the sanctions literature should keep in view, since weaponizing the currency is a shock to its issuer’s reliability rather than to anyone else’s size. It stays context because it is a pre-geoeconomic paper — there is no government in it with a strategic objective — and because the group is likely to know it; read Section II and Section iiif.